

 PDF
PDF Citation
 Print
Print


INTRODUCTION
As the maxim “if you can't measure it, you can't manage it”1 states, grasping the current status of acute stroke care is the first step to improving its quality. For this purpose, nationwide reports have been published using various data sources, mainly from multi-center registries and national audits.23456789 Registry-based reports have limitation in representativeness because the voluntary nature of registry participation leads to the exclusion of low-volume and low-quality hospitals.81011 On the contrary, national audit-based reports have a weakness in terms of their comprehensiveness. Data for national audits usually come from administrative data resources; therefore, they focus on limited areas of stroke care such as intravenous thrombolysis (IVT) and stroke units.
We had the opportunity to access data from the Acute Stroke Quality Assessment Program (ASQAP), which is a national stroke audit program by the Health Insurance Review and Assessment Service (HIRA) that covers most acute stroke patients treated in acute care hospitals in Korea.12 We also used included patients' insurance claims data, which allowed us to extend our coverage on stroke management profiles not evaluated by the ASQAP.
Using the most recent data from the ASQAP (2013 and 2014), we aimed to 1) describe the national average of acute stroke management and compare it to those of other countries and 2) elucidate the disparities in acute stroke management according to hospitals and regions.
METHODS
Study subjects
In 2005, the ASQAP was initiated under the National Health Insurance (NHI) Act and Medial Aid Act by HIRA. After its first assessment in 2005, the HIRA performed repeated assessments in 2008, 2010, 2011, 2013, and 2014.12 Each assessment included evaluation of acute stroke patients during a 3-month study period. We analyzed the latest data collected on the 5th (March to May 2013) and the 6th (June to August 2014) surveys under HIRA's permission.
Eligibility criteria included patients 1) who were admitted through an emergency room within 7 days of symptomatic onset, 2) whose International Classification of Diseases, Tenth Revision primary discharge code was I60 (subarachnoid hemorrhage [SAH]), I61 (intracerebral hemorrhage [ICH]), or I63 (ischemic stroke [IS]), and 3) who were treated in general or tertiary hospitals that claimed more than 10 acute stroke cases during the assessment period. An analysis unit was a single stroke episode; admission in different hospitals was combined into one episode if a patient was treated in two or more hospitals during the same episode. If stroke episodes differed by 2 or more days in terms of the onset date, they were considered as separate.
Data collection
ASQAP data, claims data, and death certificate data were used for this study. ASQAP data were based on information submitted by the participating hospitals and consisted of the treatment capacities of the hospitals, patients' demographics, stroke characteristics, quality indicators, and outcomes. From claims data details of acute stroke management not assessed in the ASQAP were obtained. Operations and interventions were considered to be performed when each corresponding claim code was issued during a predetermined period (72 hours from admission for endovascular treatment [EVT] and 30 days for others). Mortality of the cases was collected from death certificate data.
Using these 3 types of data, we collected the following information at the hospital-level: the presence of a stroke unit service, number of beds, stroke admission patient volumes, IVT volume, EVT volume, hospital locations at the district level, and the proportion of patients who were referred from other hospitals. Referral from other hospitals was defined as the presence of claims data with primary discharge diagnosis codes of I60–I64 from a hospital other than the hospital under assessment and whose claims-issuing date was between first-found abnormal time (FAT) and arrival time at the hospital under assessment. Centers and procedures were considered to be high-volume if they: 1) treated over 300 stroke cases per year, 2) treated over 24 IVT cases per year, and 3) treated over 14 EVT cases per year. The volume cut-off values related to IVT and EVT were based on the eligibility criteria for the comprehensive and thrombectomy-capable stroke center certification program by the Joint Commission.13
At a patient level, we collected information on age; sex; primary discharge diagnosis code; last known normal time (LNT); FAT; ambulance use; arrival time; stroke severity scale scores (National Institutes of Health Stroke Scale [NIHSS] scores for IS and Glasgow Coma Scale [GCS] scores for ICH and SAH); diagnosis of atrial fibrillation; admission unit; length of stay; modified Rankin Scale (mRS) score at discharge; discharge destination; IVT; EVT; various other interventions and operations; anti-thrombotic agent administered at admission and discharge; and 1 month, 3 month, and 1 year mortality rates.
Statistical analysis
Results of descriptive analyses are presented as frequency (percentage) for categorical variables and as mean with standard deviation or median with interquartile range (IQR) for continuous variables. Missing values existed in LNT (1.2% in any stroke), admission unit (0.6% in any stroke), NIHSS (9.3% in IS), GCS (28.0% in ICH, 21.5% in SAH), and mRS scores (29.8% in any stroke). Cases with missing values were excluded only from the analysis of the corresponding variables. Statistical analysis was performed with SAS software version 9.4 (SAS Institute Inc., Cary, NC, USA).
Ethics statement
This study was approved by the Institutional Review Board of the Seoul National University Bundang Hospital (No. X-1704-393-906). We were provided with hospital- and patient-level data from which information on personal and hospital identification was removed according to the Act on the Protection of Personal Information Maintained by Public Institutions. The data were kept on a separate server managed by the HIRA, and only pre-authorized researchers were approved to access it remotely.
RESULTS
General characteristics
A total of 19,608 patients who were treated in 216 acute stroke care hospitals during the study period of 6 months were analyzed. The mean age was 67.7 years, and slightly more than half of the patients were men (Table 1). The majority of strokes were IS (76%), followed by ICH (15%) and SAH (9%). Patients with SAH were younger and more likely to be women than those with IS and ICH (Supplementary Table 1). Severity showed right-skewed in IS, and J-shape distributions in ICH and SAH (Supplementary Fig. 1). More than half of stroke patients had mild deficits at admission (NIHSS score ≤ 4 or GCS score ≥ 13): 61% of IS, 54% of ICH, and 60% of SAH.
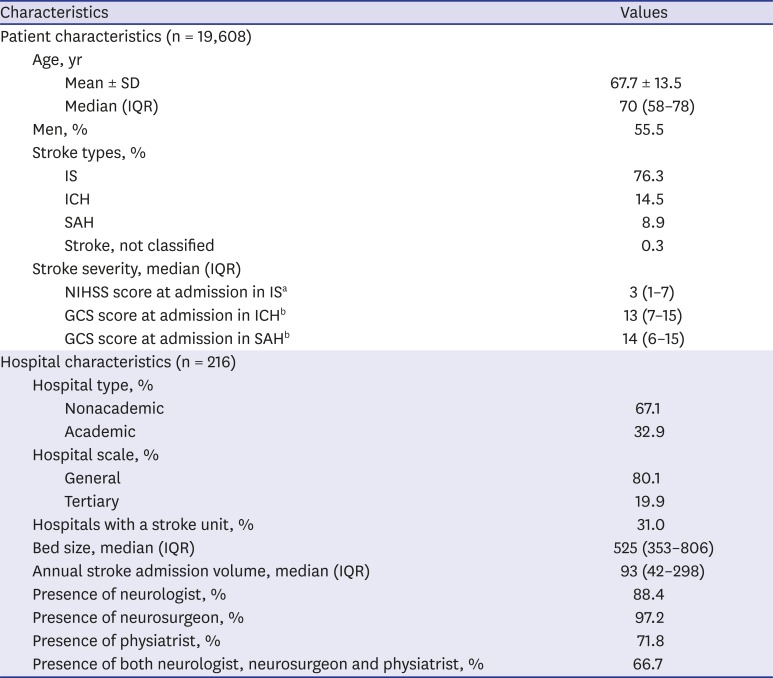
Table 1
Baseline characteristics
SD = standard deviation, IQR = interquartile range, IS = ischemic stroke, ICH = intracerebral hemorrhage, SAH = subarachnoid hemorrhage, NIHSS = National Institute of Health Stroke Scale, GCS = Glasgow Coma Scale.
aNIHSS was calculated excluding missing cases among IS (1,390; 9.3%); bGCS was calculated excluding missing cases among ICH (794; 28.0%) and SAH (376; 21.5%).
![]()
Among 216 acute care hospitals, less than a third (31%, n = 67) provided stroke unit care (Table 1). The distribution of annual stroke case volume per hospital was severely right-skewed (Supplementary Fig. 2).
National averages of acute stroke management
The median time from symptom onset to emergency room arrival at an acute care hospital was 4.5 hours (IQR, 1.4–20.0), and 55.9% of acute stroke patients used an ambulance service (Table 2). Nearly a quarter of stroke patients were referred from other hospitals to acute care hospitals. Thirty-six percent of IS patients received stroke unit care, and most ICH and SAH patients were treated in ICU. Eleven percent of IS patients received IVT, and 4% underwent EVT. Only one percent were treated with both IVT and EVT.
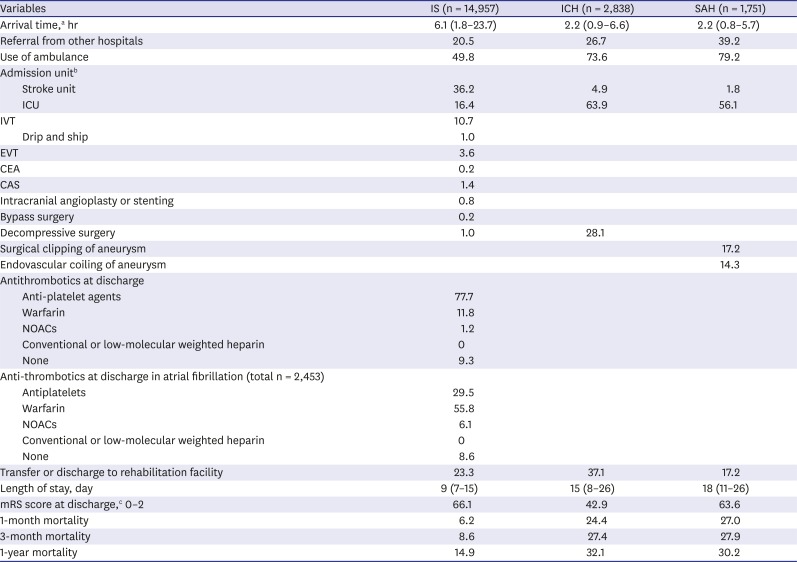
Table 2
Hospital management and outcome
Data are presented as median (interquartile range) or percentage.
IS = ischemic stroke, ICH = intracerebral hemorrhage, SAH = subarachnoid hemorrhage, ICU = intensive care unit, IVT = intravenous thrombolysis, EVT = endovascular treatment, CEA = carotid endarterectomy, CAS = carotid artery angioplasty or stenting, NOACs = non-vitamin K antagonist oral anticoagulants, mRS = modified Rankin Scale.
aArrival time was calculated as the interval from first-found abnormal time (FAT) to arrival time; bAdmission unit was calculated excluding missing cases. The number of missing cases in each stroke type is as below; ischemic stroke, 91 (0.6%); intracerebral hemorrhage, 20 (0.7%); subarachnoid hemorrhage, 9 (0.5%); cmRS score was calculated excluding missing cases. The number of missing cases in each stroke type is as below; ischemic stroke, 3,745 (25.0%); intracerebral hemorrhage, 1,379 (48.6%); subarachnoid hemorrhage, 693 (39.6%).
![]()
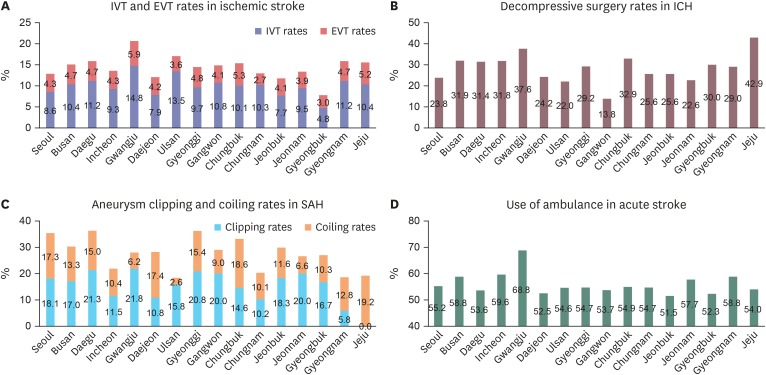
Carotid artery angioplasty or stenting (CAS) was performed 7 fold more frequently than carotid endarterectomy (CEA) for IS; the rate of decompressive surgery for ICH was 28% in general and rose to 50% in those with severe deficits (GCS scores at admission ≤ 8) (Supplementary Table 2); surgical clipping was slightly more frequent than endovascular coiling for SAH (Table 2).
Slightly more than three-quarters of IS patients were prescribed anti-platelet agents at discharge, and 9.3% did not receive an antithrombotic drug (Table 2 and Supplementary Table 3). Approximately 16% of IS patients were diagnosed as having atrial fibrillation, and 62% of those were receiving anti-coagulants at discharge (Table 2 and Supplementary Table 4). Warfarin was prescribed 10 fold more than non-vitamin K antagonist oral anticoagulants in 2013 and 2014.
Outcome
Two-thirds of IS, half of ICH, and two-thirds of SAH patients showed functional independence at discharge (mRS score ≤ 2) (Table 2). Overall, one month, three months, and one-year mortality rates were 10.8%, 13.1%, and 18.8%. Mortality gradually increased over one-year following IS, but most deaths occurred in the first month following ICH or SAH (Table 2).
Hospital disparity
Two-thirds of stroke patients were treated at high-volume hospitals (> 300 per year), which accounts for a quarter of all acute care hospitals in Korea (Supplementary Fig. 3). Notably, a considerable proportion of high-volume-hospitals did not provide stroke unit care (34% of hospitals with > 300 stroke cases per year; 28% of those with > 24 IVT cases per year, and 21% of those with > 14 EVT cases per year).
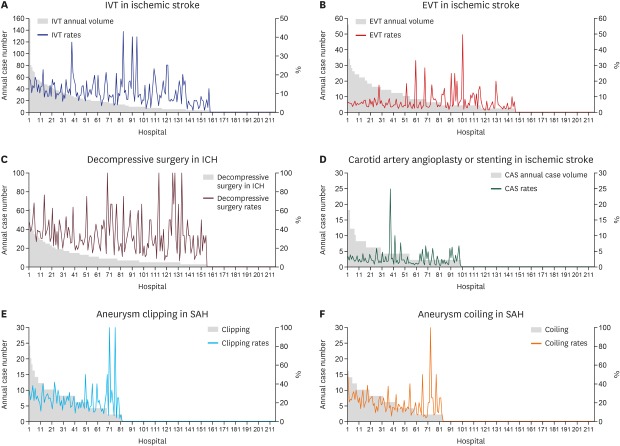
Approximately three-quarters of acute care hospitals provided reperfusion therapy, including IVT and EVT (Fig. 1). However, among hospitals giving IVT, 47% had less than one case per month, and among hospitals giving EVT, 67% had less than one case per month (Supplementary Fig. 4). Above one-thirds (38.8%) and a half (51.9%) of IS patients were treated with IVT and EVT, respectively, in low-volume-hospitals (≤ 24 cases per year for IVT, ≤ 14 cases per year for EVT) (Fig. 1 and Supplementary Fig. 3).
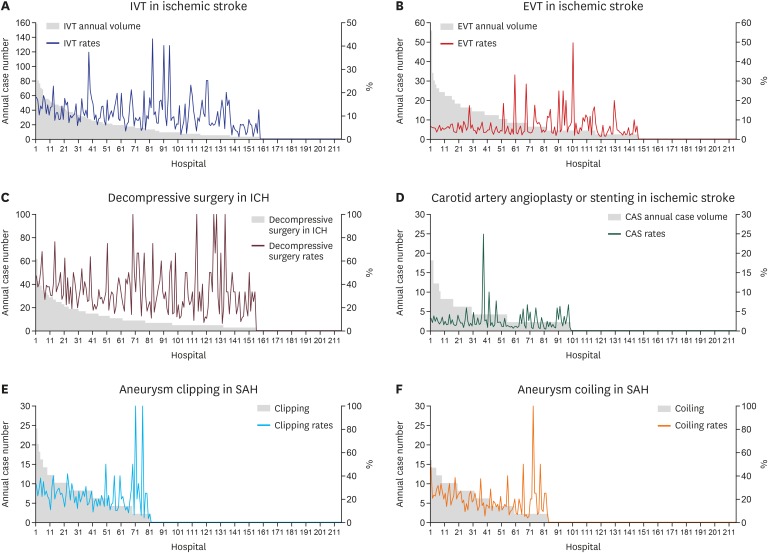
Fig. 1 shows that IVT and EVT for IS and decompressive surgery for ICH were dispersed among low-volume-hospitals, whereas aneurysm clipping and coiling were relatively more concentrated in high-volume hospitals. Nonetheless, 32%, 94%, 84%, and 93% of hospitals performing decompressive surgery, carotid artery stenting or angioplasty, aneurysm clipping, and coiling had less than one case per month, respectively.
Regional disparity
There were disparities in IVT and EVT rates among regions; the maximal difference was more than three fold for IVT and more than twice for EVT (Fig. 2 and Supplementary Table 5). The proportions of being treated in high-volume centers showed a similar pattern; not correlated with the IVT rate (P = 0.52) but with the EVT rate (P = 0.02; Pearson's correlation coefficient, −0.66). On a regional basis, the ambulance use rate was not correlated with the IVT rate (P = 0.051) and the EVT rate (P = 0.08) by the Pearson's correlation analyses. The patterns of regional disparities in clipping or coiling rates were very different from those for others. There were also considerable disparities in arrival time, ranging from 2.7 hours (Chungbuk) to 6.3 hours (Daejeon), as well as in stroke units.
Acute care hospitals were concentrated around big cities, and rural areas were relatively under-covered (Fig. 3). Disparities in the proportions of hospitals providing stroke unit care among regions were as shown, ranging from approximately 10% (Jeonbuk) to 59% (Seoul). Furthermore, in several areas distant from big cities, a small number of patients were scattered in several low-volume-hospitals.
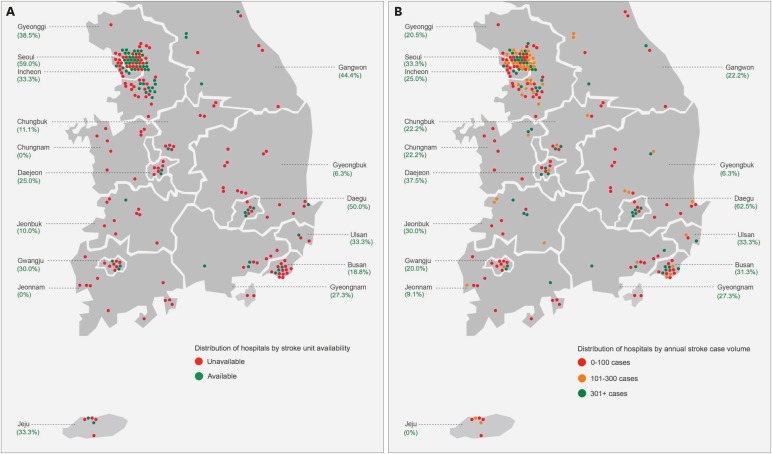
Fig. 3
Regional distribution of acute care hospitals by each subgroup. (A) Stroke unit availability and (B) stroke patient volumes. Large cities and surrounding rural areas are combined when connected through stroke practices, such as Daejeon and Chungnam, Gwangju and Jeonnam, and Daegu and Gyeongbuk (e.g., in the Jeonnam region, there is no hospital providing stroke unit care and most acute stroke patients are admitted to hospitals in the Gwangju region).
![]()
DISCUSSION
The proportion of IS compared to ICH and SAH in Korea was slightly lower than that of high-income countries,14 but higher than China,15 and similar to Japan.16 International comparisons for acute stroke care showed that IVT rates were more active in Korea than in other several countries (10.7% in Korea, 7.0% in the United States [US]7 and Australia,3 16.8% in Austria,217 and 14.9% in Germany17) but EVT rate was similar to those of other countries (3.6% in Korea, 3.3% in the US,18 4.7% in Germany,17 and 3.6% in Sweden19) (Supplementary Table 6). For treatment of carotid artery stenosis, CAS was preferred over CEA, which is opposite to the US trend (CAS vs. CEA; 1.4% vs. 0.2% in Korea; 0.1% vs. 2.0% in the US).72021 For the treatment of a ruptured cerebral aneurysm, coiling was preferred in Korea compared to the US (coiling vs. clipping; 14.3% vs. 17.2% in Korea; 2.6% vs. 31.4% in US).22 The proportion of being treated with coiling or clipping among SAH population in our study (31.5% in 2013–2014) was lower than that from the national cohort data of the United Kingdom (68.5% in 2001–2002),23 but similar to that from the claims data of the US (34.0% in 2000–2001).22 The explanation for relatively lower rate and regional disparities of coiling and clipping for SAH should be explored in future research. Decompressive surgery rates for ICH were higher in Korea than in European countries and Japan (28.1% in Korea, 0.9%–23.2% in Europe,6 and 22.1% in Japan24).
In 2013 and 2014, only 31% of acute care hospitals provided stroke unit care, which corresponds to the finding of 1.3 stroke unit beds per million inhabitants. This figure was much lower than in Europe (2.9 stroke unit beds per million inhabitants25) and in the US (4.0 stroke unit beds per million inhabitants26), which may underlie the finding that the percentage of patients receiving stroke unit care among hospitalized stroke patients was notably lower in Korea than in other Organisation for Economic Co-operation and Development countries2 (29% in Korea, 83% in UK27, and 77% in Germany28) (Supplementary Table 6). The Korean Stroke Society proposed the admission indication, composition, and operation of stroke units in 2007, and began the certification program in 2012. However, coverage of stroke units by the NHI Service began in late 2017, and the reimbursement price was insufficient for required resources to provide stroke unit care. Consequently, these factors hamper the nationwide expansion of stroke units.
Approximately only half of patients receiving EVT were treated in high-volume hospitals (≥ 15 cases per year) (Supplementary Fig. 3). In Germany, 97% of EVT cases are performed in high-volume-hospitals, and 55% are in hospitals with ≥ 100 cases per year.29 The relationship between case volume and outcome is well known; the more patients that are treated, the faster the treatment and the lower the mortality.303132 For the centralization of recanalization therapy, it is crucial for emergency medical services (EMS) to detect and deliver hyperacute stroke patients to appropriate hospitals that are highly experienced and can perform reperfusion therapy as soon as possible.
According to the map of the regional distribution of hospitals regarding stroke units and stroke patient volumes, it is evident that many areas are not equipped for acute stroke care (Fig. 3). Moreover, some rural areas have several low-volume-hospitals, which may be worse than having one high-volume-hospital. This phenomenon could be explained by the absence of a national accreditation system for acute stroke care hospitals and the lack of connection between EMS and acute stroke care hospitals on a regional level. Inadequate centralization might also contribute to the regional disparities in IVT rates, which show differences of up to three fold (Fig. 2). The urgent development of a national accreditation system for primary and comprehensive stroke centers and the establishment of appropriate connections between EMS and stroke centers to minimize uncovered areas for acute stroke care is imperative and will maximize the opportunity for reperfusion therapy.
Like reperfusion therapy, there is a lack of centralization of other interventions in Korea (Fig. 1). In the US, more than 60% of the interventions performed to treat ruptured aneurysms were performed at high-volume hospitals (> 20 patients/year),33 but only 7% of clipping and none of the coiling was performed at high-volume hospitals. A recent meta-analysis showed that the mortality rate was lower in high-volume hospitals for either clipping or coiling in SAH, although there was no consensus on a cutoff value for case volume.34 There are no reports regarding centralization issues in decompressive surgery for ICH.
There are several limitations to this study. First, hospitals treating less than 10 cases during each assessment period were not included in this study. There are 347 general and tertiary hospitals in Korea, therefore, 37.8% of them were excluded from this study. Second, each assessment was conducted over 3 months; therefore, seasonal variation in stroke incidence and characteristics may have affected several findings of this study, such as annual stroke volumes, stroke types, and outcomes. Third, frequencies of interventions might be poorly estimated because we defined most of these interventions through the claims data. Finally, detailed clinical information, including risk factors, clinical history, and stroke characteristics was lacking.
In conclusion, acute stroke care in Korea seems to have quite acceptable quality, but there are regional and hospital disparities which could be the opportunities for improvement. Expansion of stroke units, stroke center certification or accreditation, and stronger connections between stroke centers and EMS are urgently needed. Efforts to grasp and comprehend the contemporary status of acute stroke care at a national level should be continued.
 XML Download