This article has been
cited by other articles in ScienceCentral.
Abstract
Background
The pathophysiological mechanisms underlying the post-acute sequelae of severe acute respiratory syndrome coronavirus 2 infection (PASC) are not well understood. Our study aimed to investigate various aspects of theses mechanisms, including viral persistence, immunological responses, and laboratory parameters in patients with and without PASC.
Methods
We prospectively enrolled adults aged ≥ 18 years diagnosed with coronavirus disease 2019 (COVID-19) between August 2022 and July 2023. Blood samples were collected at three time-points: within one month of diagnosis (acute phase) and at 1 month, and 3 months post-diagnosis. Following a recent well-designed definition of PASC, PASC patients were defined as those with a questionnaire-based PASC score ≥ 12 persisting for at least 4 weeks after the initial COVID-19 diagnosis.
Results
Of 57 eligible COVID-19 patients, 29 (51%) had PASC, and 28 (49%) did not. The PASC group had significantly higher nucleocapsid protein (NP) antigenemia 3 months after COVID-19 diagnosis (P = 0.022). Furthermore, several cytokines, including IL-2, IL-17A, VEGF, RANTES, sCD40L, IP-10, I-TAC, and granzyme A, were markedly elevated in the PASC group 1 and/or 3 month(s) after COVID-19 diagnosis. In contrast, the median values of several serological markers, including thyroid markers, autoimmune indicators, and stress-related hormones, were within the normal range.
Conclusion
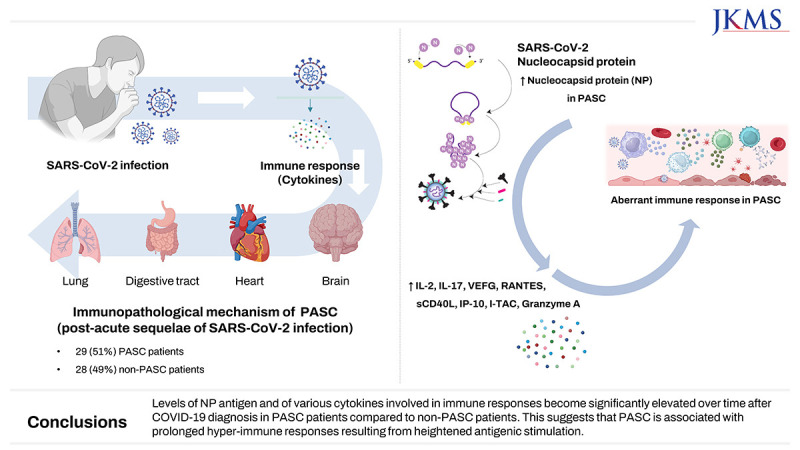
Levels of NP antigen and of various cytokines involved in immune responses become significantly elevated over time after COVID-19 diagnosis in PASC patients compared to non-PASC patients. This suggests that PASC is associated with prolonged immune dysregulation resulting from heightened antigenic stimulation.
Keywords: COVID-19, Post-Acute Sequelae of SARS-CoV-2 Infection (PASC), Long-COVID, Nucleocapsid Protein (NP), Cytokine
INTRODUCTION
Coronavirus disease 2019 (COVID-19), first reported in Wuhan, China in 2019,
1 has since evolved into a global pandemic, with diverse clinical manifestations. While many patients recover after experiencing the acute phase of infection, a subset of individuals continues to endure persistent or recurrent symptoms, giving rise to a public health challenge. These symptoms are known as post-acute sequelae of severe acute respiratory syndrome coronavirus 2 (SARS-CoV-2) infection (PASC), or “long-COVID,”
2 and the incomplete understanding of the intricacies of etiologies impede the diagnosis and appropriate treatment of affected individuals.
Previous studies
3456 have examined the immunological mechanisms underlying PASC. According to these studies, the prolonged presence of circulating SARS-CoV-2-specific antigens, such as the spike (S) protein and/or nucleocapsid protein (NP), is detected mainly in PASC patients.
34 Certain cytokines, such as interleukin (IL)-1β, IL-6, interferon-γ-induced protein (IP)-10, macrophage inflammatory protein-1α, and tumor necrosis factor, have also been associated with PASC.
56 However, the definition of PASC used in these earlier studies varied due to differences in symptom-based classification. A recent study
7 has introduced a systematic definition of PASC based on symptoms with severity thresholds, so providing a standardized approach in identifying and characterizing PASC. This allows for a more consistent understanding of PASC, based on acknowledging that its manifestations can vary in intensity and duration.
In this study we explored the pathophysiological mechanisms of PASC, focusing specifically on viral persistence and immune responses, and employing the newly-established systematic classification of PASC to provide a more comprehensive and consistent framework for the investigation.
METHODS
Study population
The study was conducted at the Asan Medical Center, a large 2700-bed tertiary care teaching hospital in Seoul, South Korea. Adults aged ≥ 18 with confirmed positive polymerase-chain reaction or rapid antigen tests for SAR-CoV-2 between August 2022 and July 2023 were enrolled. Blood samples were collected at three time-points: within one month of diagnosis (referred to as the acute phase), and 1 and 3 month(s) post-diagnosis. Patients with PASC were defined by a questionnaire-based score of 12 or more persisting for at least 4 weeks after the initial COVID-19 diagnosis, using a scoring system established in a recent study.
7
Measurement of nucleocapsid protein (NP) antigen and NP antibodies
SARS-CoV-2 NP in COVID-19 patients was detected using enzyme-linked immunosorbent assay (ELISA) kits (RayBio® COVID-19/SARS-CoV-2 Nucleocapsid Protein ELISA Kit, RayBiotech, Inc., Norcross, GA, USA) according to the manufacturer’s instructions. Also, serum NP antigen-specific immunoglobulin (Ig)-M was measured by an anti-N SARS-CoV-2 IgM ELISA (Anti-SARS-CoV-2 N Protein Human IgM ELISA Kit (antigen coated), Proteintech, Rosemont, IL, USA), and serum NP antigen-specific IgG was measured by an anti-N SARS-CoV-2 IgG ELISA (Anti-SARS-CoV-2 N Protein Human IgG ELISA Kit, Proteintech) following the manufacturer’s protocols.
Measurement of cytokines and serologic parameters
We analyzed levels of 33 selected cytokines in plasma samples from the participants using a cytometric bead array (BD Biosciences, San Jose, CA, USA), as described in our previous study.
8 Serological analyses were performed using the assays developed in the Department of Laboratory Medicine at Asan Medical Center. Detailed cytokine profiles and serologic parameter are shown in
Supplementary Data 1.
Statistical analysis
All tests of significance were two-tailed, and
P values less than 0.05 were considered statistically significant. Categorical variables were evaluated using Fisher’s exact test or the χ
2 test as appropriate, and continuous variables were compared using the Mann-Whitney
U test or Student’s
t-test, as appropriate. Receiver operating characteristic (ROC) curve was plotted for NP antigen level in the acute phase to assess the sensitivity, specificity, positive predictive value (PPV), and negative predictive value (NPV) for predicting PASC. We determined the optimal cut-off value for NP antigen level in the acute phase by calculation of the Youden index.
9 Statistical calculations were performed using SPSS for Windows software package, version 23.0 (IBM Corp., Armonk, NY, USA), and GraphPad Prism 5.01 (GraphPad Software, Inc., La Jolla, CA, USA).
Ethics statement
Our study received approval from the Institutional Review Board (IRB) of Asan Medical Center (IRB No. 2022–1477). Informed consent was submitted by all subjects when they were enrolled.
RESULTS
A total of 68 patients with COVID-19 were prospectively enrolled. However, 11 patients withdrew their consent within four weeks of the initial COVID-19 diagnosis. Consequently, 57 COVID-19 patients were included in the subsequent analysis. Of this cohort, 29 (51%) fulfilled the criteria for PASC, while 28 (49%) individuals were categorized as non-PASC patients, according to the well-defined PASC criteria.
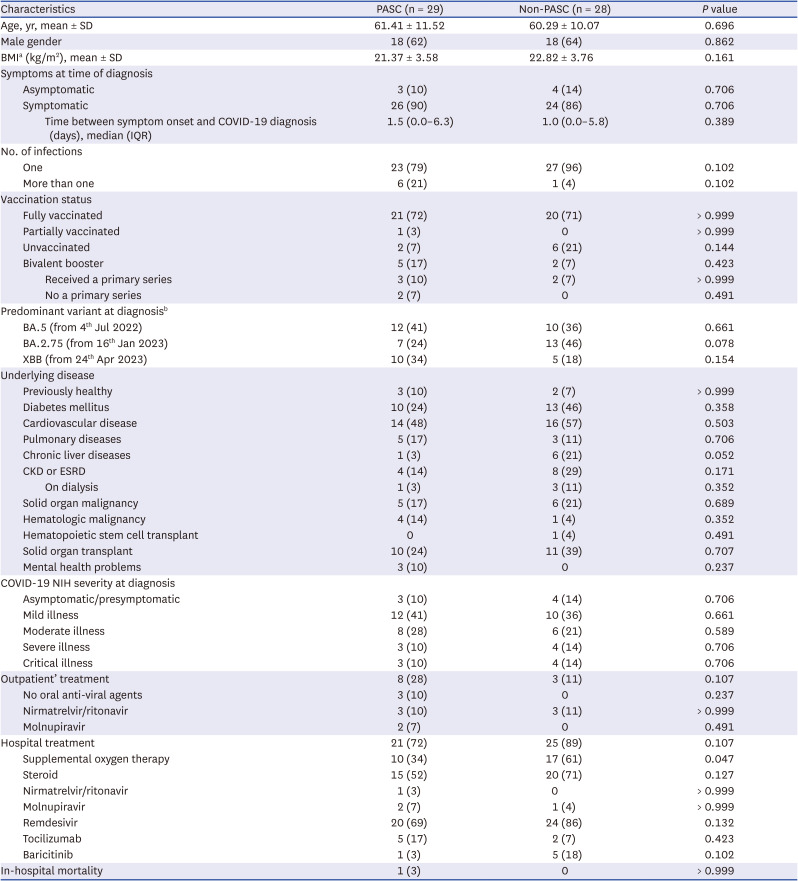
7 The means ± standard deviations of questionnaire-based PASC scores in the PASC and non-PASC patients were 14.96 ± 6.39 and 5.13 ± 3.98 at 1 month after COVID-19 diagnosis, and 11.65 ± 7.19 and 4.78 ± 4.26 at 3 months after COVID-19 diagnosis, respectively. Demographic characteristics, such as age, gender, underlying medical conditions, COVID-19 vaccination history, and disease severity at the time of diagnosis, were not significantly different between the groups (
Table 1).
Table 1
Baseline characteristics of the participants

|
Characteristics |
PASC (n = 29) |
Non-PASC (n = 28) |
P value |
|
Age, yr, mean ± SD |
61.41 ± 11.52 |
60.29 ± 10.07 |
0.696 |
|
Male gender |
18 (62) |
18 (64) |
0.862 |
|
BMIa (kg/m2), mean ± SD |
21.37 ± 3.58 |
22.82 ± 3.76 |
0.161 |
|
Symptoms at time of diagnosis |
|
|
|
|
Asymptomatic |
3 (10) |
4 (14) |
0.706 |
|
Symptomatic |
26 (90) |
24 (86) |
0.706 |
|
|
Time between symptom onset and COVID-19 diagnosis (days), median (IQR) |
1.5 (0.0–6.3) |
1.0 (0.0–5.8) |
0.389 |
|
No. of infections |
|
|
|
|
One |
23 (79) |
27 (96) |
0.102 |
|
More than one |
6 (21) |
1 (4) |
0.102 |
|
Vaccination status |
|
|
|
|
Fully vaccinated |
21 (72) |
20 (71) |
> 0.999 |
|
Partially vaccinated |
1 (3) |
0 |
> 0.999 |
|
Unvaccinated |
2 (7) |
6 (21) |
0.144 |
|
Bivalent booster |
5 (17) |
2 (7) |
0.423 |
|
|
Received a primary series |
3 (10) |
2 (7) |
> 0.999 |
|
|
No a primary series |
2 (7) |
0 |
0.491 |
|
Predominant variant at diagnosisb
|
|
|
|
|
BA.5 (from 4th Jul 2022) |
12 (41) |
10 (36) |
0.661 |
|
BA.2.75 (from 16th Jan 2023) |
7 (24) |
13 (46) |
0.078 |
|
XBB (from 24th Apr 2023) |
10 (34) |
5 (18) |
0.154 |
|
Underlying disease |
|
|
|
|
Previously healthy |
3 (10) |
2 (7) |
> 0.999 |
|
Diabetes mellitus |
10 (24) |
13 (46) |
0.358 |
|
Cardiovascular disease |
14 (48) |
16 (57) |
0.503 |
|
Pulmonary diseases |
5 (17) |
3 (11) |
0.706 |
|
Chronic liver diseases |
1 (3) |
6 (21) |
0.052 |
|
CKD or ESRD |
4 (14) |
8 (29) |
0.171 |
|
|
On dialysis |
1 (3) |
3 (11) |
0.352 |
|
Solid organ malignancy |
5 (17) |
6 (21) |
0.689 |
|
Hematologic malignancy |
4 (14) |
1 (4) |
0.352 |
|
Hematopoietic stem cell transplant |
0 |
1 (4) |
0.491 |
|
Solid organ transplant |
10 (24) |
11 (39) |
0.707 |
|
Mental health problems |
3 (10) |
0 |
0.237 |
|
COVID-19 NIH severity at diagnosis |
|
|
|
|
Asymptomatic/presymptomatic |
3 (10) |
4 (14) |
0.706 |
|
Mild illness |
12 (41) |
10 (36) |
0.661 |
|
Moderate illness |
8 (28) |
6 (21) |
0.589 |
|
Severe illness |
3 (10) |
4 (14) |
0.706 |
|
Critical illness |
3 (10) |
4 (14) |
0.706 |
|
Outpatient’ treatment |
8 (28) |
3 (11) |
0.107 |
|
No oral anti-viral agents |
3 (10) |
0 |
0.237 |
|
Nirmatrelvir/ritonavir |
3 (10) |
3 (11) |
> 0.999 |
|
Molnupiravir |
2 (7) |
0 |
0.491 |
|
Hospital treatment |
21 (72) |
25 (89) |
0.107 |
|
Supplemental oxygen therapy |
10 (34) |
17 (61) |
0.047 |
|
Steroid |
15 (52) |
20 (71) |
0.127 |
|
Nirmatrelvir/ritonavir |
1 (3) |
0 |
> 0.999 |
|
Molnupiravir |
2 (7) |
1 (4) |
> 0.999 |
|
Remdesivir |
20 (69) |
24 (86) |
0.132 |
|
Tocilizumab |
5 (17) |
2 (7) |
0.423 |
|
Baricitinib |
1 (3) |
5 (18) |
0.102 |
|
In-hospital mortality |
1 (3) |
0 |
> 0.999 |

Regarding the NP antigen and antibody responses, NP antigenemia was significantly higher in the non-PASC patients (median, 12.42 ng/mL; interquartile range [IQR], 2.93–21.91) than in the PASC patients (median, 1.58 ng/mL; IQR, 0.62–5.76) in the acute phase (
P = 0.045). On the other hand, the NP antigen level 3 months after COVID-19 diagnosis was much higher in the PASC patients (median, 5.49 ng/mL; IQR, 0.75–10.27 vs. median, 0.59 ng/mL; IQR, 0.00–4.32;
P = 0.022). The ROC curve was plotted for NP antigen level in the acute phase for predicting PASC. The area under the curve was 0.687 (
P = 0.044). According to the ROC curve we obtained (
Supplementary Fig. 1), we calculated the optimal cut-off value of 1.575 ng/mL (sensitivity 81.8%, specificity 50.0%, PPV 63.0%, and NPV 72.5%) for NP antigen level in the acute phase. However, there were no significant differences in NP IgM and IgG levels between the two groups (
Fig. 1,
Supplementary Table 1).
Fig. 1
NP antigen, anti-NP IgM, and anti-NP IgG levels in the PASC and non-PASC groups. The boxes represent interquartile ranges (interquartile range), and the whiskers represent the distances from the lowest value to the first quartile and from the third quartile to the highest value, respectively.
NP = nucleocapsid protein, COVID-19 = coronavirus disease 2019, Ig = immunoglobulin, PASC = post-acute sequalae of SARS-CoV-2 infection.
*P < 0.05, **P < 0.01, ***P < 0.001.


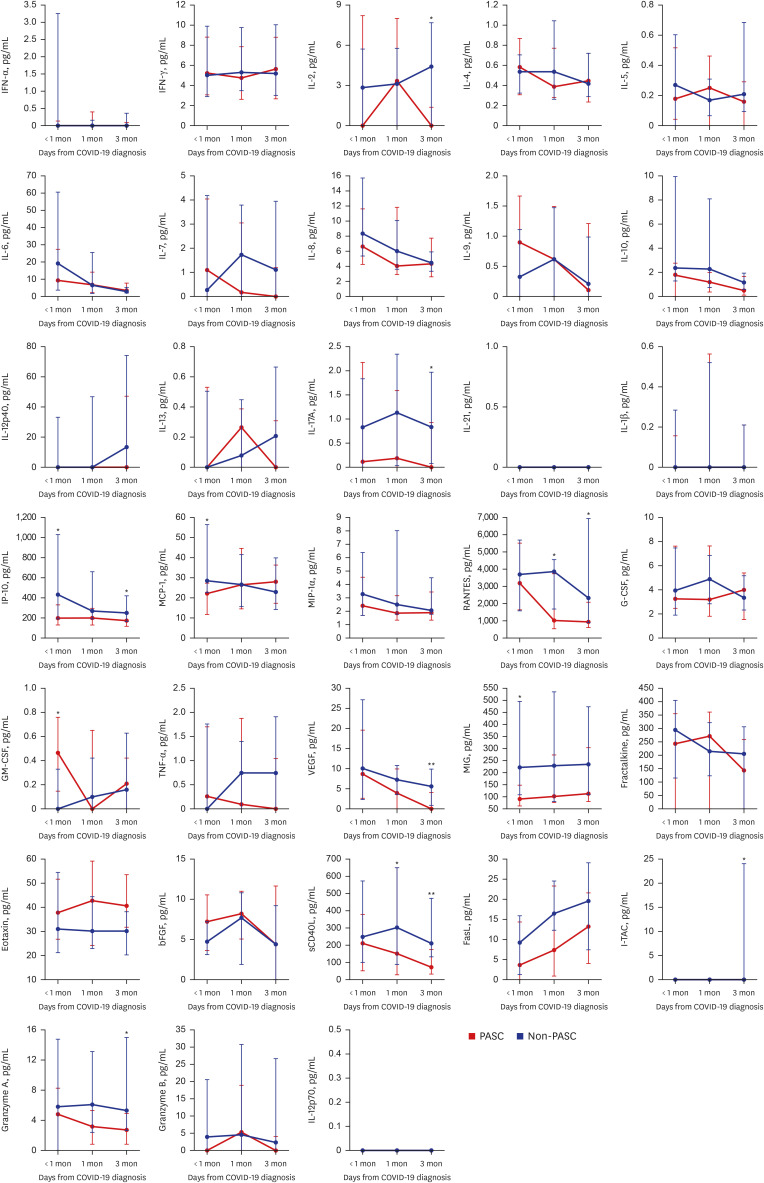
Of 33 selected cytokines whose levels were measured, IL-2, IL-17A, vascular endothelial growth factor (VEGF), regulated on activation and normally T-cell expressed and secreted (RANTES), soluble cluster of differentiation 40 ligand (sCD40L), IP-10, interferon-inducible T cell alpha chemoattractant (I-TAC), and granzyme A were significantly elevated in the PASC group at 1 and/or 3 month(s) after COVID-19 diagnosis (
Fig. 2,
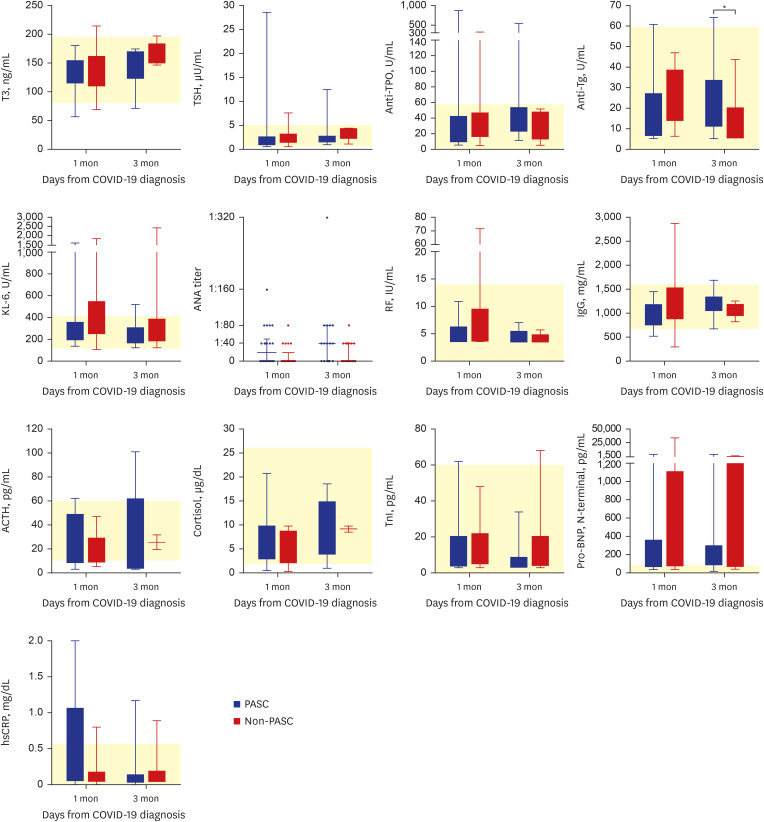
Supplementary Table 2). In contrast, levels of most serologic markers, including those related to thyroid function, autoimmune indicators, and stress-related hormones, did not differ significantly between the two groups, an exception being elevated anti-thyroglobulin (Tg) antibody at 3 months after COVID-19 diagnosis; however, the median values of anti-Tg antibody in both groups were within the normal range (
Fig. 3,
Supplementary Table 3).
Fig. 2
Levels of several cytokines in the PASC and non-PASC groups. The data denoted as medians with interquartile ranges.
IFN = interferon, COVID-19 = coronavirus disease 2019, IL = interleukin, IP-10 = IFN-γ induced protein 10, MCP-1 = monocyte chemotactic protein 1, MIP-1α = macrophage inflammatory protein 1α, RANTES = regulated on activation and normally T-cell expressed and secreted, G-CSF = granulocyte colony-stimulating factor, GM-CSF = granulocyte macrophage colony-stimulating factor, TNF = tumor necrosis factor, VEGF = vascular endothelial growth factor, MIG = monokine induced by IFN-γ, bFGF = basic fibroblast growth factor, sCD40L = soluble cluster of differentiation 40 ligand, FasL = fas ligand, I-TAC = interferon-inducible T cell alpha chemoattractant.
*P < 0.05, **P < 0.01, ***P < 0.001.


Fig. 3
Results of various laboratory assays in the PASC and non-PASC groups. The boxes represent interquartile ranges (IQR), and the whiskers represent the distances between from the lowest value to the first quartile and from the third quartile to the highest value, respectively. The yellow areas represent the normal range.
T3 = triiodothyronine, COVID-19 = coronavirus disease 2019, TSH = thyroid stimulating hormone, anti-TPO = anti-microsome antibody, anti-Tg = anti-thyroglobulin antibody, KL-6 = Krebs von den Lungen 6, ANA = antinuclear antibody, RF = rheumatoid factor, IgG = immunoglobulin G, ACTH = adrenocorticotropic hormone, TnI = troponin-I, pro-BNP = pro–B-type natriuretic peptide, hsCRP = high sensitivity C-reactive protein, PASC = post-acute sequalae of SARS-CoV-2 infection.
*P < 0.05, **P < 0.01, ***P < 0.001.


DISCUSSION
Our results underlined the multifaceted nature of PASC. We showed that the NP antigenemia was persistently higher in PASC group at the post-acute period (3 months) than in non-PASC group, although the NP antigenemia was lower in PASC group at the acute period than in non-PASC group. This strongly suggests that PASC is linked to heightened immune responses, which likely arise from persistent antigenic stimulation. It is noteworthy that we used a well-defined and systematic classification of PASC symptoms, thus contributing to the establishment of a standardized framework for comprehending this complex condition.
The previous study
10 revealed that NP antigenemia was associated with disease severity in patients with acute phase of SARS-CoV-2 infection. In our study, non-PASC group received more supplemental oxygen therapy (61%) than PASC group did (34%,
P = 0.047), so we assume that the low level of NP antigenemia in PASC group might reflect this trend. In contrast, PASC group had a trend to receive remdesivir less frequently (69%) than non-PASC group (85%,
P = 0.132). A recent meta-analysis
11 reported that the use of antiviral agents reduces the incidence of PASC. So, this might partially explain the persistent NP antigenemia in PASC group in the post-acute phase, leading to immune dysfunction. It is worth to note that a unique double membrane vesicle (DMV) is induced in cells infected with SARS-CoV-2.
12 These viral DMVs can shield against cellular defenses,
13 so viral replication remnants in these structures might serve as a source or reservoir of the persistent release of NP antigenemia in PASC group.
Previous investigations
3456 have proposed a potential mechanism based on such reservoirs that may contribute to the development of PASC; this involves activation of immune responses by SARS-CoV-2 reservoirs leading to cytokine production and the initiation of inflammatory reactions. These immune responses may result in altered differentiation of T cells and B cells. Kreye et al.
14 have invoked the concept of molecular mimicry, according to which antibodies produced in response to SARS-CoV-2 might cross-react with host proteins. Despite the extensive efforts to understand the pathophysiology of PASC, the results obtained have been inconsistent, perhaps because of disparities between study populations, study designs or definitions of PASC. Our study has the advantage that it categorized patients as PASC or non-PASC based on a systematic definition of PASC. The persistence of enhanced NP antigen levels with their potential to drive PASC due to induction of aberrant cytokine production and subsequent inflammation, constitutes a noteworthy discovery. Although further studies are needed to investigate the potential role of other factors including cytokines, the absence of significant differences in serological markers related to thyroid function, autoimmune indicators, and stress-related hormones between PASC and non-PASC groups suggests that immune responses play a predominant role in PASC.
The cytokine analysis in our study shows that in patients with PASC, inflammatory cytokines such as IL-2, IL-17A, I-TAC, IP-10, RANTES, Granzyme A, VEGF, and sCD40L remain persistently elevated even more than one month after COVID-19 diagnosis. These cytokines are thought to mediate immune cell recruitment (mainly T cells and monocytes), platelet activation/degranulation, cytotoxicity, and angiogenesis, contributing to PASC symptoms. To identify the types and roles of immune cells involved in these immune responses, we are currently conducting single cell sequencing and bulk RNA sequencing analyses between PASC and non-PASC groups, followed by immunophenotyping experiments through flow cytometry analysis to identify the key immune player cells for the pathophysiology of PASC. Furthermore, we are also conducting proteomics research using the O-link platform, which allows for an unbiased approach to analyzing over 3,000 blood proteomes. This method provides information on whether there are differences in protein patterns among individuals and the extent of these differences to elucidate some diagnostic markers or therapeutic targets for PASC. These kinds of multi-omic profiling of PASC patient are warranted.
This study has some limitations. First, the sample size was relatively modest, which may affect the generalizability of the findings. However, we believe that our ongoing large-scale research will reduce this concern. Second, the study focused on a narrow timeframe (up to 3 months post-COVID-19 diagnosis), so that the long-term dynamics of PASC remain unexplored. Nonetheless we consider the period of 1 to 3 months after COVID-19 diagnosis as crucial for understanding PASC. We are currently continuing to monitor the enrolled participants, and preliminary observations suggest that PASC symptoms tend to decline after approximately one year from COVID-19 diagnosis.
In conclusion, the persistent elevation of NP antigen and specific cytokines in PASC patients suggests a connection with PASC symptomology. Understanding the immunopathological mechanisms underlying PASC promises to be a key step in addressing the complexities of long-term COVID-19-related symptoms and their treatment.
ACKNOWLEDGMENTS
We are grateful to Dr. Joon Seo Lim for assistance with English editing.
References
1. Guan WJ, Ni ZY, Hu Y, Liang WH, Ou CQ, He JX, et al. Clinical characteristics of coronavirus disease 2019 in China. N Engl J Med. 2020; 382(18):1708–1720. PMID:
32109013.
2. Sneller MC, Liang CJ, Marques AR, Chung JY, Shanbhag SM, Fontana JR, et al. A longitudinal study of COVID-19 sequelae and immunity: baseline findings. Ann Intern Med. 2022; 175(7):969–979. PMID:
35605238.
3. Swank Z, Senussi Y, Manickas-Hill Z, Yu XG, Li JZ, Alter G, et al. Persistent circulating severe acute respiratory syndrome coronavirus 2 spike is associated with post-acute coronavirus disease 2019 sequelae. Clin Infect Dis. 2023; 76(3):e487–e490. PMID:
36052466.
4. Peluso MJ, Deeks SG, Mustapic M, Kapogiannis D, Henrich TJ, Lu S, et al. SARS-CoV-2 and mitochondrial proteins in neural-derived exosomes of COVID-19. Ann Neurol. 2022; 91(6):772–781. PMID:
35285072.
5. Schultheiß C, Willscher E, Paschold L, Gottschick C, Klee B, Henkes SS, et al. The IL-1β, IL-6, and TNF cytokine triad is associated with post-acute sequelae of COVID-19. Cell Rep Med. 2022; 3(6):100663. PMID:
35732153.
6. Torres-Ruiz J, Lomelín-Gascón J, Lira Luna J, Vargas-Castro AS, Pérez-Fragoso A, Nuñez-Aguirre M, et al. Novel clinical and immunological features associated with persistent post-acute sequelae of COVID-19 after six months of follow-up: a pilot study. Infect Dis (Lond). 2023; 55(4):243–254. PMID:
36637466.
7. Thaweethai T, Jolley SE, Karlson EW, Levitan EB, Levy B, McComsey GA, et al. Development of a definition of postacute sequelae of SARS-CoV-2 infection. JAMA. 2023; 329(22):1934–1946. PMID:
37278994.
8. Kwon JS, Kim JY, Kim MC, Park SY, Kim BN, Bae S, et al. Factors of severity in patients with COVID-19: cytokine/chemokine concentrations, viral load, and antibody responses. Am J Trop Med Hyg. 2020; 103(6):2412–2418. PMID:
33124544.
9. Fluss R, Faraggi D, Reiser B. Estimation of the Youden Index and its associated cutoff point. Biom J. 2005; 47(4):458–472. PMID:
16161804.
10. Verkerke HP, Damhorst GL, Graciaa DS, McLendon K, O’Sick W, Robichaux C, et al. Nucleocapsid antigenemia is a marker of acute SARS-CoV-2 infection. J Infect Dis. 2022; 226(9):1577–1587. PMID:
35877413.
11. Choi YJ, Seo YB, Seo JW, Lee J, Nham E, Seong H, et al. Effectiveness of antiviral therapy on long COVID: a systematic review and meta-analysis. J Clin Med. 2023; 12(23):7375. PMID:
38068427.
12. Wolff G, Melia CE, Snijder EJ, Bárcena M. Double-membrane vesicles as platforms for viral replication. Trends Microbiol. 2020; 28(12):1022–1033. PMID:
32536523.
13. V’kovski P, Kratzel A, Steiner S, Stalder H, Thiel V. Coronavirus biology and replication: implications for SARS-CoV-2. Nat Rev Microbiol. 2021; 19(3):155–170. PMID:
33116300.
14. Kreye J, Reincke SM, Prüss H. Do cross-reactive antibodies cause neuropathology in COVID-19? Nat Rev Immunol. 2020; 20(11):645–646. PMID:
33024283.
SUPPLEMENTARY MATERIALS
Supplementary Table 1
Levels of NP antigen, anti-NP IgM, and anti-NP IgG in the PASC and non-PASC groups
jkms-39-e237-s002.doc
Supplementary Fig. 1
Plotted receiver operating characteristics curve for NP antigen level in the acute phase. The area under the curve was 0.687 (P = 0.044).
jkms-39-e237-s005.doc


 PDF
PDF Citation
 Print
Print


 XML Download