

 PDF
PDF Citation
 Print
Print


INTRODUCTION
Dysmenorrhea, defined as pain associated with menstruation, is one of the most common gynecological disorders in young women.1 This pain may be accompanied by other symptoms such as diarrhea, nausea, vomiting, dizziness, and back pain.1 Dysmenorrhea affects classroom or work performance, attendance at school or work, concentration, and other activities in young women23 and has a negative effect on the quality of life.4 While the prevalence of dysmenorrhea has varied from 16.8% to 81.0%, depending on the participants’ ethnicity or country, its overall prevalence was reported to be approximately 71.1%.2 Many epidemiological studies have reported that menstruation-related factors such as age at menarche, irregular menstrual cycle, duration of menstrual flow, and maternal history of dysmenorrhea are associated with dysmenorrhea.567 In addition, lifestyle factors, such as cigarette smoking, habitual posture, and sleep, are known to be associated with the risk of dysmenorrhea.589
In women, excessive weight changes, regardless of whether they are losses or gains, are associated with impaired health10 or risk of mortality.11 Nevertheless, many women try to lose weight. Even among Korean adolescent girls, 8.9% have reported that they have followed a diet for weight control.5 Recently, with the increasing frequency of exposure to smartphones and media, including television programs, movies, and social network services, the public perception of “a lean and slim body” and the distorted tendency to admire or envy it are increasing.12 Therefore, many people have misperceptions or are dissatisfied with their body image, and this is more pronounced in women than in men.13 Moreover, the proportion of women who misperceive their body image or try to control their weight is higher in Asian countries than in Western countries.14 Korean women, in particular, overestimate their weight more than other Asian women.15 Misperceptions or dissatisfaction with body image is related to unhealthy weight control behavior.16 A previous study showed that weight misperception was associated with weight control behaviors such as fasting or the use of diet pills in women.17 Although excessive weight changes or weight control behaviors have a variety of adverse health effects, few studies have investigated their association with gynecological health.
Therefore, this study aimed to evaluate the prevalence of dysmenorrhea and investigate the effect of weight changes or unhealthy weight control behaviors over the past year on dysmenorrhea, a gynecological condition, in young Korean women.
METHODS
Study design and participants
This study was conducted on young women of adolescence (14–18 years) and childbearing age (19–44 years), who participated in the Korean Study of Women’s Health-Related Issues (K-stori). The survey, a nationwide cross-sectional study, was conducted between April 2016 and June 2016 to assess the broad categories of health statuses in Korean women according to the five stages of the life cycle of women (adolescence, childbearing age, pregnancy and post-partum, menopause, and older adults).18 The survey recruited 15,000 participants (3,000 participants per stage) using a multistage stratified random sampling method. After obtaining informed consent, all the eligible participants were surveyed by a trained interviewer, using household interviews with stage-specific questionnaires. For adolescents only, the online surveys were conducted after obtaining informed consent from the participants and their parents. The questionnaires consisted of 26 common questions and more than 100 questions appropriate for each life cycle stage. The medical history was investigated according to the Korean Standard Classification of Disease-7 (KCD-7), the Korean version of the International Classification of Diseases-10, and consisted of 22 major disease categories.19 Since dysmenorrhea-related questions were only included in the adolescence and childbearing age, this study excluded 9,000 participants from the pregnancy and post-partum, menopause, and older adult age groups.
Of the 6,000 participants from the adolescence and childbearing ages, 171 who had no menses (n = 30), did not menstruate for the past 3 months (adolescence, n = 76) or one year (childbearing age, n = 60), or incorrectly answered age at menarche (n = 5) were excluded. No one had a history of genitourinary system, including female genital disease such as endometriosis, excessive or irregular menstruation, other abnormal uterine, and others. Finally, a total of 5,829 participants were included in the analyses.
Dysmenorrhea measurement
Dysmenorrhea was self-reported by all the participants using a visual analog scale (VAS). The VAS scores ranged from 0 to 10, with higher scores indicating severe pain.20 The severity of dysmenorrhea was categorized as none (VAS score = 0), mild (1–3), moderate (4–6), or severe (7–10) considering its effects on daily life and based on previous studies.2122
Weight changes and weight control-related diet factors
Questions about weight changes and the use of weight control-related diets over the past year were addressed in the “physique and body type” and “eating habits” sections. Weight change was categorized as < 3 kg and ≥ 3 kg, because weight change < 3 kg was considered no change in previous reports.2324 Unhealthy weight control behaviors were considered based on the suggestions in the Project Eating Among Teens (EAT):25 fasting/meal skipping (yes or no), use of drugs (prescription or non-prescription, herbal) (yes or no), use of unapproved dietary supplements (yes or no), and use of one-food diets (yes or no). Binge eating disorder status (yes or no) was defined based on the Diagnostic and Statistical Manual of Mental Disorders, 5th edition (DSM-V).26 Eating out was categorized as < 5 times/week and ≥ 5 times/week.
Demographics, lifestyle, and reproductive and mental health factors
Demographic factors included age and body mass index (BMI). The BMI was categorized as underweight (< 18.5 kg/m2), normal weight (18.5–< 23.0 kg/m2), overweight (23.0–< 25.0 kg/m2) or obesity (≥ 25.0 kg/m2). Lifestyle factors included physical activity, sleep duration, and sleep quality. Physical activity was categorized as < 1 day/week, 1–2 days/week, or ≥ 3 days/week. Sleep duration was categorized as < 8 hours/day or ≥ 8 hours/day based on the recommended hours of sleep per day for adolescents.27 Sleep quality was defined using the Korean version of Pittsburgh Sleep Quality Index (PSQI-K, range from 0 to 21)28 and was categorized as good (< 5) or poor (≥ 5). Reproductive factors included age at menarche and experiencing premenstrual syndrome (PMS). The PMS status (no or yes) was defined according to the recommendations of the American College of Obstetricians and Gynecologists (ACOG) as all of the following: 1) the presence within 5 days before menstruation in the previous three menstrual cycles, 2) ending within 4 days after menstruation, 3) interference with some normal activities, and 4) the presence of at least one physical symptom and one emotional symptom.29 Mental health factors included self-perceived health status, perceived stress, and depressive symptom. Self-perceived health status was categorized as excellent, good, fair, or poor.30 Perceived stress was measured using the Perceived Stress Scale-4 (PSS-4, range from 0 to 16),31 and was categorized as none (< 5), sometimes (5–8), or often (≥ 9). Depressive symptom was defined using the Patient Health Questionnaire-9 (PHQ-9, range from 0 to 27)32 and categorized as no (< 5) or yes (≥ 5).
Statistical analysis
According to the severity of dysmenorrhea, the participants’ characteristics were compared using a one-way analysis of variance followed by Duncan’s multiple range test for the continuous variables and the chi-square test and Cochran-Armitage trend test for the categorical variables. The data are presented as means ± standard deviations (SDs) and frequencies (percentage, %). Multinomial logistic regressions were used to estimate the odds ratios (ORs) and 95% confidence intervals (CIs) for moderate or severe dysmenorrhea (vs. none and mild dysmenorrhea) associated with weight changes and weight control-related diets. Sequential models were constructed to evaluate the effect of healthy weight control behaviors on dysmenorrhea. Model A was adjusted for age, age at menarche, BMI (kg/m2), parity, alcohol consumption, smoking status, physical activity, sleep quality, perceived stress, and depressive symptoms. Model B was further adjusted for healthy weight control behaviors (exercise and diet management). All analyses were conducted by stratification to evaluate differences according to life cycle stages. In addition, all statistical analyses were performed using SAS, version 9.4 (SAS Institute Inc., Cary, NC, USA), and at a two-sided significance level of P < 0.05.
RESULTS
The general characteristics of the participants according to the severity of dysmenorrhea are presented in Table 1. Of the 5,829 participants, 5,245 experienced dysmenorrhea. The distribution of dysmenorrhea by severity was as follows: 29.2% (n = 1,703) had mild, 37.5% (n = 2,184) had moderate, and 23.3% (n = 1,358) had severe dysmenorrhea. The distribution of dysmenorrhea severity stratified according to the life cycle stage is presented in Supplementary Fig. 1. The mean age and mean age at menarche ± SDs of the participants with severe dysmenorrhea were 21.88 ± 8.60 and 12.75 ± 1.45 years, respectively, and these were significantly lower than those without dysmenorrhea or with mild or moderate dysmenorrhea. There was a statistically significant difference in the proportion of BMI according to dysmenorrhea severity. In addition, the more severe the dysmenorrhea, the more significant the decrease in the proportion of participants with good sleep quality and a sleep duration of ≥ 8 hours/day. Regarding mental health status, participants with dysmenorrhea were less likely to respond with “excellent” in terms of self-perceived health status than those without dysmenorrhea. The means of the perceived stress scores and the depressive symptom scores increased with the increasing dysmenorrhea severity. Similarly, the proportion of participants who answered “often” for perceived stress or who had depressive symptom increased gradually from the group with “none” to the group with “severe dysmenorrhea.” The stratified analysis according to the life cycle stage results (Supplementary Table 1) showed similar patterns.
Table 1
General characteristics according to the severity of dysmenorrhea (n = 5,829)
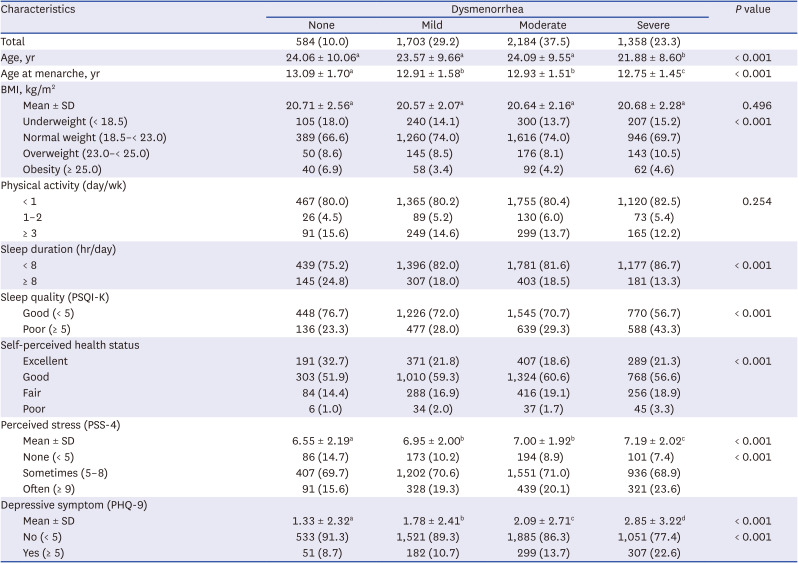
Values with the same categories (a, b, c, and d) are not significantly different according to Duncan’s multiple range test.
BMI = body mass index, SD = standard deviation, PSQI-K = the Korean version of Pittsburgh sleep quality index, PSS-4 = the perceived stress scale-4, PHQ-9 = the patient health questionnaire-9.
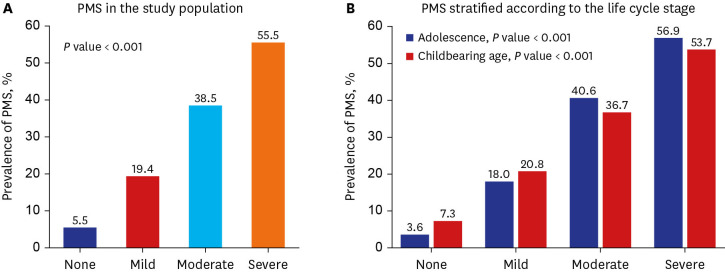
The prevalence of PMS according to dysmenorrhea severity is shown in Fig. 1. The prevalence of PMS increased gradually from 5.5% in “none” to 55.5% in the “severe dysmenorrhea” group, which was statistically significant (Fig. 1A). In the stratified analysis according to the life cycle stage, the results were similar (Fig. 1B).
Fig. 1
Prevalence of PMS according to the severity of dysmenorrhea. (A) PMS in the study population. (B) PMS stratified according to the life cycle stage. P value from Cochran-Armitage trend test.
PMS = premenstrual syndrome.
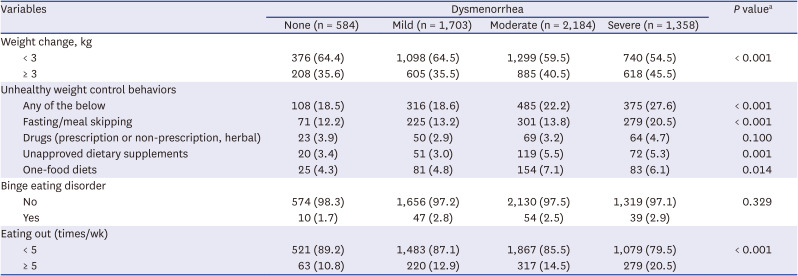
Weight changes and weight control-related diet statuses of the participants according to the severity of dysmenorrhea are presented in Table 2. In the “moderate” and “severe” dysmenorrhea groups, participants had greater weight changes (≥ 3 kg) than those in the “none” or “mild dysmenorrhea” group. In addition, the proportion of the participants who displayed any unhealthy weight control behaviors and ate out more than five times a week increased gradually as the severity of dysmenorrhea increased. In the stratified analysis according to the life cycle stage (Supplementary Table 2), most of the results were similar; however, in adolescence, there was a significant difference in the proportion of participants who used drugs. Moreover, there was no statistically significant difference in the proportion of participants who used unapproved dietary supplements and those who consumed one-food diets according to the severity of dysmenorrhea.
Table 2
Weight changes and weight control-related diets according to the dysmenorrhea status (n = 5,829)
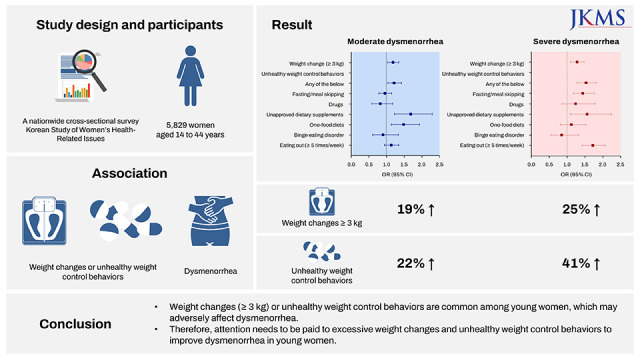
The risk of moderate or severe dysmenorrhea according to weight changes and weight control-related diets after adjusting for covariates is shown in Table 3. Not all of the associations of moderate or severe dysmenorrhea (vs. none to mild dysmenorrhea) with weight-related factors were statistically significant; however, all trends were similar. In model A, the ORs for moderate and severe dysmenorrhea in participants with weight changes of ≥ 3 kg (vs. < 3 kg) were 1.19 (95% CI, 1.05–1.35) and 1.25 (95% CI, 1.08–1.45), respectively. In the stratified analysis according to the weight change statuses, similar results were found regardless of loss or gain (data not shown). For unhealthy weight control behaviors, any unhealthy weight control behavior was associated with moderate (OR, 1.22; 95% CI, 1.04–1.42) and severe (OR, 1.41; 95% CI, 1.19–1.67) dysmenorrhea; unapproved dietary supplements had similar trends. Finally, the OR for severe dysmenorrhea in participants who ate out more than five times/week (vs. < 5 times/week) was 1.69 (95% CI, 1.40–2.05). All results were similar after additional control for healthy weight control behaviors (exercise and diet management) in model A. In the stratified analysis according to the life cycle stage (Supplementary Tables 3 and 4), any unhealthy weight control behavior, fasting/meal skipping, and eating out (≥ 5 times/week) were associated with severe dysmenorrhea in both the adolescence and childbearing age. In addition, weight changes (≥ 3 kg) and unapproved dietary supplements were significantly associated with moderate and severe dysmenorrhea only in participants during the childbearing age.
Table 3
ORs for moderate and severe dysmenorrhea according to weight changes and weight control-related diets (n = 5,829)
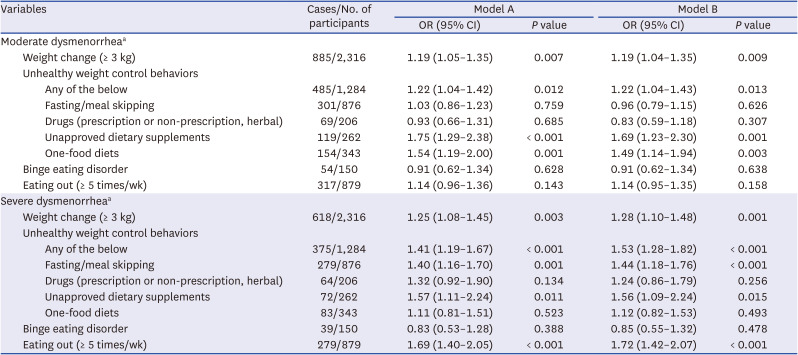
Model A was adjusted for age, age at menarche, BMI, parity, alcohol consumption, smoking status, physical activity, sleep quality, perceived stress, and depressive symptom.
Model B was adjusted for model A covariates plus healthy weight control behaviors (exercise and diet management).
OR = odds ratio, CI = confidence interval.
aReference is the none to mild dysmenorrhea group.
DISCUSSION
Excessive weight changes or unhealthy weight control-related diets may have a wide range of adverse health effects among young women of reproductive age. In this study, we investigated the association of weight changes (≥ 3 kg) or unhealthy weight control behaviors with dysmenorrhea, a gynecological disorder, particularly among young women in Korea. Our study found increased risk and severity of dysmenorrhea in participants who experienced weight changes (≥ 3 kg) over the past year or exhibited unhealthy weight control behaviors (any of the behaviors, fasting/meal skipping, use of unapproved dietary supplements, and one-food diets) and eating out frequently.
The prevalence of overall dysmenorrhea in this study was 90.0% (29.2%, 37.5%, and 23.3% for mild, moderate, and severe dysmenorrhea, respectively), which was higher compared to the prevalence of 71.1% overall dysmenorrhea reported in a systematic review study.2 Similarly, in a study on Korean women in which dysmenorrhea was measured using a VAS, the prevalence of dysmenorrhea was reported to be 86.3%;5 therefore, the difference in prevalence may have been due to differences in the ethnicity or country. However, while the previous study was a small-scale study targeting some of the female university students, this study was different in that it targeted young women, in general, in Korea. The differences in prevalence may also have been due to differences in the dysmenorrhea questionnaires. Although the VAS or numeric rating scale (NRS) has been used mainly to measure dysmenorrhea, some studies have used a ‘yes or no’ scale or a ‘mild, moderate, or severe’ scale. In addition, some surveys did not provide a definition for dysmenorrhea (e.g. lower abdominal pain just before or during menstruation).2 Since the prevalence of dysmenorrhea may vary across questionnaires, accurate criteria and standardized scales such as a VAS or NRS for dysmenorrhea are needed for comparisons between populations.
Although the mechanism of dysmenorrhea is not fully understood, it is caused by a complex process involving ovarian hormones and inflammatory factors. One of the main causes of dysmenorrhea may be the abnormal release of prostaglandins produced by the endometrium into the uterine tissue. The released prostaglandins cause dysmenorrhea through increased uterine muscle contractions resulting in decreased uterine blood flow and leading to ischemia.33 A study reported that prostaglandin levels were significantly higher in the menstrual extracts of participants with dysmenorrhea than in those without.34 Another study found higher prostaglandin levels as the pain intensity of dysmenorrhea increased.35 One of the other causes of dysmenorrhea is vasopressin, a hormone secreted by the posterior pituitary gland. Vasopressin may contribute to uterine contractile activity and decrease blood flow, leading to ischemia and dysmenorrhea.36 However, although a study on women with PMS or dysmenorrhea (vs. women without symptoms) found higher concentrations of vasopressin, it is still controversial.36 Furthermore, in addition to hormonal and inflammatory factors, various factors such as BMI, lifestyle, mental health, and diet may contribute to the pathogenesis of dysmenorrhea.689
With increasing interest in women's body image, more women are trying to diet to lose weight. In our study, 1,284 participants of 5,829 (22.0%) had shown at least one unhealthy weight control behavior, while 617 participants (10.6%) lost 3 kg or more in the past year. However, weight loss through unhealthy weight control behaviors may lead to weight gain over time.37 Moreover, despite a large number of participants attempting weight control behaviors, we found that those who gained weight (≥ 3 kg) constituted a higher proportion (29.2%) than those who lost weight in the past year. This may have been due to the normal growth of the adolescent participants; however, it is also possible that the expansion of eating out, fast food, or the delivery food culture in Korea may have led to weight gain.
We found that association weight changes (≥ 3 kg) over the past year and the risk of dysmenorrhea. The association was similar, regardless of loss or gain, even in the obese group (data not shown). Although the association between weight changes and dysmenorrhea is not yet known, weight changes alter the levels of ovarian hormones such as estrogen and progesterone as well as inflammation levels.383940 Previous studies have reported that weight changes alter the menstrual cycle through changes in ovarian hormones.41 In addition, inflammatory factors such as tumor necrosis factor-alpha and interleukin-6 may act as mediators stimulating the release of prostaglandins and have been correlated negatively with estrogen and progesterone levels.4243 Progesterone also affects the synthesis or regulation of prostaglandins.44 One study has also suggested that progesterone has anti-inflammatory effects and that increasing the progesterone levels may reduce dysmenorrhea by decreasing prostaglandin levels.45
In this study, there were significant differences in BMI according to the severity of dysmenorrhea. Our results showed that the proportions of underweight and obesity were higher among participants without dysmenorrhea than among those with dysmenorrhea. In contrast, a previous cross-sectional study reported an increased risk of dysmenorrhea in underweight female students.6 In addition, another study showed that BMI was not associated with dysmenorrhea.46 Because it is still controversial, further studies are needed to investigate the association of BMI with dysmenorrhea.
Regardless of the weight changes, we also found that unhealthy weight control behaviors and eating out were associated with dysmenorrhea. These may have affected the dysmenorrhea, in terms of nutrition. Unhealthy weight control behaviors such as fasting, meal skipping, and one-food diets lead to irregular eating and avoiding certain foods, which in turn may lead to undernutrition and nutritional imbalances. In addition, there may be a difference in the nutritional statuses between those who eat out and those who cook at home, as homemade food is healthier and provides more comprehensive nutrition.47 A study suggested that severe intensity of the PMS was associated with more unfavorable or less favorable nutrients.48 Although the association of nutritional status with dysmenorrhea has not yet been revealed, it may suggest that more nutritious and healthier eating behaviors may reduce dysmenorrhea.
In this study, we also found the possibility that age, age at menarche, sleep duration, sleep quality, mental health (perceived stress and depressive symptom), and PMS are related to dysmenorrhea. Among these factors, age and age at menarche were already known to be common risk factors for dysmenorrhea.6 We found that the proportion of participants who slept < 8 hours/day and those with poor sleep quality increased with the severity of the dysmenorrhea. Although our findings are consistent with those of a previous study that reported that sleep was associated with dysmenorrhea, that study suggested that dysmenorrhea caused sleep disorders.8 In this study, the perceived stress scores increased with the severity of the dysmenorrhea, and the proportion of ‘often’ for perceived stress was also increased. Although the mechanism of the association between stress and dysmenorrhea is still unknown, a previous study reported that stress affects the activity of prostaglandins by disrupting the follicular development through the inhibition of the release of follicle-stimulating and luteinizing hormones.49 Stress also produces prostaglandins in the uterine muscle by producing the cortisol hormone and adrenaline.49 In addition, we found that the depressive symptom scores and the proportion of participants who had depressive symptoms increased with the severity of dysmenorrhea. An association between depression and dysmenorrhea was already reported by many epidemiological studies, but most of the results suggested that dysmenorrhea induces depression.50 Therefore, further longitudinal studies are needed to clarify the causal relationship between depression and dysmenorrhea. Finally, in our study, PMS was correlated with dysmenorrhea. This was consistent with the findings of a Japanese adolescent study that reported that the prevalence of PMS increased with the severity of dysmenorrhea.51 The study suggested the possibility that PMS and dysmenorrhea have overlapping biochemical etiologies such as prostaglandin production.
Although various factors have been shown as risk factors for dysmenorrhea, there is still insufficient research and interest in their effect on dysmenorrhea. Nevertheless, dysmenorrhea is a gynecological condition in women that may impair physical activity, sleep quality, and quality of life, and in the long term, may lead to central sensitization and other chronic pain conditions.4 Therefore, it is very important to investigate modifiable factors to improve dysmenorrhea in young women.
To the best of our knowledge, this was the first study to investigate the association between weight changes (≥ 3 kg) or unhealthy weight control behaviors and dysmenorrhea. This study used large-scale data representing young Korean women of reproductive age after adjusting for various confounding factors including demographic, biological, health behavioral, and psychological factors. In addition, since there were differences in characteristics by life cycle stage, stratified analyses were conducted between adolescence and childbearing age.
The first important limitation of this study was that the direction of the causal relationship cannot be inferred due to the cross-sectional design of the study. Second, the severity of the dysmenorrhea may not be objective because it was self-reported using a VAS. However, the acceptability of a VAS as a pain scale has been proven, and its reliability and validity are known to be high.20 Third, we were not able to confirm the participants’ medical records or conduct gynecological or health examinations. Therefore, the possibility of secondary dysmenorrhea caused by a pelvic pathology such as endometriosis could not be excluded. Through self-reports, we found that none belonged to the disease of genitourinary system category, including endometriosis and secondary dysmenorrhea, of KCD-7. Moreover, it is well known that most young women experience primary dysmenorrhea.5 Nevertheless, as this study was based on a survey, unconfirmed secondary dysmenorrhea or diseases causing dysmenorrhea may have affected the results. Similarly, the effects of use of painkiller could not be controlled, because we did not know whether painkillers were used. Fourth, menstrual status questionnaire (based on the last 3 months in the adolescence and the last 1 year in childbearing age) differed according to life cycle stage. Nevertheless, we found that results for the association of unhealthy weight control behaviors or eating out with severe dysmenorrhea were similar in the stratified analysis. Finally, since only the weight changes of the participants were investigated, it was not possible to determine whether this was due to changes in body fat or muscle mass.
Our study showed that weight changes and unhealthy weight control behaviors were common, and that they were associated with dysmenorrhea. Therefore, attention needs to be paid to excessive weight changes and unhealthy weight control behaviors to improve dysmenorrhea in young women.
 XML Download