

 PDF
PDF Citation
 Print
Print


INTRODUCTION
Chronic kidney disease (CKD) is a major global health problem. The age-standardized prevalence worldwide in CKD stages 1 to 5 among adults 20 years of age and older in 2010 was 10.4% for males and 11.8% for females.1 The overall prevalence of CKD was 13.7% in Korea among those 35 years or older in 2007.2 CKD is an independent predictor of all-cause mortality and cardiovascular mortality in the general population.3 Known risk factors associated with CKD include hyperuricemia.45 In particular, hyperuricemia has been recognized as an independent risk factor for various other clinical conditions including cardiovascular disease, hypertension (HTN), metabolic syndrome, and all-cause mortality.678 Although evidence from epidemiologic studies supports the association between high levels of serum uric acid (SUA) and cardiovascular mortality in the general population,91011 in other studies, this association was not confirmed.12131415 Hyperuricemia is also a risk factor for CKD.416 Previous experimental studies suggested the possible role of uric acid in the pathogenesis of CKD.17 Because therapeutic approaches to slow CKD progression remain limited, the role of uric acid in CKD has attracted the interest of researchers.17 Nevertheless, the association of CKD with SUA has also generated controversy. Some authors reported that the association between CKD and SUA levels was not significant.1819 Therefore, there remains debate regarding whether hyperuricemia is an actual causal factor of CKD progression or a simple result of CKD. Furthermore, most studies have focused on the clinical implications of hyperuricemia; however, a few studies reported that the association between uric acid levels and clinical outcomes was U-shaped, suggesting that both low and high uric acid levels were associated with poor outcomes.1420 Despite several clinical trials to investigate the effects of uric acid-lowering agents on renal function, there has been no consensus on the therapeutic target range of SUA level.21 Reference ranges of SUA levels were quite different between males and females; they were found to be 4.0–8.5 mg/dL in males and 2.7–7.3 mg/dL in females.22 Recently, sex differences in associations between uric acid and all-cause mortality or CKD have reported.2324 Therefore, in the present study, we evaluated the association between SUA levels and end-stage renal disease (ESRD) development and death in the general adult population in Korea by sex-specific analysis.
METHODS
Study population
We enrolled 143,762 participants aged ≥ 18 years with eGFR ≥ 15 mL/min/1.73 m2, who had voluntary health screenings at the Seoul National University Hospital from 1995 to 2006, and at the Seoul National University Bundang Hospital and Healthcare System Gangnam Center from 2003 to 2009 (Supplementary Fig. 1).
Measurement and definitions
The subjects came to the hospital after an overnight fast for at least 12 hours, had their blood pressure (BP) measured and underwent blood and urine tests. Serum creatinine levels were measured by the Jaffe reaction traceable to the isotope dilution mass spectrometry method and National Institute of Standards and Technology Standard Reference Material 967 calibrator using a Hitachi 7600 analyzer (Toshiba, 200FR, Tokyo, Japan). The estimated glomerular filtration rate (eGFR) was calculated using the CKD-EPI (Chronic Kidney Disease Epidemiology Collaboration) equation.25 Proteinuria was assessed using the urine dipstick test and grouped as negative, trace-1+, and ≥ 2+. Height and weight were measured with the participant wearing light clothing and no shoes. Body mass index (BMI) was computed as weight (kg) divided by height (m) squared. BP was measured by using the standard protocol. The three readings were obtained using a mercury sphygmomanometer. The average of the second and third readings was considered the final BP. HTN was defined as systolic blood pressure of 140 mmHg, diastolic blood pressure of 90 mmHg, a self-reported history of HTN or use of anti-hypertensive medications. Diabetes mellitus (DM) was defined as a fasting glucose level of 126 mg/dL, a self-reported history of DM, or the use of hypoglycemic agents. The nutritional risk index (NRI) was calculated from the serum albumin levels and the ratio of present to ideal body weight. The formula for NRI was as follows: NRI = (1.519 × serum albumin, g/dL) + (41.7 × present weight [kg]/ideal body weight [kg]).2627 The grades of nutrition-related risk were defined: high risk (< 83.5), moderate risk (83.5 to < 97.5), low risk (97.5–100), and no risk (> 100).27 All biochemical and demographic variables were determined by the documented data from the baseline health examination. Mortality data of participants by December 2017 was obtained from the Ministry of the Interior and Safety in Korea. The development of ESRD by May 2018 was determined by the ESRD registry of the Korean Society of Nephrology (KSN). Each outcome data from external institutions was merged with the total data set based on the identifier of participants. Death from cardiovascular cause was ascertained by reviewing the electronic medical records. All personal identifying information was removed from the merged data before analysis. All these processes were subjected to approval by an Institutional Review Board (IRB).
Statistical analyses
Data are presented as the mean ± standard deviation for continuous variables and as proportions for categorical variables. Differences in continuous variables were analyzed by one-way analysis of variance, and differences in categorical variables were assessed with χ2 tests. Because the reference range of SUA varies by sex, participants were divided into sex-specific SUA quintiles based on the entire study population for both sexes. Kaplan–Meier survival curves were compared using the log-rank test. P values for log-rank tests were adjusted using the Benjamini and Hochberg method for multiple comparisons.28 Considering the interaction between sex and SUA, sex-specific Cox proportional hazards models were constructed to evaluate the association between SUA quintiles and ESRD and all-cause mortality, initially without adjustment, and then adjusting for multiple covariates. The covariates with statistically significant in the univariate analysis or clinically significance were included in the multivariate analysis. The proportional hazards assumption was tested using Schoenfeld residuals. In the sensitivity analysis, we performed 1) sex-specific Cox analyses in participants with no or low nutrition-related risk as defined NRI > 97.5, and 2) multivariable Fine and Gray sub-distribution hazard regression model for ESRD development, treating death as a competing event.29 To further delineate the association between SUA level and ESRD and all-cause mortality, sex-specific restricted cubic spline modeling was used. The results of these models were reported as hazard ratios (HRs) with 95% confidence intervals (CIs). P values < 0.05 were considered statistically significant. All analyses were performed using SPSS software (version 25.0; SPSS, Inc., Chicago, IL, USA) and R software (version 3.6.1; R Foundation for Statistical Computing, Vienna, Austria).
Ethics statement
The study was conducted in accordance with the Declaration of Helsinki and approved by the Seoul National University Hospital IRB (IRB No. B-1801/442-003). The IRB waived the requirement for written informed consent as the study was a retrospective observational study without intervention.
RESULTS
Baseline characteristics of participants
Baseline characteristics of the 143,762 participants are presented by SUA quintiles and sex in Table 1. Of the total 143,762 participants, 53.4% (n = 76,784) were male. The distribution of SUA, according to sex, is shown in Supplementary Fig. 2. The mean SUA was 6.12 ± 1.27 mg/dL in males and 4.38 ± 0.96 mg/dL in females. The mean age was 50.4 ± 12.1 years in males and 50.6 ± 12.2 years in females. The median eGFR was 91.5 ± 14.9 mL/min/1.73 m2 in males and 97.6 ± 15.0 mL/min/1.73 m2 in females. In both sexes, with increasing SUA levels, BMI, weight, phosphorus, cholesterol, triglyceride, and proportion of metabolic syndromes increased, but eGFR decreased. In contrast, different trends in diabetes prevalence and age across the SUA quintiles were observed between males and females; males in the lower SUA quintiles were more likely to have diabetes compared to their female counterparts (Supplementary Fig. 3). Lower uric acid levels were associated with older age in males and younger age in females (Supplementary Fig. 4).
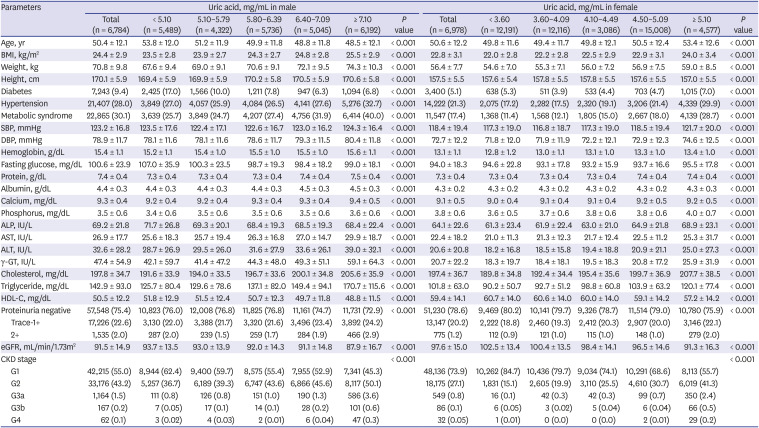
Table 1
Baseline characteristics according to serum uric acid level in males and females
Data are presented as mean ± standard deviation or number (%).
BMI = body mass index, SBP = systolic blood pressure, DBP = diastolic blood pressure, ALP = alkaline phosphatase, AST = aspartate aminotransferase, ALT = alanine aminotransferase, γ-GT = gamma-glutamyltransferase, HDL-C = high-density lipoprotein cholesterol, eGFR = estimated glomerular filtration rate, CKD = chronic kidney disease.
![]()
Uric acid and ESRD development
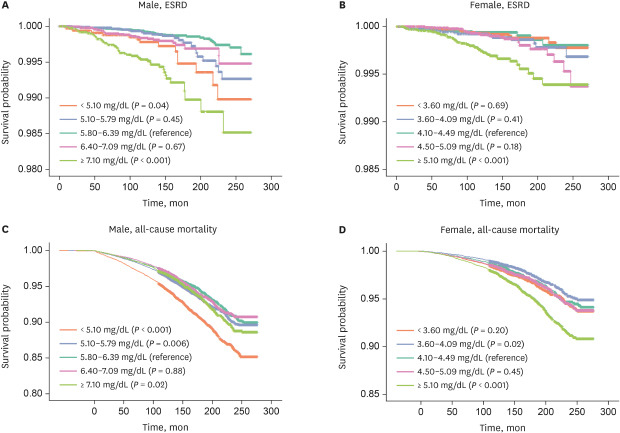
A total of 0.2% (n = 272) of participants suffered from ESRD during a mean follow-up period of 152.0 ± 44.1 months. The ESRD rates according to the SUA quintiles were 0.24%, 0.15%, 0.11%, 0.13%, and 0.41% for males and 0.11%, 0.13%, 0.08%, 0.15%, and 0.33% for females, respectively. ESRD was more common in the highest SUA quintile in both sexes. In the Kaplan–Meier analysis, males in the highest and lowest quintile showed significantly lower event-free survival than those in the middle quintile (log-rank test: adjusted P value=0.04 and < 0.001, respectively) (Fig. 1). In females, subjects in the highest SUA quintile had significantly lower event-free survival than those in the middle SUA quintile (adjusted P < 0.001). In unadjusted Cox regression analysis, significant associations with ESRD development were found in the lowest and highest SUA quintile of males, and in the highest SUA quintile of females (Table 2). After multivariable adjustment for the potential confounders, these associations remained statistically significant in males (HR for SUA < 5.10 mg/dL, 1.90; 95% CI, 1.02–3.51, HR for SUA ≥ 7.10 mg/dL, 2.13; 95% CI, 1.18–3.84) and females (HR for SUA ≥ 5.10 mg/dL, 2.31; 95% CI, 1.10–4.84). A multivariable-adjusted restricted cubic spline model revealed the non-linear relationship between SUA levels and ESRD in Fig. 2A. The association between SUA levels and ESRD development was notably different between males and females, indicating U-shaped and J-shaped associations, respectively.

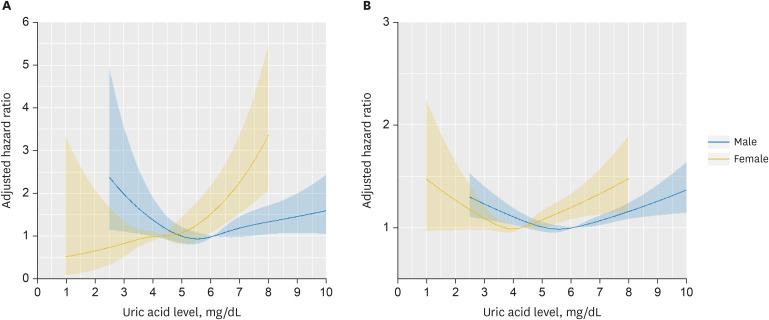
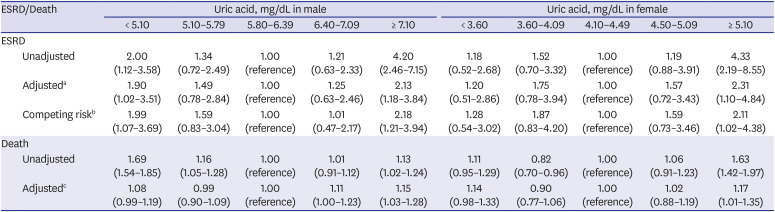
Fig. 1
Kaplan-Meier curves for ESRD and all-cause mortality. (A) Male, ESRD, (B) Female, ESRD, (C) Male, all-cause mortality, (D) Female, all-cause mortality. Each uric acid group represents quintiles. P values are for log-rank test and adjusted for multiple comparisons.
ESRD = end-stage renal disease.
![]()
Fig. 2
Restricted cubic spline curves illustrating the association between serum uric acid levels and the risk of ESRD and all-cause mortality. The median value of uric acid levels was set as a reference. (A) ESRD, (B) All-cause mortality. Blue line: male, yellow line: female. The shaded area represents the 95% confidence interval.
ESRD = end-stage renal disease.
![]()
Table 2
Associations of serum uric acid levels with ESRD and all-cause mortality
Entries are hazard ratio or subdistributional hazard ratio (95% confidence interval).
ESRD = end-stage renal disease, BMI = body mass index, eGFR = estimated glomerular filtration rate, SBP = systolic blood pressure, ALP = alkaline phosphatase, AST = aspartate aminotransferase, ALT = alanine aminotransferase, γ-GT = gamma-glutamyltransferase.
abMale: adjusted for age, BMI, eGFR, SBP, hypertension, diabetes, albumin, HDL-cholesterol, Hb, and proteinuria; abFemale: adjusted for age, BMI, eGFR, SBP, hypertension, diabetes, ALP, albumin, fasting glucose, and proteinuria; cMale: adjusted for age, BMI, eGFR, SBP, DBP, diabetes, hypertension, ALP, AST, γ-GT, albumin, phosphorous, total cholesterol, fasting glucose, hemoglobin, and proteinuria; cFemale: adjusted for age, BMI, eGFR, SBP, diabetes, hypertension, ALP, AST, albumin, total cholesterol, fasting glucose, hemoglobin, and proteinuria; bFine and Gray subdistribution hazard model treating death as a competing event.
![]()
Uric acid and all-cause mortality
Four-point three percent (n = 6,215) of participants died during a mean follow-up period of 157.4 ± 44.5 months. Mortality rates according to the SUA quintiles were 8.7%, 5.7%, 4.8%, 4.6%, and 5.0% for males and 3.2%, 2.2%, 2.6%, 2.7%, and 3.9% for females, respectively. The mortality rate was highest in the lowest SUA quintile in males and the highest SUA quintile in females. In the Kaplan–Meier curve, males in the lowest and highest quintiles of SUA showed significantly lower survival compared to the middle quintile (log-rank test: adjusted P < 0.001 and P = 0.02) (Fig. 1). In females, the highest SUA quintile showed significantly lower survival (adjusted P < 0.001). In unadjusted Cox regression analysis, significant associations with all-cause mortality in the highest and lowest quintiles were observed in males (HR for SUA < 5.10 mg/dL, 1.69; 95% CI, 1.54–1.85, HR for SUA ≥ 7.10 mg/dL, 1.13; 95% CI, 1.02–1.24) and in the highest quintile in females (HR for SUA > 5.10 mg/dL, 1.63; 95% CI, 1.42–1.97), respectively (Table 2). After multivariable adjustment, in male, the associations with all-cause mortality were significant in the highest quintile group (HR, 1.15; 95% CI, 1.03–1.28), but marginally significant in the lowest quintile group (HR, 1.08; 95% CI, 0.99–1.19).
In females, the highest SUA quintile showed significant associations with all-cause mortality (HR, 1.17; 95% CI, 1.01–1.35). In the restricted cubic spline model, overall associations between SUA level and all-cause mortality were comparable between both sexes, showing U-shaped associations (Fig. 2B). Nevertheless, the lower bound of the 95% CI in the range of SUA < 4 mg/dL did not cross 1.0 only in males, which is considered statistically significant. To further examine the significance of the association between hypouricemia and mortality, we additionally performed Cox regression analysis according to the five groups based on the 5th, 20th, 80th, and 95th percentiles (Supplementary Table 1). The results were consistent with the spline model. There were significant associations with all-cause mortality in the highest and lowest SUA groups of males (HR for SUA < 4.10 mg/dL, 1.21; 95% CI, 1.08–1.35, HR for SUA ≥ 7.80 mg/dL, 1.13; 95% CI, 1.01–1.27) and in the highest SUA group of females (HR for SUA ≥ 5.70 mg/dL, 1.24; 95% CI, 1.07–2.43). To further investigate the association between SUA levels and cardiovascular (CV) death, we performed Cox proportional hazard analyses for 591 subjects (372 in males and 219 in females) who died from cardiovascular disease among 3,352 deaths with the valid cause of death (Supplementary Table 2). In males, only the highest uric acid quintile was statistically significant in the multivariable-adjusted model (HR for SUA ≥ 7.10 mg/dL, 1.86; 95% CI, 1.31–2.65). However, in females, non-significant associations of uric acid with CV death were found, which may be due to lack of power.
Sensitivity analyses
We performed sensitivity analyses that were restricted to participants with low or no risk for malnutrition (NRI > 97.5). There were 2,718 (1.9%) participants with moderate to high nutrition-related risks (1,038 [1.4%] in males, 1,680 [2.5%] in females). The lowest quintile showed the highest nutrition-related risks in both sexes (Supplementary Table 3). In participants with low and no risks for malnutrition, the associations of uric acid level with ESRD and all-cause mortality were similar to those in main analyses, but the associations with ESRD did not remain statistically significant for the lowest quintile in males (Supplementary Table 4). In competing risk models for ESRD development in the whole cohort, the associations remained consistent in males (sub-distribution HR for SUA < 5.10 mg/dL, 1.99; 95% CI, 1.07–3.69, HR for SUA ≥ 7.10 mg/dL, 2.18; 95% CI, 1.21–3.94) and in females (HR for SUA ≥ 5.10 mg/dL, 2.11; 95% CI, 1.02–4.38) (Table 2). Cumulative incidence curves for each SUA quintile for ESRD are shown in Supplementary Fig. 5.
Subgroup analyses
We conducted the subgroup analysis stratified by age and eGFR (Supplementary Fig. 6 and Supplementary Table 5). For males, overall higher risks were found in participants with decreased kidney function (eGFR < 60 mL/min/1.73 m2). Lower SUA levels were associated with higher risk of mortality and ESRD in males with old age and eGFR ≥ 60 mL/min/1.73 m2. For females, similar associations of SUA quintiles with ESRD and death were found between age subgroups. Nevertheless, overall, a larger range of confidence interval was noted due to the small number of subgroup subjects and events, particularly in females with eGFR < 60 mL/min/1.73 m2.
DISCUSSION
In the current cohort of the general Korean population, we analyzed the effects of the SUA levels on ESRD development and all-cause mortality using sex-specific proportional hazards models. Higher SUA levels were associated with increased risk of ESRD and mortality in both sexes. However, the association between lower SUA levels and ESRD and mortality was found only in males. Particularly, different association patterns between SUA levels and ESRD were found between males and females, showing U-shaped and J-shaped associations, respectively. In males, the lowest (< 5.10 mg/dL) and highest (> 7.10 mg/dL) SUA quintiles were significantly associated with increased risk of ESRD compared with middle (5.80–6.39 mg/dL) quintile. In females, only the highest (> 5.10 mg/dL) SUA quintile was significantly associated with increased risk of ESRD.
These results were similar to another Korean cohort study conducted to investigate the effect of SUA on incident CKD.30 Hyperuricemia was associated with CKD development and progression in previous studies.431 Several mechanisms have been suggested through which hyperuricemia affects the progression of CKD. In animal studies, afferent arteriole hypertrophy and luminal obliteration induced by hyperuricemia have been shown to result in reduced renal blood flow and glomerular HTN.3233 The glomerular HTN in hyperuricemic rats causes glomerular hypertrophy and sclerosis.34 Mild hyperuricemia induced by uricase inhibition caused intrarenal oxidative stress, contributing to renal abnormalities such as arteriolopathy.35 In a Japanese cohort study with healthy individuals, investigators showed that the risk of loss of kidney function was high for both males and females with high SUA levels.20 The risk was also high for males with low SUA levels. These results were comparable with our findings. The relationship and involved mechanisms between hypouricemia and CKD development are not well known. Uric acid is known to function as one of the most important antioxidants in human biological fluids, accounting for over 50% of the free radical neutralization capacity.36 Uric acid blocks nitrogen peroxide (ONOO-)-mediated oxidative injury involved in vascular endothelial dysfunction in several experimental studies.3536 These findings suggest that hypouricemia may indicate low antioxidant capacity, resulting in vascular dysfunction.
Furthermore, in this study, the prevalence of diabetes was significantly higher in males with lower SUA levels than female counterparts. In diabetic patients, uric acid level tends to decrease with higher HbA1c levels, and hypouricemia is associated with glomerular hyperfiltration and could be an early predictor of diabetic nephropathy.3738 Given that poor glycemic control and renal hyperfiltration contribute to the development of diabetic nephropathy, diabetic participants with hypouricemia might be at high risk for CKD progression. Our sensitivity analysis after excluding subjects with increased risk for malnutrition showed that associations of hypouricemia with risk of ESRD were not statistically significant in males. These findings may suggest the possible associations of malnutrition with increased risk of ESRD in hypouricemic male participants. Similarly, Tseng et al.39 reported that malnutrition might be associated with a higher mortality rate with participants of lower SUA levels in older adults.
In some studies, including ours, hypouricemia affected only males. There are several possible explanations for this. An experimental study found that the effect of oxidative stress is more prominent in males than in females.40 In addition, our findings may be related to female sex hormones. In our study population, females with lower SUA levels were relatively younger than male counterparts, and the majority might be pre-menopausal (mean age, 49.8 years). Estradiol could reduce tubular post-secretory reabsorption of uric acid.41 Therefore, premenopausal females have low uric acid levels due to the action of estradiol.42 Estrogen has cardioprotective effects43 and beneficial effects on kidney disease progression by affecting TGF-β signaling, ECM accumulation, and renin-angiotensin system, which could make hypouricemia insignificant for all-cause mortality and ESRD in females.44
On the other hand, our findings showed that high SUA was related to the increased risk for all-cause mortality in both sexes. Particularly in males, the highest quintile of uric acid showed a significant association with CV death as well. Actually, the close associations between CV death and uric acid levels have been reported in several studies.89 Nevertheless, the associations between SUA and mortality according to sex differences have been controversial. Zhao et al.45 reported that, in their meta-analysis, hyperuricemia increased the risk of all-cause mortality among males (relative risk [RR], 1.23; 95% CI, 1.08–1.42), but not in females (RR, 1.05; 95% CI, 0.79–1.39). However, more recent studies have shown the opposite results; high SUA was significant only in females and not in males.234647 Other authors showed excess mortality in females with high levels of SUA than in males.4849 The reason for these conflicting results may be partially due to study design and multiple missing confounders. Several studies have used common ranges of SUA quantile groups for males and females,3950 which could make each quantile group heterogeneous. In addition, many authors selected the highest and lowest range of SUA as a reference SUA group for comparison, but we compared each SUA group with the middle range SUA group. In our study, mortality increased even at low values, which would have been offset by comparing the lowest and highest values.
There are some limitations to the present study. Due to the observational nature of this study, several unmeasured confounders might exist. In particular, information about the use of medications affecting the SUA levels, including uric acid-lowering agents and diuretics, was not available. In addition, our study population was relatively healthy and included few patients with CKD. Therefore, the incidence of ESRD and death was low during the follow-up period. Because the KSN ESRD registry does not fully cover the total ESRD population in Korea, some of the outcome data for ESRD may be missed. Because of these limitations, there is a lack of informative subgroup analyses in the study. Nevertheless, our study analyzed the effects of SUA on ESRD and all-cause mortality using multiple approaches with rigorous multivariable adjustments. Our findings could add value to understanding the association between SUA level and renal outcome and death.
In conclusion, the present study showed the sex-specific associations between uric acid levels and ESRD development and all-cause mortality in the general Korean population. Hyperuricemia is independently associated with ESRD and death in both sexes, while hypouricemia might be related to ESRD and death only in males. Our findings support U-shaped associations of uric acid levels with ESRD in males and J-shaped associations in females. Given the limitations of the retrospective nature of the study and unmeasured confounders, further prospective studies are needed to confirm our results.
 XML Download