Introduction
Materials and Methods
1. Patients
2. Treatments
3. Follow-up and outcomes
4. Statistical analysis
Results
1. Patients characteristics
Table 1.
Values are presented as median (range), number (%), or mean±SD. Because of rounding off, not all of the percentages total 100. CCRT, concurrent chemoradiotherapy; DLCO, diffusing capacity of the lung for CO; ECOG PS, Eastern Cooperative Oncology Group performance status; EGFR, epidermal growth factor receptor; FEV1, forced expiratory volume in one second; FVC, forced vital capacity; PD-L1, programmed cell death ligand 1; PFT, pulmonary function test; RT, radiotherapy; SD, standard deviation.
2. A pattern of failure with the use of durvalumab
Table 2.
| Outcome | CCRT alone (n=82) | CCRT+Durvalumab (n=89) | p-value |
|---|---|---|---|
| Any recurrence | 55 (67.1) | 47 (52.8) | 0.115 |
| Any LRF | 48 (58.5) | 33 (37.1) | 0.008 |
| Isolated LRF | 18 (22.0) | 11 (12.4) | 0.143 |
| Any DM | 37 (45.1) | 36 (40.4) | 0.644 |
| Isolated DM | 7 (8.5) | 14 (15.7) | 0.231 |
| Both LRF and DM | 30 (36.6) | 22 (24.7) | 0.129 |
| First site of failure | |||
| Lung and/or regional lymph node | 44 (53.7) | 28 (31.5) | 0.005 |
| Lung only | 20 (24.4) | 11 (12.4) | 0.066 |
| Regional lymph node only | 8 (9.8) | 6 (6.7) | 0.661 |
| Both lung and regional lymph node | 16 (19.5) | 11 (12.4) | 0.284 |
| Brain | 4 (4.9) | 5 (5.6) | > 0.99 |
| Bone | 1 (1.2) | 5 (5.6) | 0.252 |
| Others (liver, adrenal gland, distant LN) | 5 (6.1) | 7 (7.8) | > 0.99 |
| Both lung and distant organ | 1 (1.2) | 2 (2.2) | > 0.99 |
| Locoregional failure pattern | |||
| In-field failure | 22 (26.8) | 11 (12.4) | 0.027 |
| Out-of-field failure | 11 (13.4) | 10 (11.2) | |
| Botha) | 15 (18.3) | 12 (13.5) | |
| No. of organ with distant metastasis | |||
| Single organ | 15 (18.3) | 17 (19.1) | 0.807 |
| Multiple organ | 20 (24.4) | 18 (20.2) | |
| Site of distant metastasis | |||
| Pleura | 13 (15.9) | 7 (7.9) | 0.189 |
| Contralateral lung | 21 (25.6) | 12 (13.5) | 0.042 |
| Bone | 13 (15.9) | 17 (19.1) | 0.855 |
| Brain | 13 (15.9) | 14 (15.7) | 0.999 |
| Distant LN | 8 (9.8) | 10 (11.2) | 0.924 |
| Adrenal gland | 5 (6.1) | 3 (3.4) | 0.582 |
| Liver | 2 (2.4) | 3 (3.4) | 0.900 |
| Others | 6 (7.3) | 0 | 0.029 |
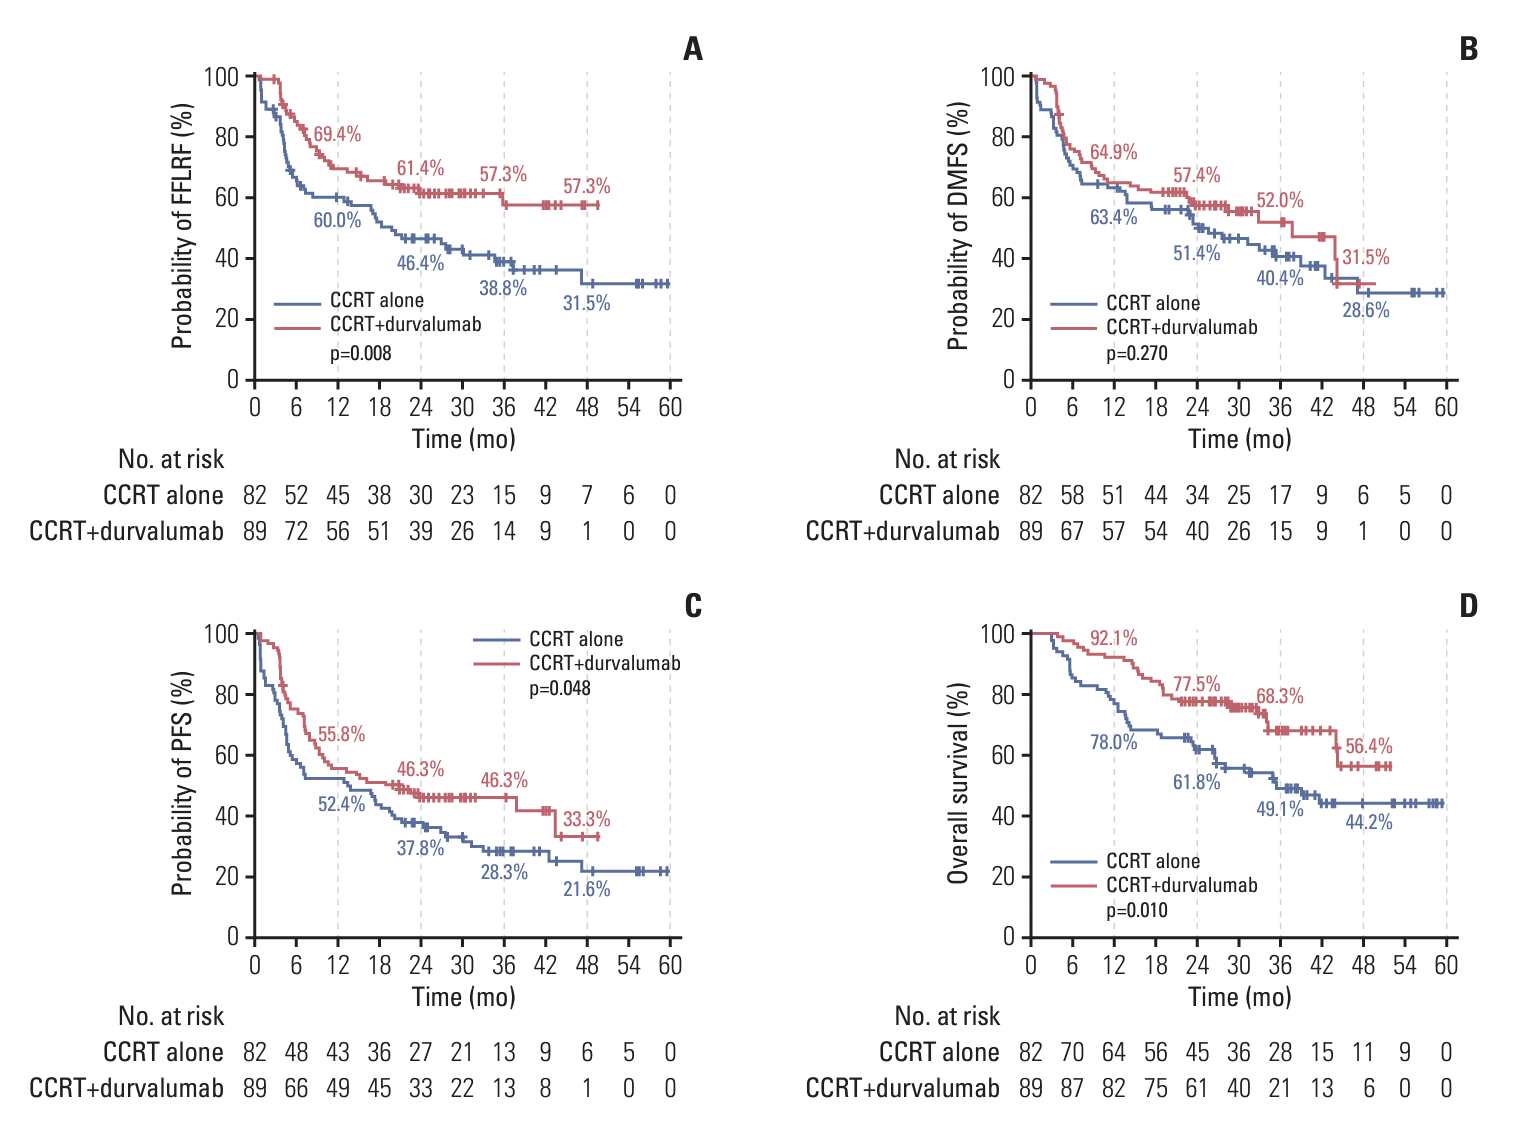
Fig. 1.

3. Progression-free survival and overall survival
Table 3.
| Variable |
Progression-free survival |
Overall survival |
||
|---|---|---|---|---|
| HR (95% CI) | p-value | HR (95% CI) | p-value | |
| Age, ≥ 65 yr | 1.08 (0.73-1.58) | 0.710 | 1.61 (0.98-2.63) | 0.059 |
| Male sex | 0.61 (0.39-0.96) | 0.031 | 1.49 (0.76-2.92) | 0.246 |
| ECOG PS, 2-3 | 1.02 (0.53-1.96) | 0.950 | 1.64 (0.81-3.32) | 0.166 |
| Underlying lung disease | 1.17 (0.70-1.94) | 0.552 | 1.30 (0.69-2.43) | 0.412 |
| (Ex-)Smoker | 0.80 (0.52-1.21) | 0.283 | 1.73 (0.93-3.23) | 0.086 |
| FVC (%) | 1.01 (1.00-1.03) | 0.181 | 1.00 (0.98-1.02) | 0.772 |
| FEV1 (L) | 0.99 (0.71-1.37) | 0.931 | 0.86 (0.57-1.31) | 0.487 |
| DLCO (%) | 1.00 (0.99-1.01) | 0.477 | 0.99 (0.97-1.00) | 0.083 |
| Clinical stage, III | 1.50 (1.17-1.93) | 0.002 | 1.56 (1.13-2.15) | 0.006 |
| Pathology, SqCC | 1.28 (0.92-1.76) | 0.141 | 0.86 (0.55-1.33) | 0.487 |
| EGFR, mutation | 1.30 (0.74-2.28) | 0.362 | 0.48 (0.18-1.26) | 0.137 |
| PD-L1 positive (> 1%) | 0.76 (0.48-1.20) | 0.242 | 0.71 (0.39-1.28) | 0.259 |
| Total RT dose, ≥ 66 Gy | 0.90 (0.61-1.31) | 0.582 | 1.04 (0.65-1.69) | 0.860 |
| Chemotherapy, TP | 0.68 (0.45-1.03) | 0.070 | 0.57 (0.35-0.95) | 0.032 |
| Use of durvalumab | 0.68 (0.47-1.00) | 0.050 | 0.53 (0.32-0.87) | 0.011 |
| Interval between CCRT and durvalumab, ≤ 42 daysa) | 0.62 (0.29-1.30) | 0.203 | 0.62 (0.23-1.71) | 0.359 |
CI, confidence interval; DLCO, diffusing capacity of the lung for CO; ECOG PS, Eastern Cooperative Oncology Group performance status; EGFR, epidermal growth factor receptor; FEV1, forced expiratory volume in one second; FVC, forced vital capacity; HR, hazard ratio; PD-L1, programmed cell death ligand 1; RT, radiotherapy; SqCC, squamous cell carcinoma; TP, paclitaxel/cisplatin.
4. Oncologic outcomes by PD-L1 expression
Table 4.
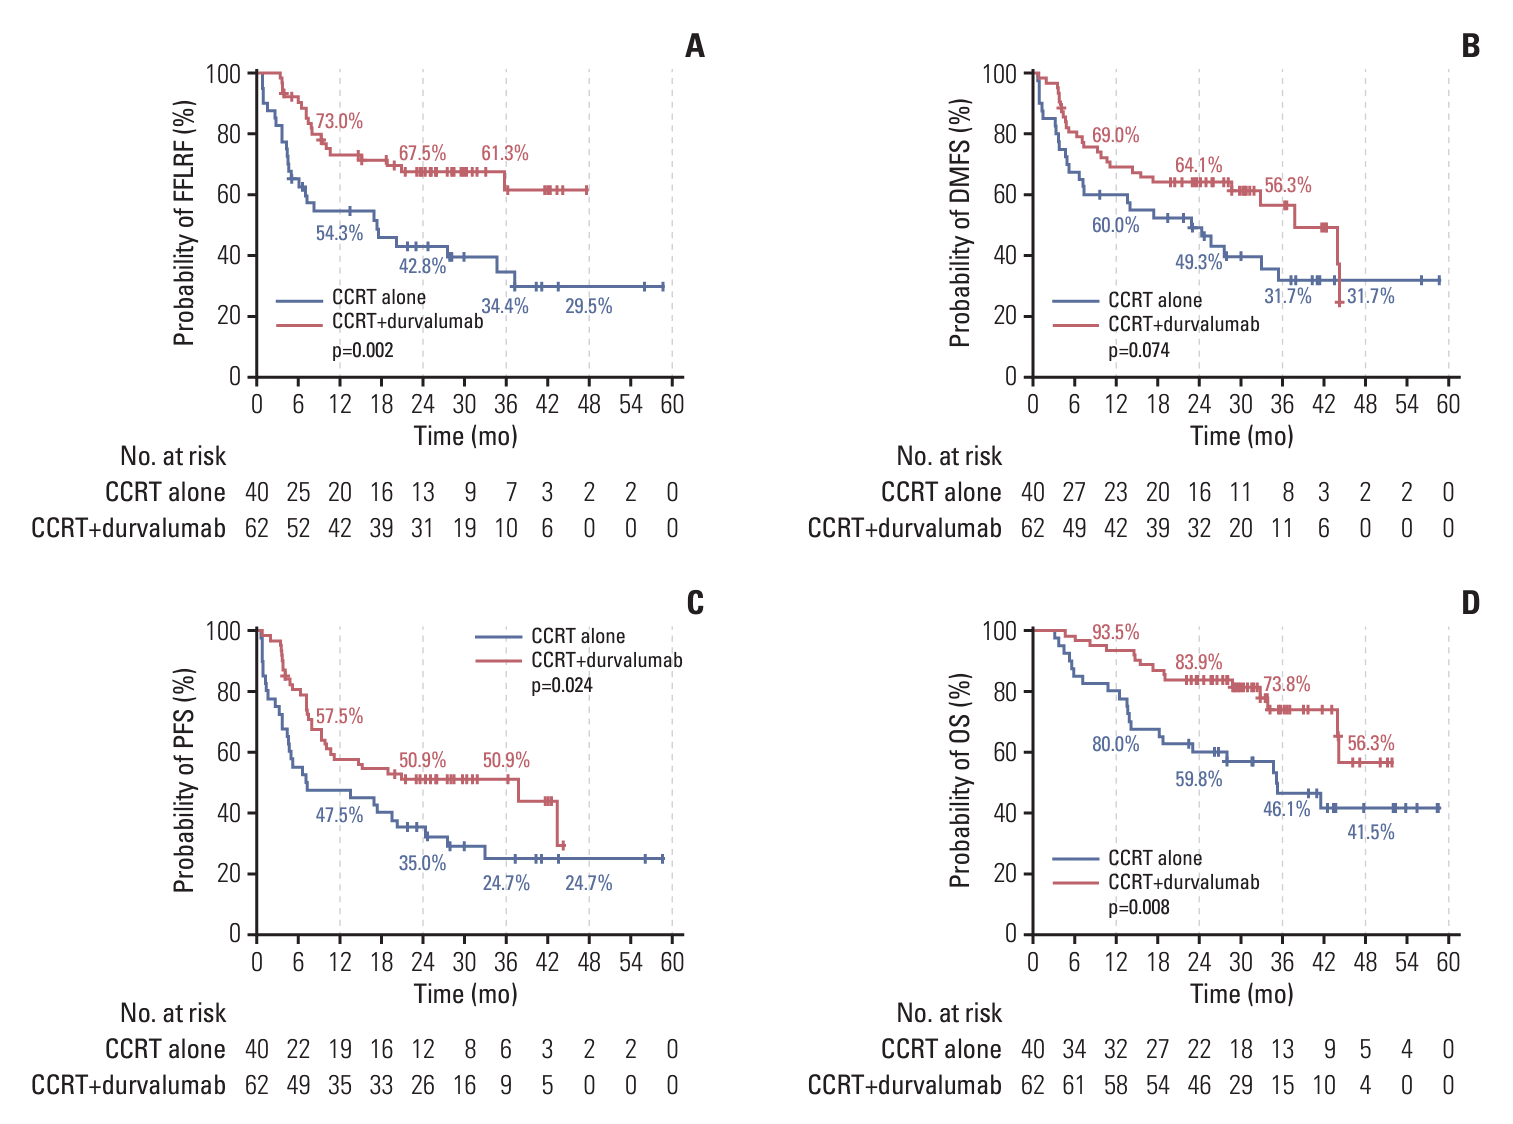
Fig. 2.


 PDF
PDF Citation
 Print
Print


 XML Download