

 PDF
PDF Citation
 Print
Print


INTRODUCTION
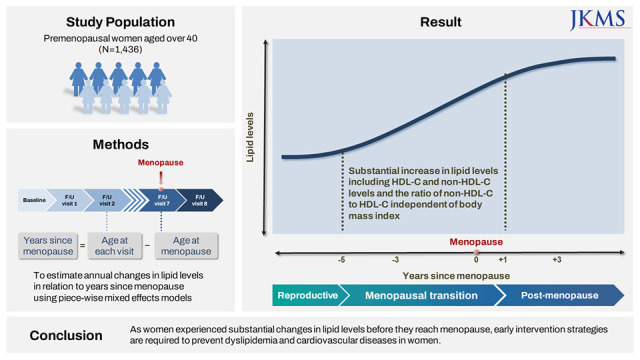
Cardiovascular diseases (CVDs) are the leading cause of death among women.1 Recently, mounting evidence has emphasized the importance of identifying women-specific risk factors, such as pregnancy and reproductive history, beyond sex differences in traditional CVD risk factors that men and women share.2 Menopausal transition (MT) is a unique period of time when women experience physiological changes, resulting in fertility loss,3 and considerable evidence suggest that it contributes to an increased CVD risk in middle-aged women, independent of chronological aging.4
Dyslipidemia is a major risk factor for CVDs. The number of Korean adults with dyslipidemia more than doubled from 2007 to 2018, and the prevalence of dyslipidemia in Korea has been higher than that in the United States since 2010.56 Although the prevalence of dyslipidemia increased with age in both men and women, a remarkable increase in the prevalence was shown in women aged 50–59 compared with women aged 40–49, and the prevalence in women aged 60 and over was higher than men in the same age group.5 Given that women experience natural menopause between late 40s and early 50s in general,7 reproductive aging is likely to be associated with blood lipid levels. Indeed, previous studies found adverse lipid changes occur as women approach menopause, leading to a greater CVD risk in postmenopausal women: total cholesterol (TC), low-density lipoprotein cholesterol (LDL-C), and apolipoprotein B (Apo B) levels increase through MT, which is associated with the risk of carotid plaques in the postmenopausal stage.8910
However, it remains unclear whether triglyceride (TG) and high-density lipoprotein cholesterol (HDL-C) levels are associated with reproductive aging. Higher TG levels have been observed in postmenopausal women,1112 but the longitudinal association between TG and menopausal status is still ambiguous.89 Additionally, although a meta-analysis of 66 cross-sectional studies showed a null association between HDL-C level and menopausal status,11 recent longitudinal studies suggest an overall increase in HDL-C level during MT.813 Despite the inconsistent results, few studies have examined longitudinal changes in HDL-C and TG levels over MT, and almost all analyses included Western populations. Furthermore, little is known about menopause-related changes in non-HDL-C levels and non-HDL-C to HDL-C ratio, although recent evidence suggests that these may be reliable markers to predict CVD risk in midlife women.1415
Therefore, the aim of the current study was to examine whether women experience changes in lipid profiles as they undergo MT using longitudinal data from the Korean Genome and Epidemiology Study (KoGES). In addition, we examined whether patterns of lipid changes differ according to body mass index (BMI) in the premenopausal stage.
METHODS
Study population
KoGES Ansan and Anseong is an ongoing community-based, prospective cohort to investigate the risk factors for cardiometabolic diseases in the Korean population. In total, 10,030 participants aged 40–69 years were recruited in 2001–2002 from two suburban cities in South Korea and followed up biannually. Written informed consent was obtained from all participants at each visit. Details of the study design and methods have been previously described.16
Among the 5,272 women in the baseline examination, 3,812 who reached menopause before the baseline visit or had less than two follow-up visits were excluded. The final visit in this analysis occurred in 2017–2018. We additionally excluded 22 women who underwent bilateral oophorectomy at any time point in the study up to the last follow-up visit and 2 women who reported taking lipid-lowering medication at baseline. Observations that occurred > 9 years before or > 11 years after menopause were excluded from the current analysis to avoid small cell counts. Overall, 1,436 women with a maximum of 10,778 observations were eligible for this analysis (Supplementary Fig. 1).
Measures
Self-reported chronological age, age at menopause, smoking status, alcohol use, chronic health conditions, medication use, and physical activity level were obtained from standardized interviews during clinical visits. Menopause status was defined as no bleeding for at least 12 months, and the timing relative to menopause was identified as years since menopause, which was determined by subtracting the age at menopause from the chronological age at each visit.17 Anthropometric and clinical measurements were performed using standardized protocols. Height and weight were measured at all visits, and BMI was calculated as kg/m2. Women were categorized according to premenopausal or baseline BMI as under- and normal-weight (< 23 kg/m2), overweight (23–24.9 kg/m2), and obese (≥ 25 kg/m2) based on the cutoff value for the diagnosis of obesity in Asian populations.18 At each examination, fasting blood samples (at least 8 hours of fasting) were collected. Serum concentrations of TC, TG, and HDL-C were evaluated using the Hitachi 7600 (Hitachi, Tokyo, Japan) or ADIVA 1650/1800 (Siemens, Tarrytown, NY, USA) assay. Conversion formulas were used to reduce the errors caused by using different measurement instruments. When it was reported to take lipid-lowering medication, TC measurement was adjusted (adjusted TC = measured TC/0.8) for the effects of the medication.19 Non-HDL-C levels were calculated by subtracting HDL-C levels from adjusted TC, and LDL-C levels were calculated using the Friedewald equation (LDL-C = adjusted TC − HDL-C − [TG ÷ 5]) for TG levels < 400 mg/dL.20
Statistical analyses
Inflection points or knots associated with change in lipid parameters were visually identified using nonparametric locally weighted scatterplot smoothing (LOESS) plots with a smoothing set at 0.50, and time segments relative to menopause were identified based on the inflection points. Next, piecewise linear mixed-effects models were used to estimate annual lipid changes in each LOESS-identified time segment and to compare the magnitudes of the annual changes between time segments. We tested the appropriateness of knot placement by including different time segments with alternate knots around the LOESS-identified inflection points in the models. The time segments were fixed based on the model performance. The final models were adjusted for age at menopause, antihypertensive medication use, diabetes mellitus status, and lifestyle factors (smoking status, alcohol use, and levels of physical activities). To visualize lipid trajectories, we calculated the annual means of each lipid parameter over the years since menopause in addition to the estimated values from the piecewise mixed-effects models. Because of missing information about the study covariates, a maximum of 238 observations were not included in the final multivariate models. The interaction between premenopausal BMI and time segments was added to the models to test whether annual lipid changes within each time segment differed according to BMI. For sensitivity analyses, we re-ran the final models after excluding women who reported lipid-lowering medication use during the study follow-up years and who reported having diabetes during the follow-up years. We also re-ran the final models after excluding all observations in which participants reported the use of hormone therapy. Rerunning the final model after excluding observations with hormone therapy resulted in similar findings (data not shown). All statistical analyses were performed using SAS Windows version 9.4 (SAS Institute, Cary, NC, USA).
RESULTS
Sample characteristics
The baseline characteristics of the study population are presented in Table 1. On average, the age at baseline was 44.25 (standard deviation [SD], 3.03 years), and the age at menopause was 50.80 (SD, 2.81 years). At baseline, 26.7% and 39.7% of the women were overweight and obese, respectively.
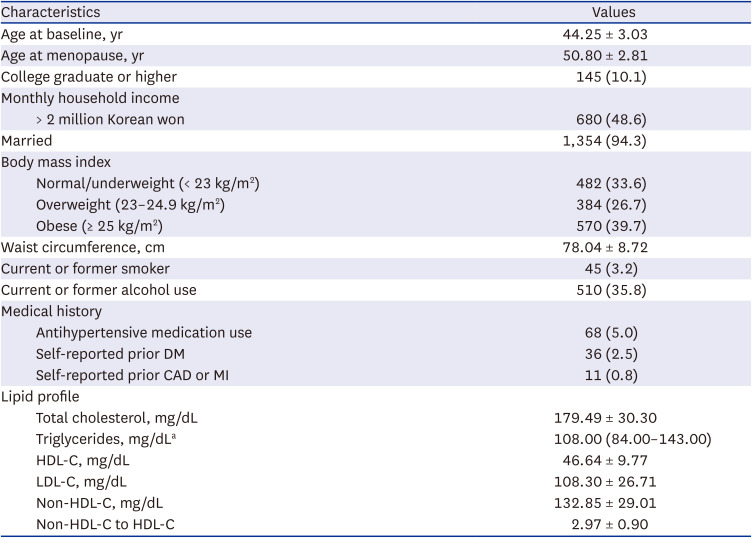
Table 1
Baseline characteristics of the analytic sample (N =1,436)
Values are presented as mean ± standard deviation or number (%).
DM = diabetes mellitus, CAD = coronary artery disease, MI = myocardial infarction, HDL-C = high-density lipoprotein-cholesterol, LDL-C = low-density lipoprotein-cholesterol.
aMedian (Q1, Q3).
![]()
Time segments relative to menopause
The predicted lipid changes relative to the years since menopause from the LOESS methods are shown in Fig. 1. Trajectories for TC, LDL-C, non-HDL-C, and non-HDL-C to HDL-C ratio were divided into four segments: > 5 years before menopause (segment 1), 5 years before to 1 year after menopause (segment 2), 1–3 years after menopause (segment 3), and > 3 years after menopause (segment 4). The trajectory for HDL-C was also divided into four segments, but the first inflection point was different: > 3 years before menopause (segment 1), 3 years before to 1 year after menopause (segment 2), 1–3 years after menopause (segment 3), and > 3 years after menopause (segment 4). The TG trajectory as divided into three time segments: > 5 years before menopause (segment 1), 5 years before to 1 year after menopause (segment 2), and > 1 year after menopause (segment 3).
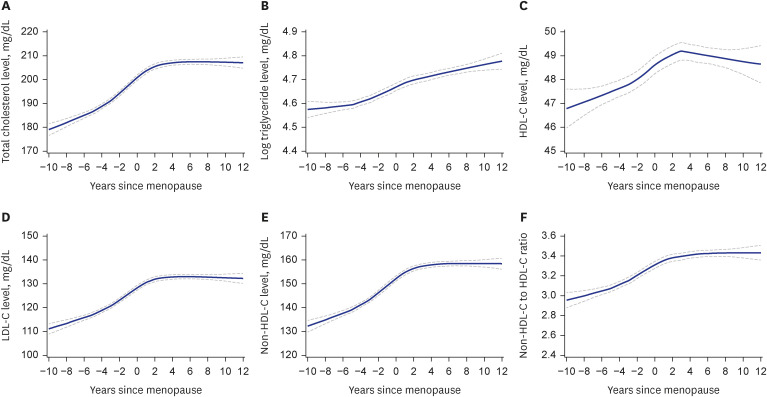
Fig. 1
LOESS estimated means of lipids across the follow-up period relative to years since menopause LOESS estimated values of (A) total cholesterol, (B) triglyceride, (C) HDL-C, (D) LDL-C, (E) non-HDL-C, and (F) non-HDL-C to HDL-C ratio over time since menopause at a smoothing of 0.50. Solid line presents the mean, and dashed lines present the 95% confidence intervals.
LOESS = locally weighted scatterplot smoothing, HDL-C = high-density lipoprotein cholesterol, LDL-C = low-density lipoprotein cholesterol.
![]()
Annual changes in lipid levels with respect to timing relative to menopause
The values of all lipid parameters significantly increased in segment 2, from 3 or 5 years before menopause to 1 year after menopause (Fig. 2, Table 2). In segment 2, TC, LDL-C, and non-HDL-C levels increased at 3.77 mg/dL (95% confidence interval [CI], 3.44 to 4.10 mg/dL), 2.95 mg/dL (95% CI, 2.64 to 3.25 mg/dL), and 3.42 mg/dL (95% CI, 3.11 to 3.72 mg/dL) per year, respectively. The increase in the values of these three lipid parameters in segment 2 was significantly greater than the annual changes in segments 1 and 3 (P < 0.001 for all). The HDL-C level increased at 0.42 mg/dL per year (95% CI, 0.29 to 0.55 mg/dL) in segment 2, and the rate of change was greater than the rates of segments 1 and 3 (P = 0.042 for segment 1 vs. 2 and P < 0.001 for segment 2 vs. 3). An annual change in the non-HDL-C to HDL-C ratio was 0.05 (95% CI, 0.04 to 0.06) in segment 2. The change in segment 2 was significantly greater than that in segment 1 (P < 0.001), but the difference between segments 2 and 3 was not statistically significant (P = 0.147). The greatest increase in the log-transformed TG level also occurred in segment 2, which was significantly greater than the changes in segments 1 and 3 (P < 0.001).
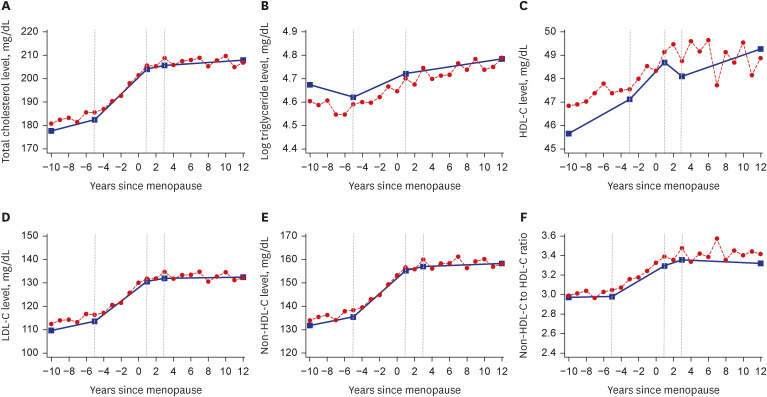
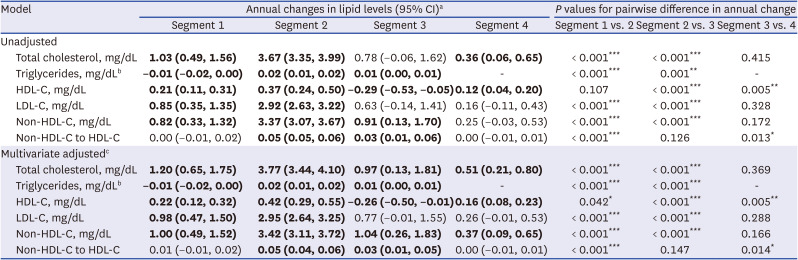
Fig. 2
Means of lipid values in years around menopause. Annual mean values compared with estimated values from piecewise linear mixed-effects models of (A) total cholesterol, (B) triglyceride, (C) HDL-C, (D) LDL-C, (E) non-HDL-C, and (F) non-HDL-C to HDL-C ratio over time since menopause.
HDL-C = high-density lipoprotein-cholesterol, LDL-C = low-density lipoprotein-cholesterol.
![]()
Table 2
Annual changes in lipid levels in relation to years since menopause (N = 1,436)
Bold text indicates that confidence intervals do not include zero.
CI = confidence interval, HDL-C = high-density lipoprotein-cholesterol, LDL-C = low-density lipoprotein-cholesterol.
*P < 0.05, **P < 0.01, ***P < 0.001.
aSegment 1, from baseline visit to 3 years before menopause for HDL-C and from baseline visit to 5 years before menopause for others; segment 2, from 3 years before to 1 year after menopause for HDL-C and from 5 years before to 1 year after menopause for others; segment 3, from 1 year after menopause to the last follow-up visit for triglycerides and from 1 to 3 years after menopause for others; and segment 4, from 3 years after menopause to the last follow-up visit
bLog-transformed value was used owing to skewness.
cAdjusted for age at menopause, antihypertensive medication use, history of diabetes mellitus, smoking status, alcohol use, and physical activity level.
![]()
TC, LDL-C, and non-HDL-C levels continued to increase in segments 3 and 4, although the rate of the changes slowed down compared with that in segment 2. Although the changes in the LDL-C level in segments 3 and 4 were insignificant in the total analytic sample, significant increases in the LDL-C level were shown in segments 3 and 4 after excluding women who reported lipid-lowering medication use during the follow-up period (Supplementary Fig. 2, Supplementary Table 1) and in segment 4 after excluding women having diabetes (Supplementary Fig. 3, Supplementary Table 2). The HDL-C level slightly declined in segment 3 (−0.26 mg/dL per year; 95% CI, −0.50 to −0.01 mg/dL) but rebounded in segment 4 (0.16 mg/dL per year; 95% CI, 0.08 to 0.23 mg/dL). The non-HDL-C to HDL-C ratio kept significantly increasing in segment 3, but not in segment 4, and the change in segment 4 was significantly smaller than that in segment 3 (P = 0.014). The log-transformed TG level steadily increased in segment 3 from 1 year after menopause to the end of the follow-up period.
Differences by premenopausal BMI
Regardless of premenopausal BMI, women experienced a substantial increase in the values of all lipid parameters in segment 2 from 3 or 5 years before menopause to 1 year after menopause (Fig. 3, Supplementary Table 3). There were no significant differences in annual lipid changes between under- and normal-weight women and overweight or obese women. Although under- and normal-weight women experienced overall increases in lipid levels in segment 1, the increases in lipid levels in segment 2 were significantly greater than those in segment 1, except for the HDL-C level.
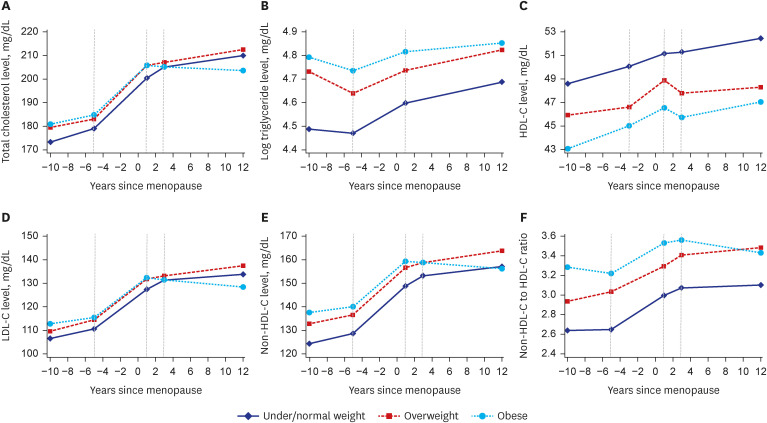
Fig. 3
Patterns of lipid changes according to premenopausal body mass index. Estimated values from piecewise linear mixed-effects models of (A) total cholesterol, (B) triglyceride, (C) HDL-C, (D) LDL-C, (E) non-HDL-C, and (F) non-HDL-C to HDL-C ratio over time since menopause by body mass index.
HDL-C = high-density lipoprotein-cholesterol, LDL-C = low-density lipoprotein-cholesterol.
![]()
In segment 3, the patterns of lipid changes significantly differed according to the premenopausal BMI: TC, LDL-C, and non-HDL-C levels steadily increased in under- and normal-weight women whereas the levels declined in obese women (P = 0.008 for TC, P = 0.017 for LDL-C, and P = 0.013 for non-HDL-C). However, among women who did not report lipid-lowering medication use during the follow-up period (Supplementary Fig. 4), TC and non-HDL-C levels increased even in obese women in segment 3 though the increases were not statistically significant (0.28 mg/dL per year for TC; 95% CI, −1.09 to 1.64 mg/dL and 0.55 mg/dL per year for non-HDL-C; 95% CI, −0.70 to 1.80 mg/dL), but the changes in TC, LDL-C, and non-HDL-C levels in obese women were still significantly smaller than those in under- and normal-weight women (P = 0.018 for TC, P = 0.011 for LDL-C, and P = 0.032 for non-HDL-C). Analyses restricted to women without diabetes resulted in similar conclusion (Supplementary Fig. 5), except for the fact that the rate of change in non-HDL-C level in obese women were not significantly different from that in under- and normal-weight women (P = 0.070). The HDL-C level decreased in overweight and obese women but increased in under- and normal-weight women, despite insignificant differences according to BMI (P = 0.054 for overweight women vs. under- and normal-weight women and P = 0.169 for obese women vs. under- and normal-weight women). In segment 4, there were no differences in annual lipid changes according to BMI, although the patterns of changes in segment 4 were similar to those in segment 3. Adjustment for weight change during the follow-up period did not influence the overall findings (data not shown).
DISCUSSION
The present study characterized lipid changes in relation to years since menopause and examined differences in the patterns of changes according to premenopausal BMI using a Korean community-based prospective cohort. We demonstrated a notable increase in lipid levels from 3 or 5 years before menopause to 1 year after menopause. A previous cross-sectional analysis of Korean women aged 44–56 years similarly reported an increase in the values of lipid parameters across menopausal stages, except for HDL-C level: substantial increases occurred between early and late MT for TC, LDL-C, non-HDL-C, and Apo B levels and between late MT and post-menopause for TG levels.12 Interestingly, increases in lipid levels during MT were observed even in under- and normal-weight women. Similar to our findings, previous evidence showed consistent results that women with no regard to their weight experienced an increase in atherogenic lipid levels, including TC, LDL-C, and Apo B levels, as they traversed menopause, and the increase during the MT was more evident in women with lower weight than in heavier women.21 Therefore, lipid changes should be regularly monitored in premenopausal women, regardless of their body weight. In Korea, national health screening services have been provided and women aged over 40 years can take blood lipid test at least once every 2 years.22 Although the participation rate of the services has been increasing, the rate in women aged 40–49 is constantly lower than the rate in women aged 50–59.23 Our findings that women experience a remarkable increase in lipid levels before they reach menopause suggests the importance of strategies to increase the participation rate of the services in women aged under 50, which can help reduce the risk of CVDs in women.24 Likewise, interventions to prevent dyslipidemia targeting young premenopausal women should be developed and implemented prior to MT although the prevalence of dyslipidemia in women aged under 50 was much lower than that in women aged over 50.
In the current analysis, a decline in TC, LDL-C, and non-HDL-C levels, although insignificant, was observed in the postmenopausal stage among obese women, whereas under- and normal-weight women experienced persistent increase in lipid levels. As the decline in TC and non-HDL-C levels was not observed after excluding women on lipid-lowering treatment or with diabetes, the decreasing trend was likely to be attributed to the effect of the medication. Nevertheless, the changes in obese women were still smaller than those in under- and normal-weight women in the early postmenopausal stage, even after excluding those who reported taking lipid-lowering medication or having diabetes. These findings are in line with previous evidence that the rate of changes in TC, LDL-C, and Apo B levels more than 1 year after menopause differed by body weight,9 and the elevated prevalence of high non-HDL-C and Apo B levels in the late MT and postmenopausal stage was pronounced in normal-weight women.12 These distinct patterns of postmenopausal lipid changes may have been contributed by changes in estrogen level during MT.21 Although still inconclusive, a decline in endogenous estrogen levels during MT is likely to be associated with adverse changes in several cardiometabolic risk factors.4 Obese women experience a slower decline in estrogen levels through MT; therefore, their postmenopausal estrogen levels are higher than those of non-obese women, whereas premenopausal estrogen levels are lower in obese women than in non-obese women.2526 The higher estrogen level in the postmenopausal stage may have a protective role in preventing an increase in the levels of atherogenic lipids in obese women. However, it remains unclear whether fewer adverse lipid changes in obese women are beneficial for cardiovascular health. In contrast to the prevailing belief that elevated cholesterol levels are associated with CVD risk, previous evidence has suggested inverse or null association between decreased blood cholesterol levels and cardiovascular health.82728 Further studies should evaluate whether postmenopausal lipid changes are associated with CVD risk and whether the associations differ according to premenopausal BMI.
There have been conflicting results regarding the changes in HDL-C levels over the MT. A number of cross-sectional analyses have indicated that the HDL-C level is not associated with menopausal status.1229 However, several longitudinal analyses reported an increase in HDL-C levels during MT despite differences in the detailed pattern.8913 Similarly, our study showed that HDL-C levels increased through MT up to 1 year after menopause, slightly decreased from 1 to 3 years after menopause, and increased thereafter. These findings are consistent with results from a recent analysis of 471 multi-ethnic women, showing an overall increase in HDL-C levels during the follow-up years, with a slight decline around menopause.13 However, in the current analysis, a temporal decrease in the early menopausal stage was observed in overweight and obese women. HDL-C levels continued to increase in under- and normal-weight women even after menopause, although the rate of the increase leveled off, and a previous longitudinal analysis with a shorter follow-up showed a similar pattern of change in HDL-C levels.9 Future large-scale studies are required to fully understand different patterns of HDL-C changes in the early menopausal stage according to BMI. Surprisingly, previous evidence suggests that elevated HDL-C levels have a null or even a negative effect on CVD risk in middle-aged women, but not in middle-aged men.3031 A plausible explanation for this opposite association is that the HDL-C level may not be an adequate marker to reflect changes in HDL composition and function during MT and to predict CVD risk in midlife women. HDL subclasses and contents adversely change HDL-C efflux capacity per particle decreases as women traverse menopause, despite overall increase in HDL-C levels during MT.13 Additionally, our study showed that non-HDL-C levels simultaneously increased with HDL-C increases during the follow-up years; thus, the non-HDL-C to HDL-C ratio increased throughout MT up to the early menopausal stage. Future studies should examine the comprehensive effects of changes in novel HDL parameters and the non-HDL-C to HDL-C ratio with respect to menopause on CVD risk in midlife women.
Recent evidence suggests that TG may be a risk factor for CVD independent of HDL-C, not a confounder, emphasizing the importance of examining TG changes during MT.32 However, it remains controversial whether changes in TG levels are relevant to MT independent of chronological aging.892133 In the current analysis, TG levels steadily increased from 5 years before menopause to the end of the follow-up visit despite significant decline in the rate of change after menopause, which is similar with previous findings from cross-sectional study in a Korean population: TG level increased with age in women though the change slowed down in women aged 60 and over, while men experienced a constant increase in TG level by the age of 54 and thereafter, the TG level decreased.34 Inconsistently, previous longitudinal analyses have revealed that TG levels increased through MT but flattened or declined in the postmenopausal stage.821 These incongruent patterns of postmenopausal changes in TG levels may result from differences in the duration of follow-up, since an increase in TG levels occurs in the later phase of MT unlike changes in other lipid parameters during MT.1221 Another possibility of the different patterns of TG change is associated with racial/ethnic differences, given that the prevalence of hypertriglyceridemia is higher in Asian women.35
The present study has some limitations. First, repeated measurements of reproductive hormones and novel lipid metrics, such as HDL subclasses and function, were not available for the current analysis. Second, we measured lipid levels only after the age of 40 years. Future studies should examine lipid values at younger ages, which may be useful in deciding the timing of lifestyle interventions to prevent increases in lipid levels in midlife women. Third, the current analysis included menopausal status as a binary variable because menopausal stages based on menstrual cycles and bleeding patterns were examined only in later follow-up years. Future studies should consider detailed menopausal stages based on the regularity of menstrual cycles and bleeding patterns, as the onset age and duration of MT might influence changes in lipid levels during MT.36 In addition, medical history including medications was self-reported and not verified from other sources like medical report or prescription. Finally, our study population comprised relatively healthy middle-aged Korean women. Therefore, differences in race/ethnicity and health status should be considered when generalizing our findings to other populations. Despite these limitations, to the best of our knowledge, this is the first study to document changes in non-HDL-C levels and non-HDL-C to HDL-C ratio with years since menopause. Additionally, this study included a large number of observations with sufficient follow-up measurements of lipids and controlled for multiple potential covariates associated with lipid changes during MT.
In summary, the present study suggests that women experience substantial increases in lipid levels during MT, even when they are not obese before menopause, although patterns of the postmenopausal lipid changes differ by their premenopausal BMI. Restricted to Korean middle-aged women who have a natural menopause, these findings highlight the importance of early prevention strategies to prevent increases in lipid levels and reduce CVD risk in women. Further studies are required to examine the association between postmenopausal changes in lipid levels and CVD risk in obese women.
 XML Download