INTRODUCTION
METHODS
1. Study Design
2. Participants
3. Outcome Measures and Assessments
4. Statistical Analyses
RESULTS
1. Patient Disposition and Baseline Characteristics
Table 1.
| Characteristics |
Induction study A: biologic-naïve patients |
Induction study B: biologic-experienced patients |
||||
|---|---|---|---|---|---|---|
| Placebo (n=6) | Filgotinib 100 mg (n=16) | Filgotinib 200 mg (n=15) | Placebo (n=14) | Filgotinib 100 mg (n=29) | Filgotinib 200 mg (n=29) | |
| Age (yr), mean ± SD | 48 ± 11 | 48 ± 13 | 52 ± 12 | 49 ± 16 | 39 ± 14 | 45 ± 17 |
| Female sex | 0 | 5 (31.3) | 8 (53.3) | 6 (42.9) | 6 (20.7) | 10 (34.5) |
| Body weight (kg), median (Q1–Q3) | 61.7 (60.0–64.4) | 60.3 (57.0–70.7) | 62.2 (52.0–64.2) | 58.0 (47.5–63.5) | 59.2 (56.6–67.5) | 56.7 (51.8–65.0) |
| BMI (kg/m2), median (Q1–Q3) | 20.6 (20.2–21.9) | 21.7 (20.3–23.6) | 21.8 (20.4–23.3) | 21.2 (19.7–23.2) | 20.6 (18.5–23.9) | 21.5 (20.3–22.9) |
| Smoking status | ||||||
| Former | 3 (50.0) | 9 (56.3) | 8 (53.3) | 7 (50.0) | 12 (41.4) | 10 (34.5) |
| Current | 0 | 2 (12.5) | 1 (6.7) | 0 | 4 (13.8) | 1 (3.4) |
| Never | 3 (50.0) | 5 (31.3) | 6 (40.0) | 7 (50.0) | 13 (44.8) | 18 (62.1) |
| Duration of UC (yr), mean ± SD | 11.8 ± 14.0 | 8.2 ± 9.5 | 7.2 ± 6.8 | 9.5 ± 8.3 | 9.4 ± 7.4 | 9.2 ± 7.7 |
| Total Mayo Clinic score, mean ± SD | 8.7 ± 2.1 | 8.0 ± 1.3 | 8.5 ± 1.1 | 8.9 ± 1.4 | 9.2 ± 1.0 | 8.5 ± 1.4 |
| MES of 3 | 5 (83.3) | 9 (56.3) | 10 (66.7) | 13 (92.9) | 23 (79.3) | 25 (86.2) |
| C-reactive protein (mg/L), mean ± SD | 6.2 ± 10.1 | 4.1 ± 6.7 | 4.1 ± 5.1 | 3.4 ± 4.3 | 6.9 ± 10.8 | 7.0 ± 11.4 |
| Fecal calprotectin (μg/g), mean ± SD | 6,670 ± 8,295 | 1,995 ± 1,448 | 3,556 ± 3,348 | 1,685 ± 1,332 | 1,399 ± 1,218 | 2,352 ± 2,484 |
| Concomitant use of systemic corticosteroidsa | 2 (33.3) | 4 (25.0) | 6 (40.0) | 4 (28.6) | 5 (17.2) | 6 (20.7) |
| Concomitant use of immunosuppressantsa,b | 2 (33.3) | 6 (37.5) | 4 (26.7) | 3 (21.4) | 7 (24.1) | 7 (24.1) |
| Concomitant use of systemic corticosteroids and immunosuppressants | 1 (16.7) | 2 (12.5) | 1 (6.7) | 2 (14.3) | 5 (17.2) | 5 (17.2) |
| Prednisone-equivalent dose (mg/day), median (Q1–Q3) | 5.0 (2.5–10.0) | 10.0 (10.0–20.0) | 5.0 (2.5–10.0) | 5.0 (5.0–10.0) | 7.5 (5.0–20.0) | 10.0 (5.0–15.0) |
| Concomitant use of 5-ASA | 5 (83.3) | 13 (81.3) | 12 (80.0) | 11 (78.6) | 26 (89.7) | 24 (82.8) |
| Number of prior biologic agents used | ||||||
| 0 | 6 (100.0) | 16 (100.0) | 15 (100.0) | 0 | 0 | 0 |
| 1 | 0 | 0 | 0 | 7 (50.0) | 13 (44.8) | 13 (44.8) |
| 2 | 0 | 0 | 0 | 4 (28.6) | 15 (51.7) | 10 (34.5) |
| ≥3 | 0 | 0 | 0 | 3 (21.4) | 1 (3.4) | 6 (20.7) |
| Prior use of at least 1 TNF antagonist | 0 | 0 | 0 | 13 (92.9) | 28 (96.6) | 29 (100.0) |
| Prior use of vedolizumab | 0 | 0 | 0 | 4 (28.6) | 5 (17.2) | 3 (10.3) |
| Prior use of at least 1 TNF antagonist and vedolizumab | 0 | 0 | 0 | 3 (21.4) | 4 (13.8) | 3 (10.3) |
| Prior failure of at least 1 TNF antagonist | 0 | 0 | 0 | 13 (92.9) | 25 (86.2) | 25 (86.2) |
| Prior failure of vedolizumab | 0 | 0 | 0 | 1 (7.1) | 2 (6.9) | 1 (3.4) |
2. Efficacy
1) Primary Endpoint in SELECTION
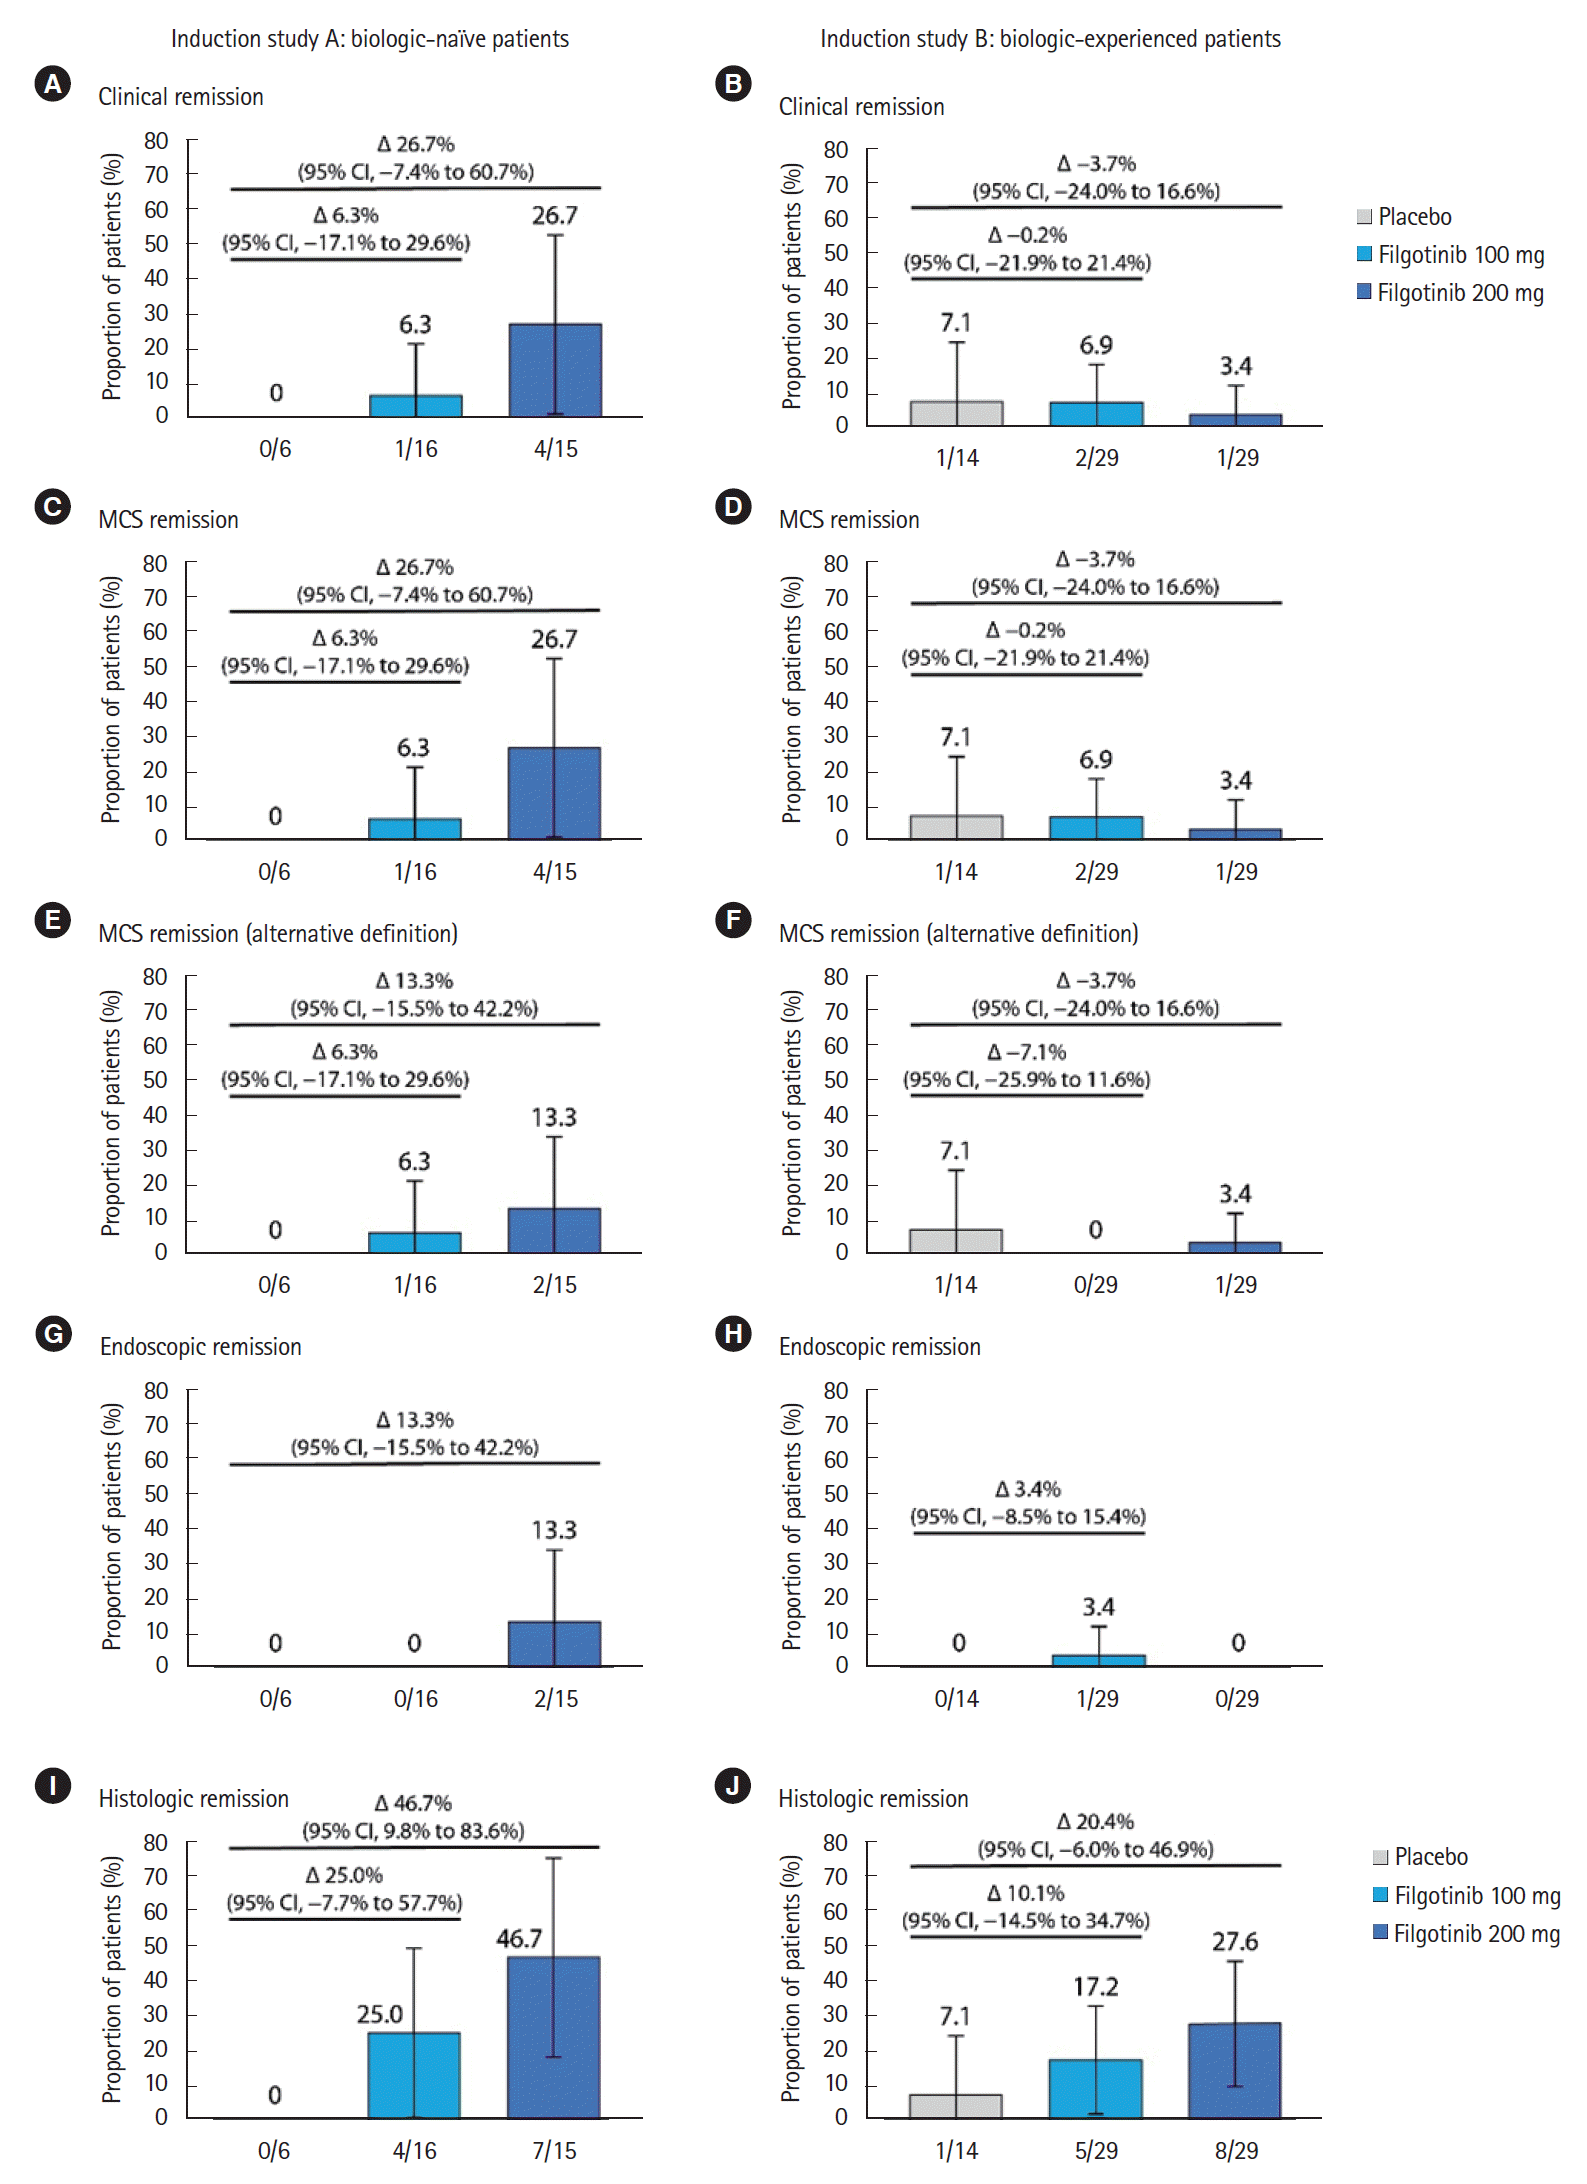
Fig. 1.

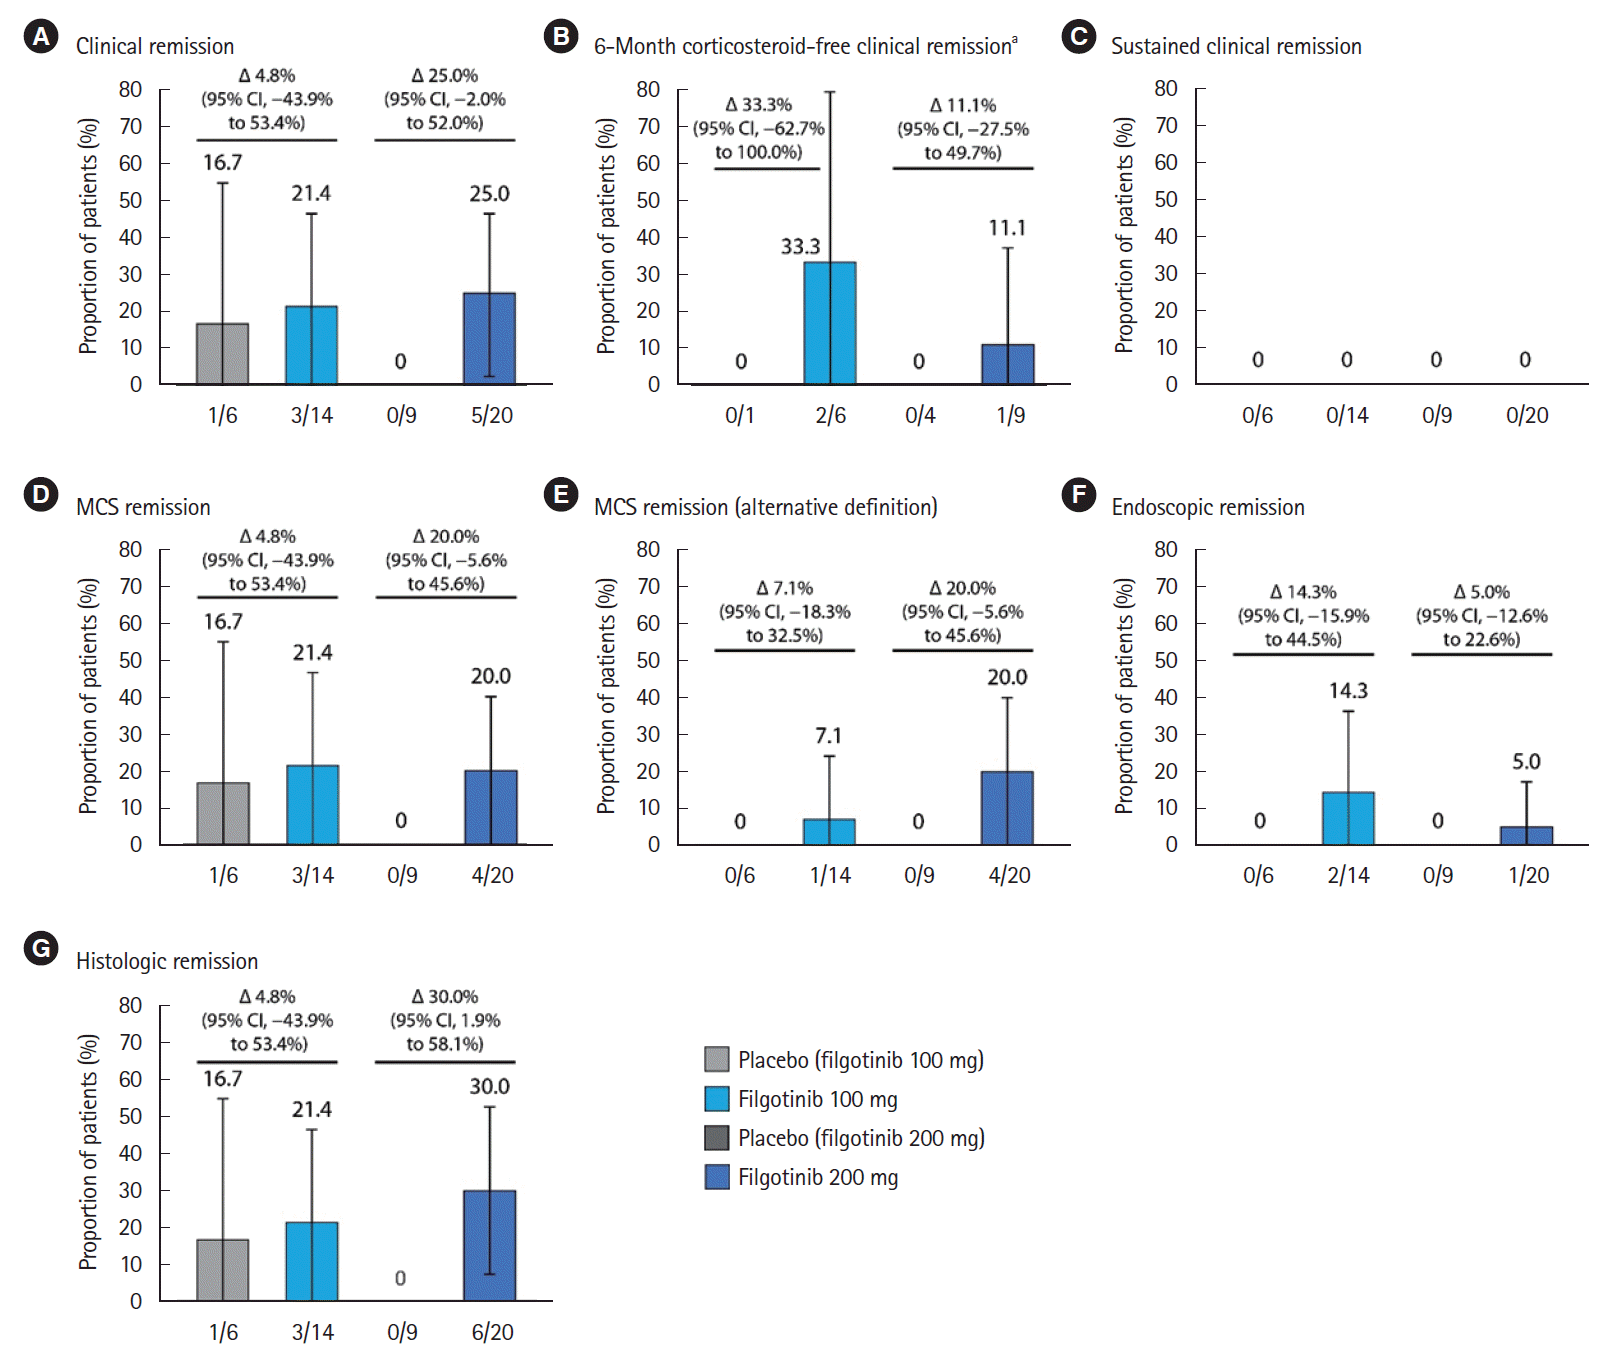
Fig. 2.

2) Key Secondary Endpoints in SELECTION
3) Exploratory Endpoints in SELECTION
4) Symptomatic Remission
3. Safety
Table 2.
| Outcomes | Placebo (n = 20) | Filgotinib 100 mg (n = 45) | Filgotinib 200 mg (n = 44) | ||
|---|---|---|---|---|---|
| Treatment-emergent AEs, No. (%) | |||||
| AEs | 11 (55.0) | 23 (51.1) | 24 (54.5) | ||
| Serious AEs | 3 (15.0) | 2 (4.4) | 1 (2.3) | ||
| AEs leading to study drug discontinuation | 3 (15.0) | 1 (2.2) | 1 (2.3) | ||
| Deaths | 0 | 0 | 0 | ||
| AEs of interest, No. (%) | |||||
| Infections | 3 (15.0) | 7 (15.6) | 8 (18.2) | ||
| Serious infections | 0 | 0 | 0 | ||
| Herpes zoster | 0 | 0 | 1 (2.3)a | ||
| Opportunistic infections | 0 | 0 | 0 | ||
| Malignancies excluding non-melanoma skin cancers | 0 | 1 (2.2)b | 0 | ||
| Non-melanoma skin cancers | 0 | 0 | 0 | ||
| Gastrointestinal perforation | 0 | 0 | 0 | ||
| Venous thrombosis excluding pulmonary embolism | 0 | 0 | 0 | ||
| Pulmonary embolism | 0 | 0 | 0 | ||
| Arterial thrombosis | 0 | 0 | 0 | ||
| Cerebrovascular events | 0 | 0 | 0 | ||
| Grade 3–4 laboratory abnormalities, No. (%) | |||||
| Hematology | |||||
| Decreased hemoglobin | 1 (5.0) | 1 (2.2) | 1 (2.3) | ||
| Decreased WBC | 0 | 0 | 0 | ||
| Decreased neutrophils | 0 | 0 | 0 | ||
| Decreased lymphocytes | 0 | 2 (4.4) | 0 | ||
| Chemistry | |||||
| Increased AST | 0 | 0 | 0 | ||
| Increased ALT | 0 | 0 | 0 | ||
| Increased creatine kinase | 0 | 0 | 0 | ||
| Decreased phosphorus | 0 | 0 | 2 (4.5) | ||
| Fasting HDL/LDL cholesterol value change from baseline at week 10, mean ± SD | |||||
| LDL cholesterol (mg/dL) | 10 ± 22 | 12 ± 23 | 18 ± 30 | ||
| HDL cholesterol (mg/dL) | 4 ± 17 | 15 ± 15 | 23 ± 18 | ||
| LDL:HDL ratio | 0.1 ± 0.4 | −0.2 ± 0.3 | −0.3 ± 0.4 | ||
Table 3.
| Outcomes | Placebo (n=5)a | Placebo (n=6)b | Filgotinib 100 mg (n=14)c | Placebo (n=9)d | Filgotinib 200 mg (n=20)e | ||
|---|---|---|---|---|---|---|---|
| AEs, No. (%) | |||||||
| AEs | 5 (100.0) | 4 (66.7) | 10 (71.4) | 7 (77.8) | 16 (80.0) | ||
| Serious AEs | 0 | 1 (16.7) | 1 (7.1) | 0 | 1 (5.0) | ||
| AEs leading to study drug discontinuation | 0 | 0 | 2 (14.3) | 0 | 0 | ||
| Deaths | 0 | 0 | 0 | 0 | 0 | ||
| AEs of interest, No. (%) | |||||||
| Infections | 4 (80.0) | 2 (33.3) | 6 (42.9) | 3 (33.3) | 10 (50.0) | ||
| Serious infections | 0 | 0 | 0 | 0 | 0 | ||
| Herpes zoster | 0 | 0 | 0 | 0 | 1 (5.0)f | ||
| Opportunistic infections | 0 | 0 | 0 | 0 | 0 | ||
| Malignancies excluding non-melanoma skin cancers | 0 | 0 | 1 (7.1)g | 0 | 0 | ||
| Non-melanoma skin cancers | 0 | 0 | 0 | 0 | 0 | ||
| Gastrointestinal perforation | 0 | 0 | 0 | 0 | 0 | ||
| Venous thrombosis excluding pulmonary embolism | 0 | 0 | 0 | 0 | 0 | ||
| Pulmonary embolism | 0 | 0 | 0 | 0 | 0 | ||
| Arterial thrombosis | 0 | 0 | 0 | 0 | 0 | ||
| Cerebrovascular events | 0 | 0 | 0 | 0 | 0 | ||
| Grade 3–4 laboratory abnormalities, No. (%) | |||||||
| Hematology | |||||||
| Decreased hemoglobin | 0 | 0 | 0 | 0 | 0 | ||
| Decreased WBC | 0 | 0 | 0 | 0 | 0 | ||
| Decreased neutrophils | 0 | 0 | 0 | 0 | 0 | ||
| Decreased lymphocytes | 0 | 1 (16.7) | 0 | 0 | 2 (10.0) | ||
| Chemistry | |||||||
| Increased AST | 0 | 0 | 0 | 0 | 0 | ||
| Increased ALT | 0 | 0 | 0 | 0 | 0 | ||
| Increased creatine kinase | 0 | 0 | 0 | 0 | 0 | ||
| Decreased phosphorus | 0 | 0 | 0 | 0 | 0 | ||
| Fasting HDL/LDL cholesterol value change from baseline at week 58, mean ± SD | |||||||
| Number | 2 | 3 | 8 | 1 | 14 | ||
| LDL cholesterol, mg/dL | −12 ± 23 | 1 ± 41 | 16 ± 23 | 18 | 1 ± 31 | ||
| HDL cholesterol, mg/dL | −19 ± 26 | −11 ± 15 | 4 ± 8 | −14 | −8 ± 19 | ||
| LDL:HDL ratio | 0.2 ± 0.2 | 0.2 ± 0.3 | 0.1 ± 0.4 | 0.9 | 0.2 ± 0.4 | ||
a Patients who responded with placebo in the induction studies and continued to receive placebo in the maintenance study.
b Patients who responded with filgotinib 100 mg in the induction studies and were randomly assigned to placebo in the maintenance study.
c Patients who responded with filgotinib 100 mg in the induction studies and were randomly assigned to filgotinib 100 mg in the maintenance study.
d Patients who responded with filgotinib 200 mg in the induction studies and were randomly assigned to placebo in the maintenance study.
e Patients who responded with filgotinib 200 mg in the induction studies and were randomly assigned to filgotinib 200 mg in the maintenance study.


 PDF
PDF Citation
 Print
Print


 XML Download