Introduction
Materials and Methods
1. Study subjects
2. Follow-up after endoscopic resection
3. H. pylori testing and histologic assessment
4. Operative link on gastritis assessment and operative link on gastric intestinal metaplasia assessment staging
5. DNA extraction, bisulfite modification, and MethyLight assay
6. Statistical analysis
Results
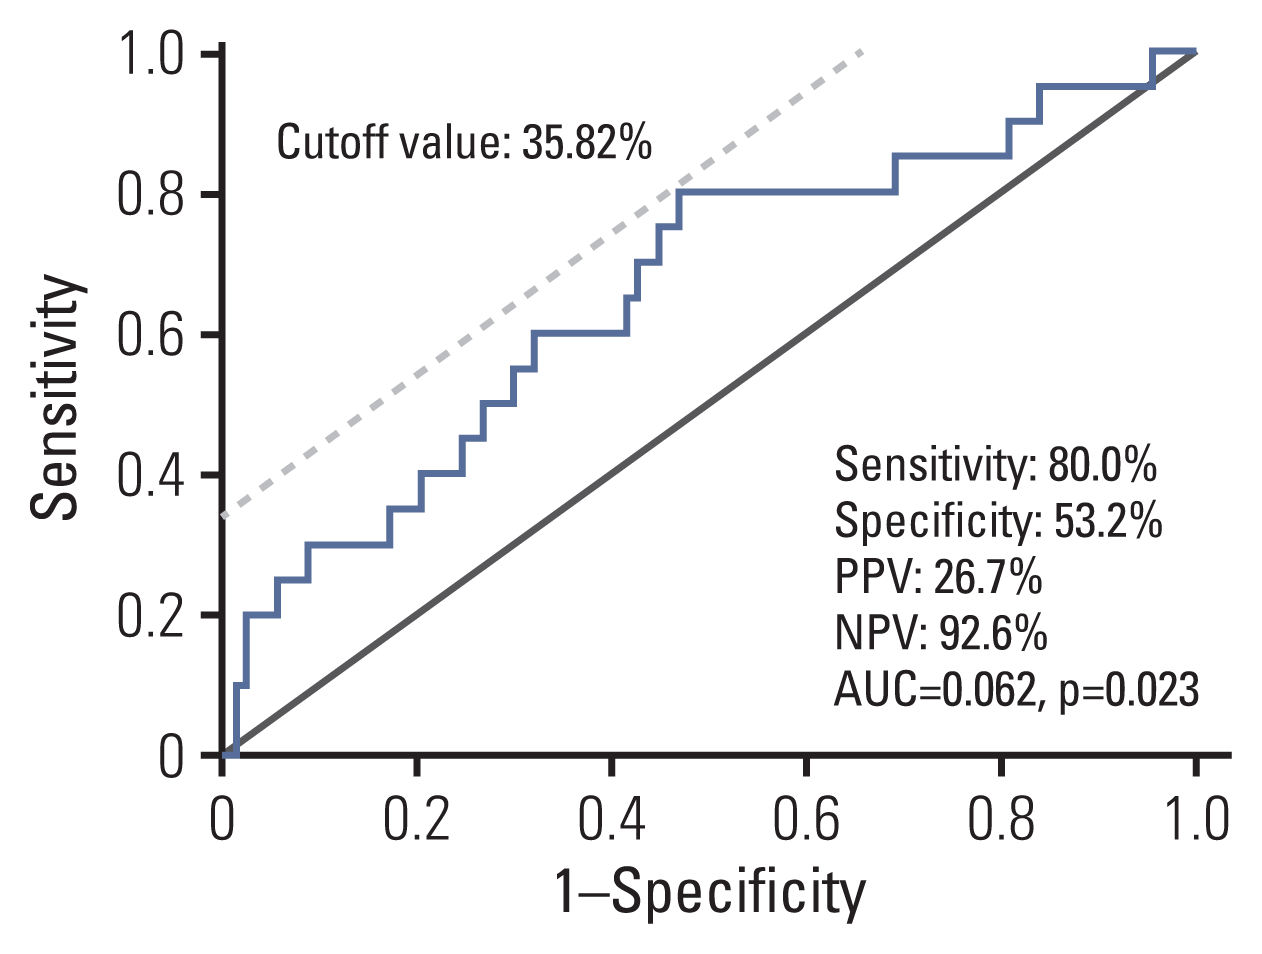
1. Optimal cutoff value of MOS methylation level to predict metachronous recurrence
Fig. 1

2. Characteristics of the study subjects at baseline
Table 1
| Variable | Total (n=294) | MOS methylation level (n=261) | p-value | |
|---|---|---|---|---|
| Low (n=99) | High (n=162) | |||
| Age (yr) | 63.2±8.7 | 62.4±9.1 | 64.1±8.6 | 0.132 |
| Male sex | 200 (68.0) | 68 (68.7) | 108 (66.7) | 0.735 |
| Follow-up duration (day) | 998.1±670.1 | 1,250.5±712.4 | 837.4±589.8 | < 0.001 |
| No. of endoscopic follow-up | 3.6±2.4 | 4.4±2.7 | 3.1±2.1 | < 0.001 |
| Helicobacter pylori positive | 110 (37.4) | 33 (33.3) | 63 (38.9) | 0.366 |
| Current or ex-smoker | 127 (43.2) | 57 (47.9) | 62 (52.1) | 0.572 |
| Current or ex-drinker | 158 (53.7) | 70 (48.3) | 75 (51.7) | 0.787 |
| Family history of GC in 1° relatives | 49 (17.4) | 20 (20.6) | 25 (16.2) | 0.378 |
| Body mass index (kg/m2) | 24.4±3.2 | 24.3±3.5 | 24.4±3.0 | 0.678 |
| Education | ||||
| Elementary-Middle-High | 149 (65.6) | 62 (72.1) | 79 (64.2) | 0.232 |
| University | 78 (34.4) | 24 (27.9) | 55 (35.8) | |
| Pathology | ||||
| Low-grade dysplasia | 147 (50.0) | 44(44.9) | 77 (48.7) | 0.662 |
| High-grade dysplasia | 24 (8.2) | 7 (7.1) | 14 (8.9) | |
| Adenocarcinoma | 123 (41.8) | 47 (48.0) | 67 (42.4) | |
| OLGA stage | ||||
| Stage 0 | 26 (22.4) | 11 (28.2) | 13 (18.3) | 0.760 |
| Stage 1 | 28 (24.1) | 8 (20.5) | 18 (25.4) | |
| Stage 2 | 28 (24.1) | 8 (20.5) | 19 (26.8) | |
| Stage 3 | 22 (19.0) | 8 (20.5) | 13 (18.3) | |
| Stage 4 | 12 (10.3) | 4 (10.3) | 8 (11.8) | |
| OLGIM stage | ||||
| Stage 0 | 51 (17.3) | 21 (21.6) | 25 (16.0) | 0.430 |
| Stage 1 | 59 (20.1) | 16 (16.5) | 35 (22.4) | |
| Stage 2 | 87 (29.6) | 34 (35.1) | 44 (28.2) | |
| Stage 3 | 52 (17.7) | 15 (15.5) | 30 (19.2) | |
| Stage 4 | 35 (11.9) | 11 (11.3) | 22 (14.1) | |
| Synchronous EGCs/dysplasiaa) | 25 (10.2) | 8 (8.7) | 16 (10.9) | |
Values are presented as mean±SD or number (%). p-values were calculated using chi-square test or Student’s t test. The cutoff value (35.82%) of high or low MOS methylation levels was determined by receiver operating curve analysis. Statistically significant at p < 0.001. EGC, early gastric cancer; GC, gastric cancer; OLGA, operative link on gastritis assessment; OLGIM, operative link on gastric intestinal metaplasia assessment; SD, standard deviation.
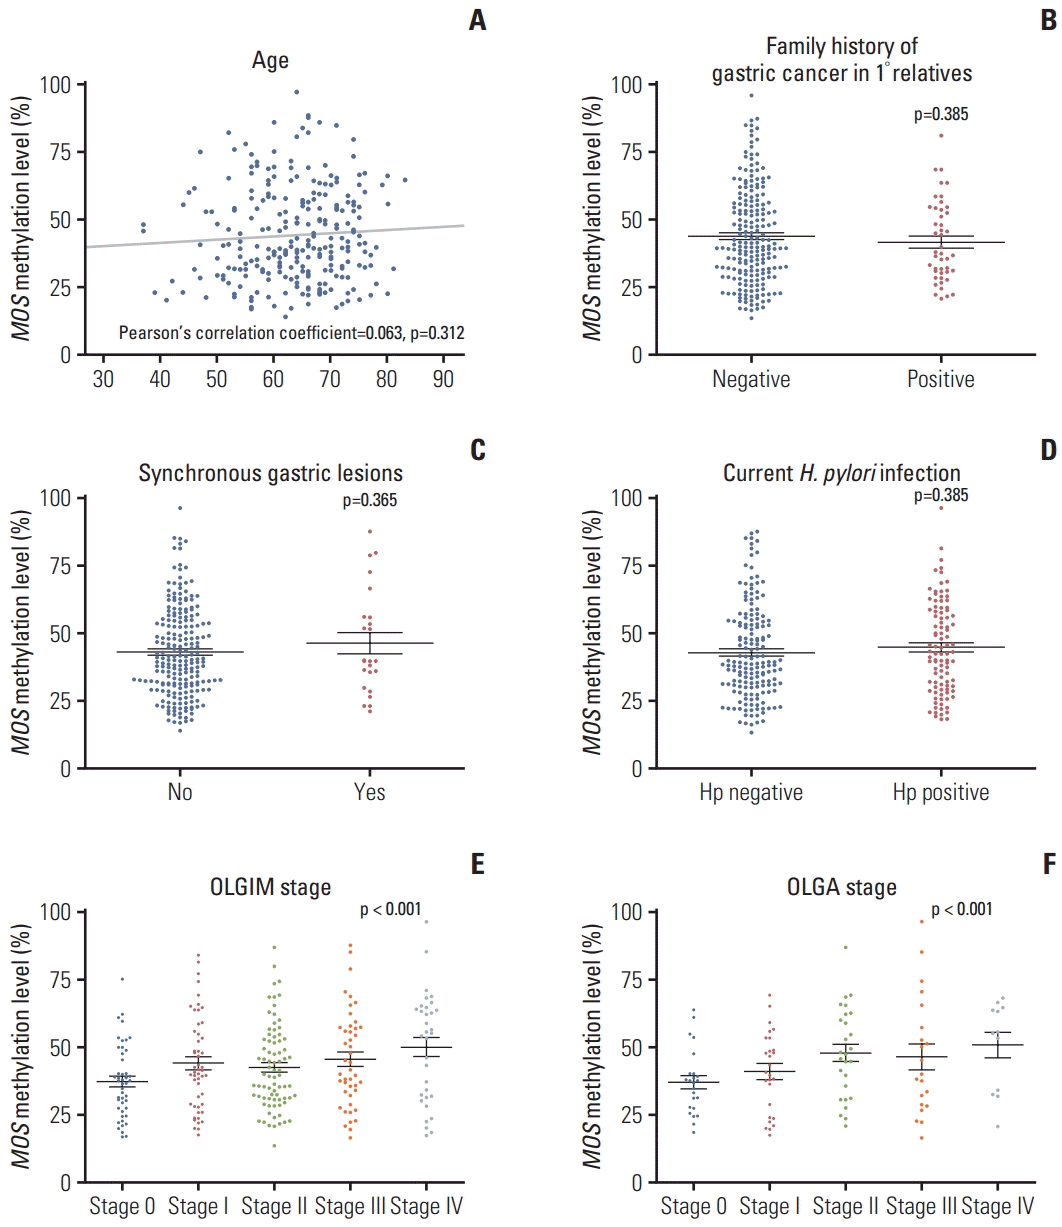
3. Association between MOS methylation level and clinical and histologic variables
Fig. 2

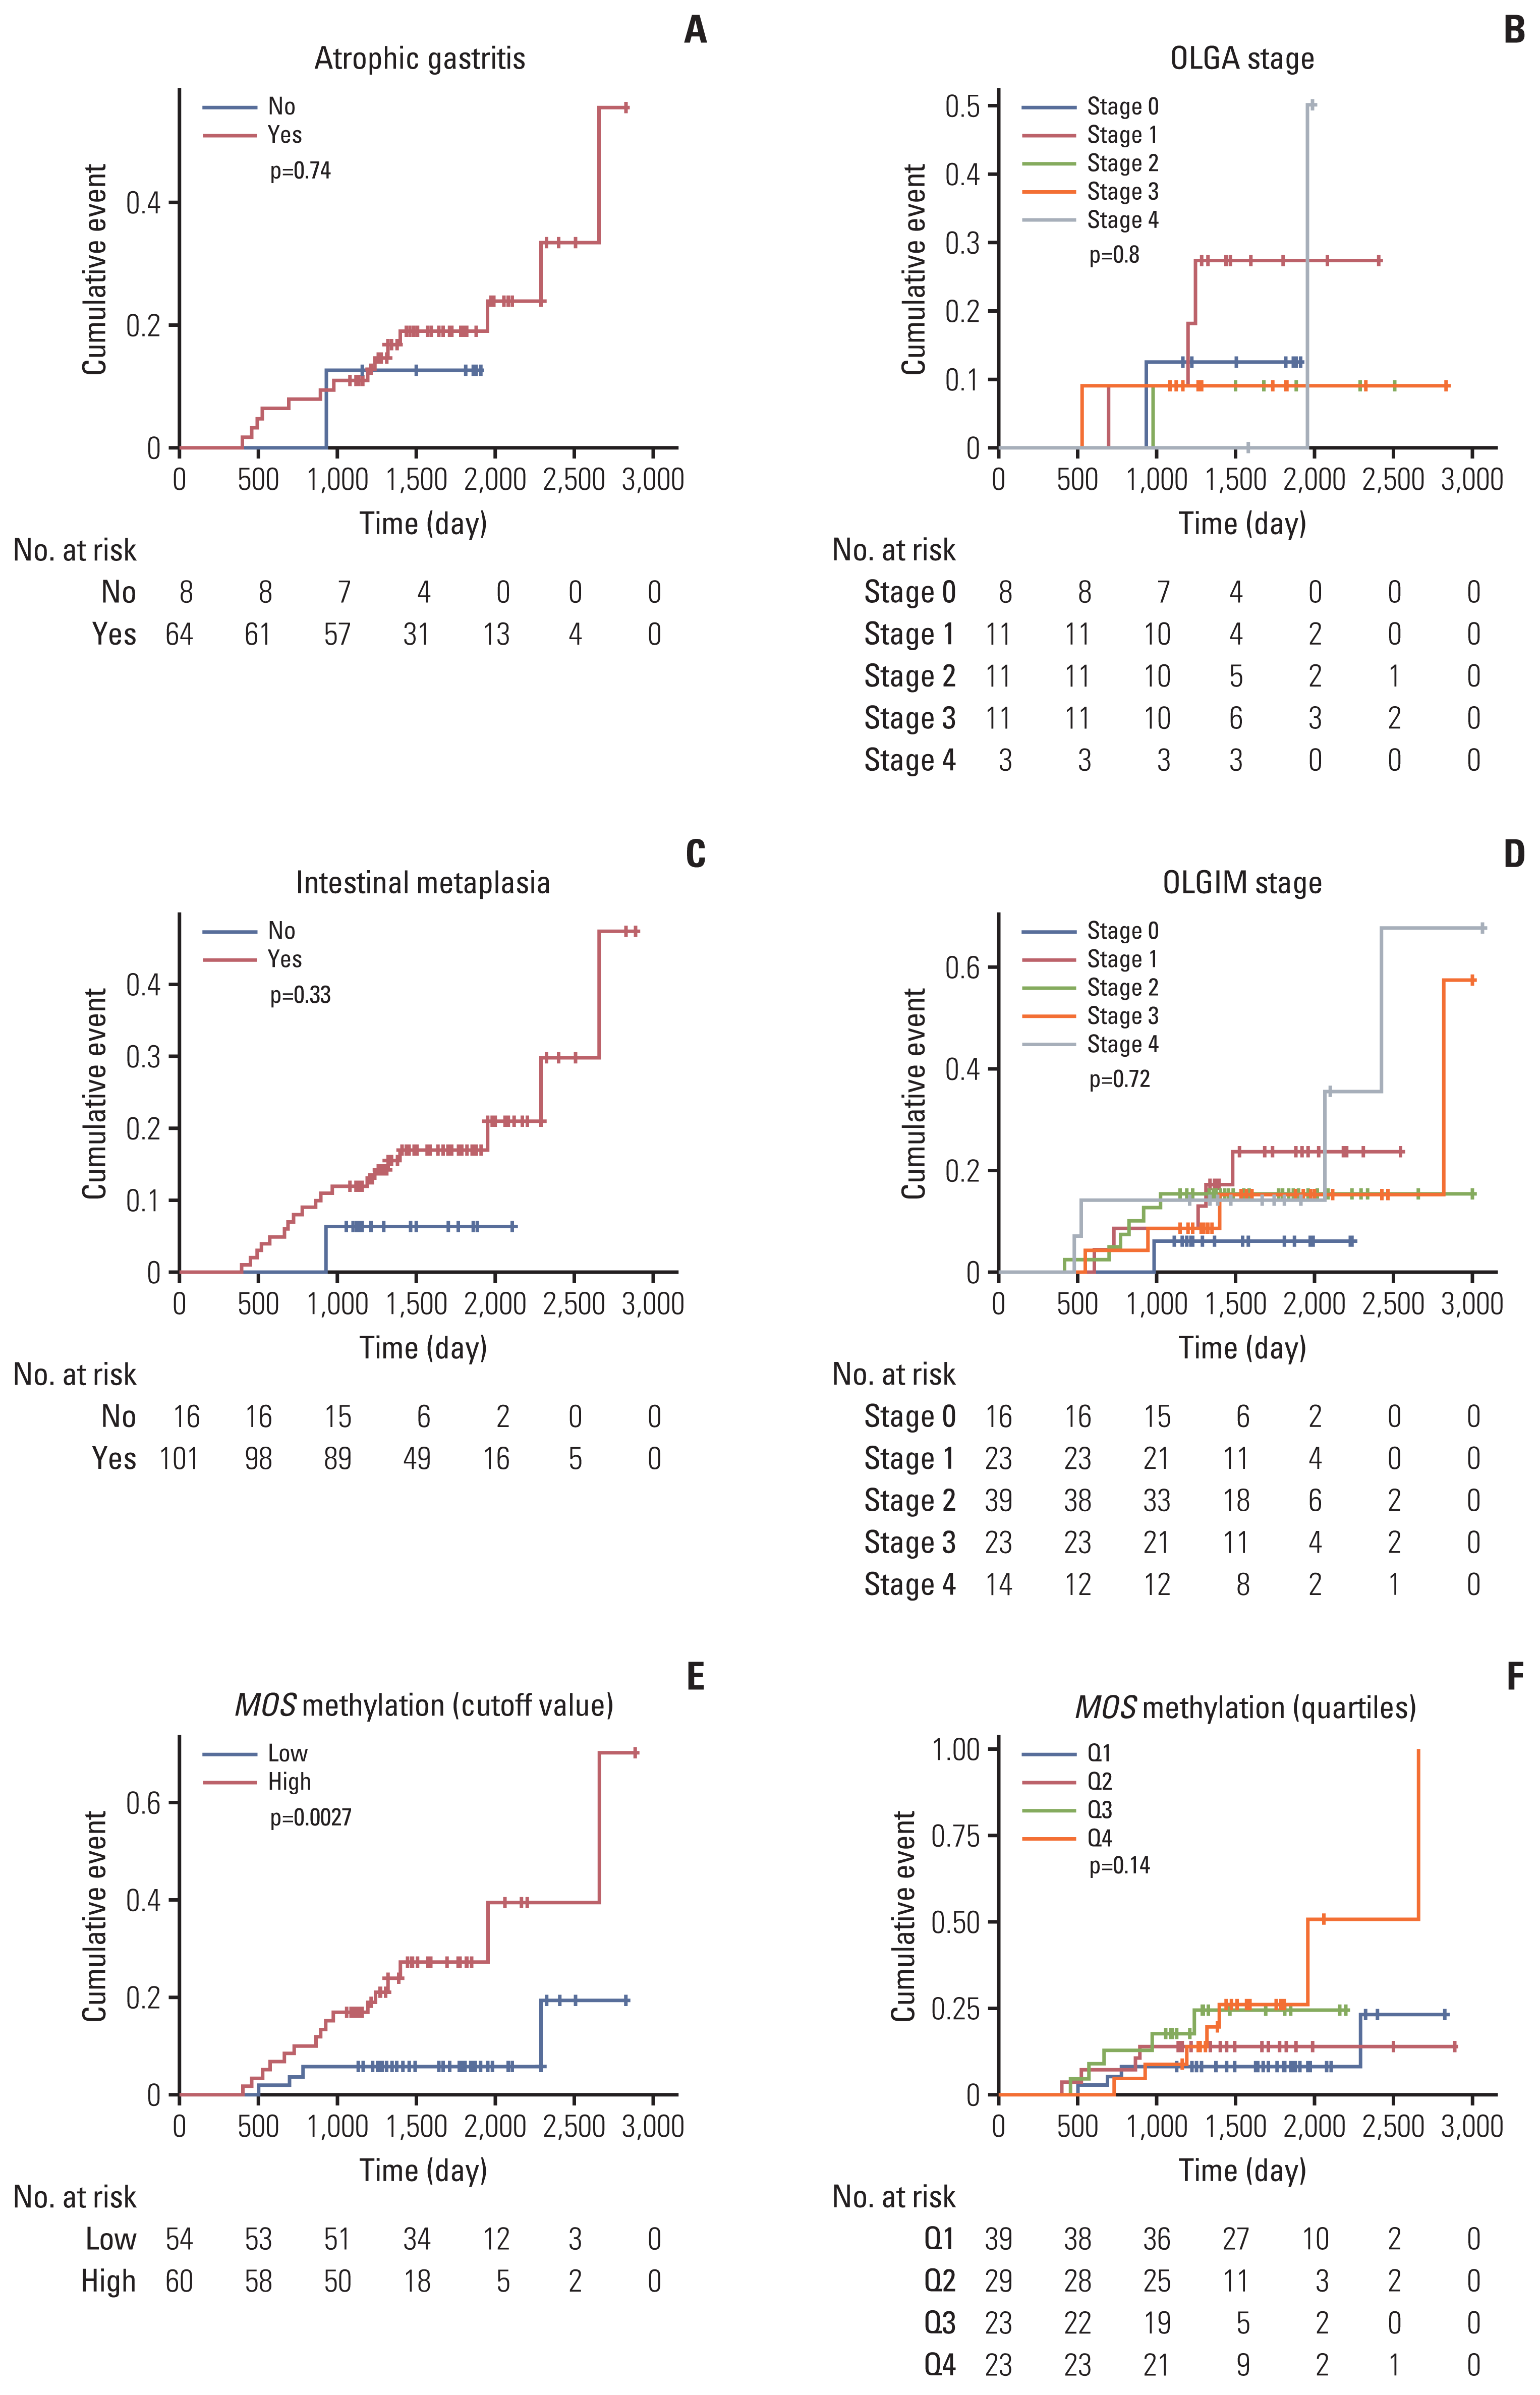
4. Clinical implication of mucosal atrophy, intestinal metaplasia, and MOS methylation in the prediction of meta-chronous gastric recurrence after endoscopic resection
Fig. 3

Table 2
| Crude HR (95% CI) | p-value | p for trend | Adjusted HRa) (95% CI) | p-valuea) | p for trend | |
|---|---|---|---|---|---|---|
| MOS highb) | 4.73 (1.56–14.40) | 0.006c) | 4.76 (1.54–14.79) | 0.007c) | ||
| Atrophic gastritis | 1.40 (0.18–10.88) | 0.746 | 1.31 (0.16–10.75) | 0.802 | ||
| Intestinal metaplasia | 2.62 (0.35–19.74) | 0.349 | 2.32 (0.30–18.29) | 0.423 | ||
| MOS quartile | ||||||
| Q1 | 1 (reference) | 1 (reference) | ||||
| Q2 | 1.64 (0.41–6.61) | 0.485 | 1.42 (0.35–5.87) | 0.624 | ||
| Q3 | 3.36 (0.87–13.03) | 0.080 | 3.11 (0.78–12.46) | 0.109 | ||
| Q4 | 3.53 (1.02–12.22) | 0.047 | 0.027c) | 3.29 (0.94–11.53) | 0.062 | 0.034c) |
| OLGA stage | ||||||
| 0 | 1 (reference) | 1 (reference) | ||||
| 1 | 1.79 (0.18–17.56) | 0.615 | 1.65 (0.13–20.16) | 0.697 | ||
| 2 | 0.61 (0.04–9.90) | 0.728 | 0.57 (0.03–10.28) | 0.705 | ||
| 3 | 0.60 (0.04–27.31) | 0.719 | 0.51 (0.02–10.59) | 0.665 | ||
| 4 | 1.56 (0.09–27.31) | 0.761 | 0.689 | 1.63 (0.09–30.55) | 0.745 | 0.677 |
| OLGIM stage | ||||||
| 0 | 1 (reference) | 1 (reference) | ||||
| 1 | 3.26 (0.38–27.93) | 0.282 | 2.95 (0.33–26.56) | 0.334 | ||
| 2 | 2.22 (0.27–18.54) | 0.461 | 2.10 (0.24–18.20) | 0.503 | ||
| 3 | 2.21 (0.24–20.15) | 0.481 | 1.75 (0.18–16.83) | 0.627 | ||
| 4 | 3.78 (0.42–34.44) | 0.238 | 0.452 | 3.38 (0.34–33.17) | 0.297 | 0.617 |
CI, confidence interval; HR, hazard ratio; OLGA, operative link on gastritis assessment; OLGIM, operative link on gastric intestinal metaplasia assessment.
b) The cutoff value (35.82%) of high or low MOS methylation levels was determined by receiver operating curve analysis. Atrophic gastritis and intestinal metaplasia were defined as the presence of histologic atrophy (score 1–3) and intestinal metaplasia (score 1–3), respectively, at either antrum or corpus by the updated Sydney scoring system,


 PDF
PDF Citation
 Print
Print


 XML Download