Main results
When asked which note-taking method between tablet, paper, and laptop is better for learning, 59.7% (40/67) participants stated that an iPad/tablet was better, while 40.3% (27/67) said that pen and paper note-taking was better. Furthermore, 68.7% (46/67) said their note-taking method of choice did not differ depending on the type of lecture. Of note, 1 participant did not answer this question (67/68). We asked participants about their preferred note-taking method and reasoning behind it; for their preferred note-taking method, 58 students selected iPad/tablets, 4 chose pen and paper, and 6 chose a combination of both methods. All 68 participants answered this question. Students who chose tablets highlighted the efficiency of consolidating notes in one place, the ease of annotating lecture slides, drawing diagrams, writing with the stylus, the accessibility of online study materials, syncing across devices, customizing/editing notes, and portability. Those who used pen and paper regularly emphasized how handwriting helps with memory and stated that writing content out in one’s own words reinforces concepts, minimizes distractions from technology, and allows students to better engage with the material.
Since students were allowed to self-select into groups depending on their preferred type of note-taking, the groups were slightly uneven, with 42 students in the tablet group, 19 students in the longhand group, and 7 students in the laptop group. While we did not reach the minimum number of students in the laptop group, which was a side effect of this method being uncommon in our population, we still reported these results.
Each student was asked to report how much knowledge related to the topic of the talk they had before the study on a numerical scale from 1, meaning “none at all,” to 5, meaning “expert.”
Table 1 shows the distribution of the participants in the study groups and their expressed prior knowledge of the subject.
Table 1.
Distribution of participants and prior knowledge
|
Note-taking method |
Prior knowledge of the topic
|
|
Count |
Min |
Max |
Median |
Mean |
|
Tablet |
42 |
1 |
3 |
1 |
1 |
|
Pen |
19 |
1 |
4 |
1 |
1 |
|
Laptop |
7 |
1 |
3 |
1 |
1 |

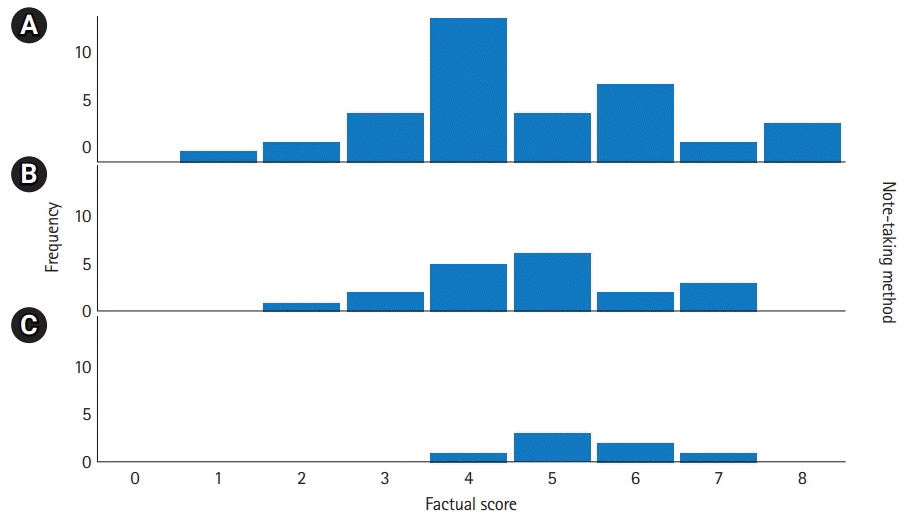
Fig. 1 shows the distribution of factual scores among the study groups. The median factual score was 4 (1st quartile: 4, 3rd quartile: 6) in group A, 5 (1st quartile: 4, 3rd quartile: 6) in group B, and 5 (1st quartile: 5, 3rd quartile: 6) in group C. There was no significant difference in the factual recall scores across the tablet, laptop, and handwritten note-taking conditions (P=0.38).
Fig. 1.
Distribution of factual scores. Note-taking method: (A) tablet, (B) longhand, and (C) laptop.


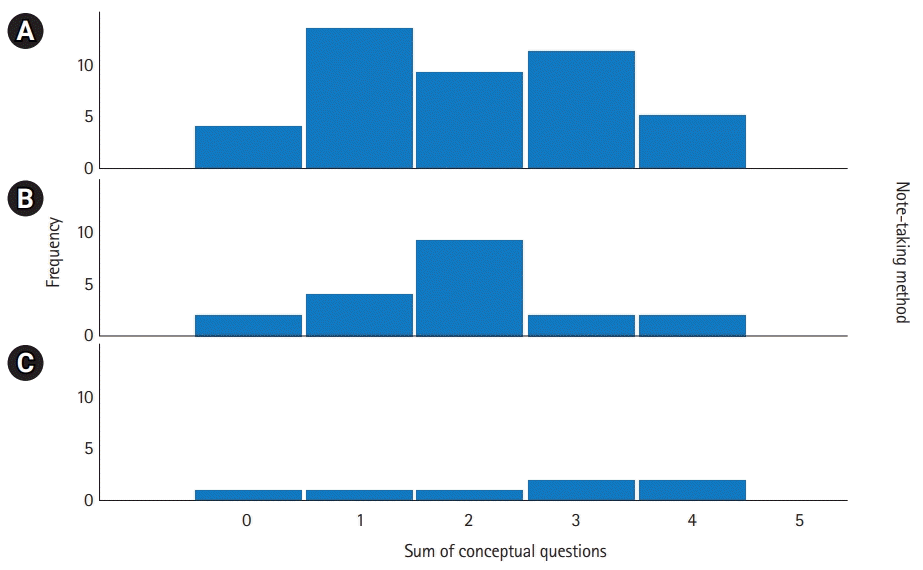
Fig. 2 shows the distribution of conceptual recall scores among the study groups. The median conceptual score was 2 (1st quartile: 1, 3rd quartile: 3) in group A, 2 (1st quartile: 1, 3rd quartile: 2) in group B, and 3 (1st quartile: 1, 3rd quartile: 4) in group C. There was no significant difference in the conceptual application scores across tablet, laptop, and handwritten note-taking (P=0.61).
Fig. 2.
Distribution of conceptual scores. Note-taking method: (A) tablet, (B) longhand, and (C) laptop.


The median word count was 131.5 (IQR, 95.0 to 175.0) for tablets, 121.0 (IQR, 96.0 to 159.0) for handwriting, and 297.0 (IQR, 216.0 to 358.0) for laptops (P=0.01). The total number of drawings, highlighting, or other media/tools was 17 (40.5%) in the tablet group, 3 (15.8%) in the handwriting group, and 0 (0.0%) in the laptop group (P=0.029) (
Table 2).
Table 2.
Word count and use of other tools
|
Variable |
Presence of
|
Word count
|
Drawing
|
Highlight
|
Other media
|
|
Median (IQR) |
P-value |
No. (%) |
P-value |
No. (%) |
P-value |
No. (%) |
P-value |
|
Note-taking method |
|
0.001 |
|
0.373 |
|
0.089 |
|
0.089 |
|
Tablet (N=42) |
131.5 (95.0 to 175.0) |
|
3 (7.1) |
|
7 (16.7) |
|
7 (16.7) |
|
|
Pen (N=19) |
121.0 (96.0 to 159.0) |
|
3 (15.8) |
|
0 |
|
0 |
|
|
Laptop (N=7) |
297.0 (216.0 to 358.0) |
|
0 |
|
0 |
|
0 |
|

Raw response files of students to a quiz were available from
Dataset 1.


 PDF
PDF Citation
 Print
Print


 XML Download