

 PDF
PDF Citation
 Print
Print


Highlights
INTRODUCTION
METHODS
RECOMMENDATION AND EVALUATION OF EVIDENCE FOR CARBOHYDRATE-RESTRICTED DIETS IN ADULTS WITH OVERWEIGHT OR OBESITY
Recommendation
Level of evidence
Benefits (advantages)
Table 1.
| Outcome |
Illustrative comparative riska (95% CI) |
No. of participants | Quality of the evidence (GRADE) | |||
|---|---|---|---|---|---|---|
| Assumed risk (control) |
Corresponding risk |
|||||
| Intervention | Mean difference | |||||
| mLCDb | ||||||
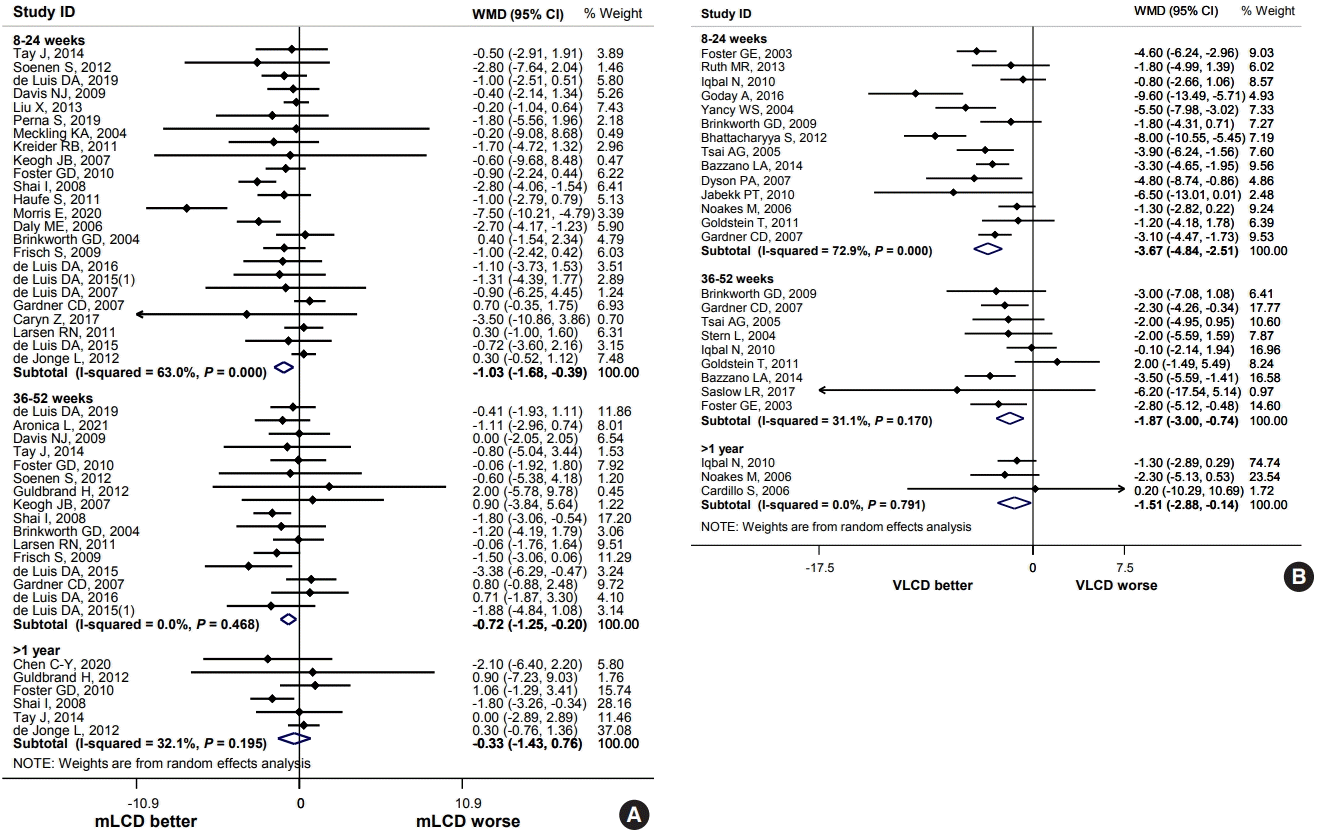
| Body weight, kg (follow-up: 8–24 weeks) | –3.74 | –4.77 | –1.03 (–1.68 to –0.39) | 3,660 (24 studies) | Low | |
| Body mass index, kg/m2 (follow-up: 8–24 weeks) | –1.5 | –1.73 | –0.23 (–0.46 to 0.00) | 2,750 (15 studies) | Very low | |
| Waist circumference, cm (follow-up: 12–24 weeks) | –4.83 | –5.48 | –0.65 (–1.16 to –0.14) | 2,340 (15 studies) | Moderate | |
| Fat mass, kg (follow-up: 12–24 weeks) | –2.92 | –3.36 | –0.44 (–0.83 to –0.04) | 2,080 (14 studies) | Moderate | |
| Fat-free mass, kg (follow-up: 12–24 weeks) | 0.17 | 0.00 | –0.17 (–0.49 to 0.14) | 1,139 (10 studies) | Low | |
| Fat mass, % (follow-up: 12–24 weeks) | –2.7 | –2.61 | 0.09 (–0.45 to 0.64) | 445 (4 studies) | Low | |
| Systolic blood pressure, mm Hg (follow-up: 8–24 weeks) | –4.0 | –4.56 | –0.56 (–1.69 to 0.56) | 2,612 (19 studies) | Low | |
| Diastolic blood pressure, mm Hg (follow-up: 8–24 weeks) | –2.5 | –3.19 | –0.69 (–1.39 to 0.01) | 2,615 (19 studies) | Low | |
| Triglyceride, mg/dL (follow-up: 8–24 weeks) | –11.8 | –25.56 | –13.76 (–19.78 to –7.74) | 2,896 (24 studies) | Low | |
| LDL-C, mg/dL (follow-up: 12–24 weeks) | –4.6 | –2.31 | 2.29 (–0.41 to 4.99) | 2,721 (21 studies) | Very low | |
| HDL-C, mg/dL (follow-up: 8–24 weeks) | –0.8 | 1.81 | 2.61 (1.34 to 3.89) | 2,448 (20 studies) | Moderate | |
| HbA1c, % (follow-up: 8–24 weeks) | –0.2 | –0.40 | –0.20 (–0.39 to –0.01) | 739 (8 studies) | Low | |
| Fasting insulin, μU/mL (follow-up: 12–24 weeks) | –0.9 | –1.84 | –0.94 (–1.73 to –0.16) | 1,855 (13 studies) | Moderate | |
| Fasting glucose, mg/dL (follow-up: 8–24 weeks) | –3.1 | –3.42 | –0.32 (–1.23 to 0.58) | 2,143 (17 studies) | Low | |
| C-reactive protein, mg/L (follow-up: 8–24 weeks) | –0.1 | –0.44 | –0.34 (–0.67 to –0.01) | 1,391 (11 studies) | Low | |
| Adiponectin, μg/mL (follow-up: 8–24 weeks) | 0.2 | 0.65 | 0.45 (0.15 to 0.76) | 1,356 (8 studies) | Moderate | |
| VLCDc | ||||||
| Body weight, kg (follow-up: 8–24 weeks) | –3.75 | –7.42 | –3.67 (–4.84 to –2.51) | 1,266 (14 studies) | Moderate | |
| Body mass index, kg/m2 (follow-up: 8–24 weeks) | –1.0 | –2.88 | –1.88 (–3.11 to –0.65) | 388 (5 studies) | Moderate | |
| Waist circumference, cm (follow-up: 8–24 weeks) | –4.7 | –8.81 | –4.11 (–8.70 to 0.49) | 233 (2 studies) | Low | |
| Fat mass, kg (follow-up: 8–24 weeks) | –4.8 | –7.81 | –3.01 (–6.29 to 0.27) | 168 (3 studies) | Low | |
| Fat-free mass, kg (follow-up: 8–24 weeks) | –0.3 | –1.35 | –1.05 (–1.75 to –0.35) | 168 (3 studies) | Low | |
| Fat mass, % (follow-up: 8–24 weeks) | –1.45 | –3.33 | –1.88 (–2.87 to –0.89) | 515 (4 studies) | Moderate | |
| Systolic blood pressure, mm Hg (follow-up: 8–24 weeks) | –3.0 | –4.97 | –1.97 (–3.68 to –0.25) | 506 (9 studies) | Moderate | |
| Diastolic blood pressure, mm Hg (follow-up: 8–24 weeks) | –2.1 | –2.78 | –0.68 (–1.79 to 0.44) | 906 (9 studies) | Low | |
| Triglyceride, mg/dL (follow-up: 8–24 weeks) | –11.9 | –33.23 | –21.33 (–30.46 to –12.21) | 1,059 (13 studies) | Low | |
| LDL-C, mg/dL (follow-up: 8–24 weeks) | –5.1 | 2.42 | 7.52 (3.34 to 11.70) | 1,023 (12 studies) | Moderate | |
| HDL-C, mg/dL (follow-up: 8–24 weeks) | 0.0 | 4.30 | 4.30 (1.79 to 6.82) | 1,058 (13 studies) | Low | |
| HbA1c, % (follow-up: 8–24 weeks) | –0.15 | –0.42 | –0.27 (–0.50 to –0.03) | 354 (6 studies) | Low | |
| Fasting insulin, μU/mL (follow-up: 8–24 weeks) | –1.55 | –2.92 | –1.37 (–2.89 to 0.15) | 603 (6 studies) | Low | |
| Fasting glucose, mg/dL (follow-up: 8–24 weeks) | –2.9 | –3.34 | –0.44 (–2.66 to 1.78) | 730 (9 studies) | Low | |
| C-reactive protein, mg/L (follow-up: 8–24 weeks) | –0.2 | –0.83 | –0.63 (–1.41 to 0.15) | 371 (5 studies) | Low | |
| Adiponectin, μg/mL (follow-up: 8–24 weeks) | 0.4 | 1.15 | 0.75 (0.29 to 1.21) | 181 (2 studies) | Low | |
| Intermittent fastingd | ||||||
| Body weight, kg (follow-up: 12–24 weeks) | –3.62 | –4.84 | –1.22 (–3.49 to 1.05) | 554 (8 studies) | Very low | |
| Body mass index, kg/m2 (follow-up: 12–24 weeks) | –1.46 | –1.95 | –0.49 (–1.13 to 0.14) | 380 (5 studies) | Low | |
| Waist circumference, cm (follow-up: 12–24 weeks) | –2.28 | –4.23 | –1.95 (–4.09 to 0.2) | 180 (3 studies) | Very low | |
| Fat mass, kg (follow-up: 12–24 weeks) | –1.1 | –1.46 | –0.36 (–0.87 to 0.16) | 540 (8 studies) | Very low | |
| Fat-free mass, kg (follow-up: 12–24 weeks) | –3.7 | –4.37 | –0.67 (–1.95 to 0.62) | 540 (8 studies) | Very low | |
| Fat mass, % (follow-up: 12–24 weeks) | –0.9 | –0.63 | 0.27 (–0.48 to 1.01) | 142 (3 studies) | Very low | |
| Systolic blood pressure, mm Hg (follow-up: 12–24 weeks) | –5.7 | –4.83 | 0.87 (–2.56 to 4.39) | 404 (6 studies) | Very low | |
| Diastolic blood pressure, mm Hg (follow-up: 12–24 weeks) | –3.4 | –3.56 | –0.16 (–2.89 to 2.56) | 404 (6 studies) | Very low | |
| Triglyceride, mg/dL (follow-up: 12–24 weeks) | –22.0 | –23.51 | –1.51 (–17.06 to 14.04) | 432 (6 studies) | Very low | |
| LDL-C, mg/dL (follow-up: 12–24 weeks) | –12.48 | –12.72 | –0.24 (–5.08 to 4.59) | 387 (5 studies) | Very low | |
| HDL-C, mg/dL (follow-up: 12–24 weeks) | 0.0 | –0.17 | –0.17 (–3.27 to 2.89) | 432 (6 studies) | Very low | |
| HbA1c, % (follow-up: 12–24 weeks) | –0.31 | –0.20 | 0.11 (–0.04 to 0.26) | 173 (3 studies) | Very low | |
| Fasting glucose, mg/dL (follow-up: 12–24 weeks) | –3.00 | –3.89 | –0.89 (–4.30 to 2.53) | 359 (5 studies) | Low | |
| Fasting insulin, μU/mL (follow-up: 12–24 weeks) | –2.6 | –3.03 | –0.43 (–1.99 to 1.14) | 314 (4 studies) | Low | |
| HOMA-IR (follow-up: 12–24 weeks) | –0.94 | –1.16 | –0.22 (–1.48 to 1.05) | 119 (2 studies) | Very low | |
GRADE Working Group grades of evidence: High quality (Further research is very unlikely to change our confidence in the estimate of effect); Moderate quality (Further research is likely to have an important impact on our confidence in the estimate of effect and may change the estimate); Low quality (Further research is very likely to have an important impact on our confidence in the estimate of effect and is likely to change the estimate); Very low quality (We are very uncertain about the estimate).
CI, confidence interval; GRADE, Grading of Recommendations Assessment, Development and Evaluation; mLCD, moderately-low carbohydrate or low carbohydrate diet; LDL-C, low-density lipoprotein cholesterol; HDL-C, high-density lipoprotein cholesterol; HbA1c, glycosylated hemoglobin; VLCD, very-low carbohydrate diet; HOMA-IR, homeostatic model assessment for insulin resistance.
a The basis for the assumed risk is the mean change of outcomes compared to baseline in the control group across studies, and the corresponding risk (and its 95% CI) is based on the assumed risk in the comparison group,
b mLCD for overweight/obesity: Patient or population (patients with overweight/obese), Intervention (mLCD),
![]()
Body weight and BMI
Waist circumference
Fat mass and fat percentage
Lipid profile, blood pressure, glycemic control, and other metabolic parameters
Summary and conclusion of benefits
Harms (risks)
Fat-free mass
Lipid profiles and other adverse effects
Summary and conclusion of harms
Balance of benefits and risks
Considerations in the use of the recommendation
RECOMMENDATION AND EVALUATION OF EVIDENCE FOR INTERMITTENT FASTING IN ADULTS WITH OVERWEIGHT OR OBESITY
Level of evidence
Benefits (advantages)
Body weight, body mass index, and body composition
Lipid profile, blood pressure, glycemic control, and other metabolic parameters
Harms (risks)
Balance of benefits and harms
Considerations in the use of the recommendation
RECOMMENDATION AND EVALUATION OF EVIDENCE FOR CARBOHYDRATE-RESTRICTED DIETS IN ADULTS WITH TYPE 2 DIABETES MELLITUS
Recommendation 1.
Recommendation 2.
Level of evidence
Benefits (advantages)
Table 2.
| Outcome |
Illustrative comparative riska (95% CI) |
No. of participants | Quality of the evidence (GRADE) | |||
|---|---|---|---|---|---|---|
| Assumed risk (control) |
Corresponding risk |
|||||
| Intervention | Mean difference | |||||
| mLCDb | ||||||
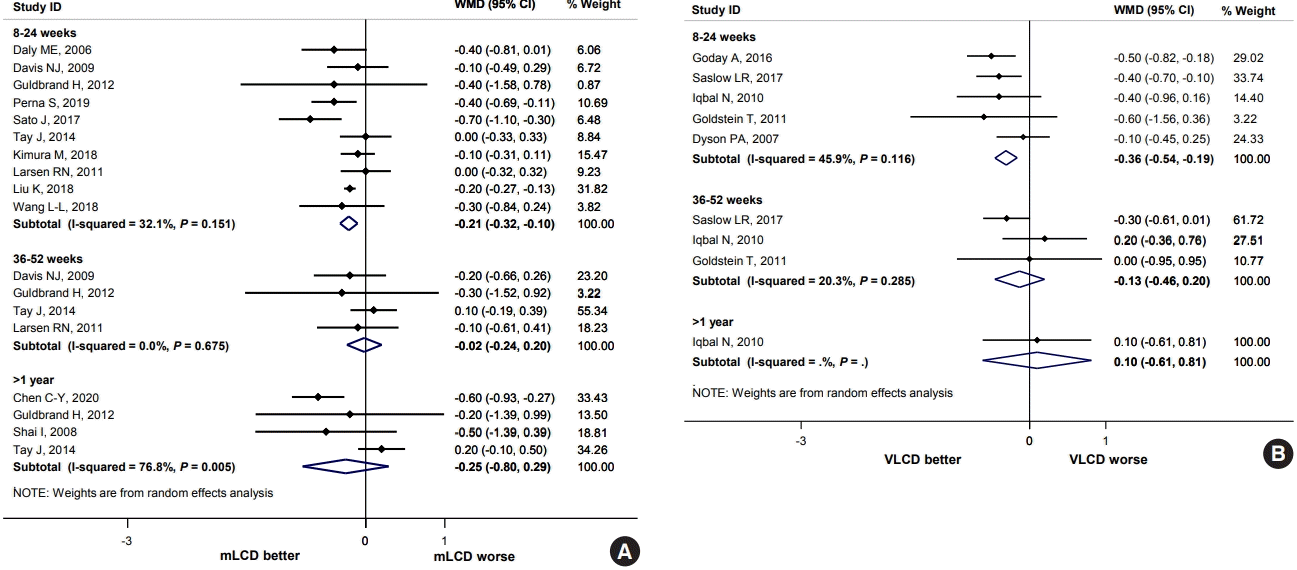
| HbA1c, % (follow-up: 8–24 weeks) | –0.2 | –0.41 | –0.21 (–0.32 to –0.10) | 758 (10 studies) | Moderate | |
| HOMA-IR (follow-up: 8–24 weeks) | –0.4 | –0.93 | –0.53 (–0.96 to –0.11) | 248 (3 studies) | Low | |
| Fasting glucose, mg/dL (follow-up: 8–24 weeks) | 4.65 | –5.23 | –9.88 (–18.04 to –1.71) | 337 (6 studies) | Low | |
| Body weight, kg (follow-up: 8–24 weeks) | –1.45 | –2.99 | –1.54 (–3.11 to 0.02) | 619 (8 studies) | Low | |
| Systolic blood pressure, mm Hg (follow-up: 8–24 weeks) | –0.25 | –3.24 | –2.99 (–5.48 to –0.49) | 510 (6 studies) | Moderate | |
| Diastolic blood pressure, mm Hg (follow-up: 8–24 weeks) | 0.55 | –0.52 | –1.07 (–2.43 to 0.29) | 513 (6 studies) | Low | |
| Triglyceride, mg/dL (follow-up: 8–24 weeks) | –4.0 | –21.22 | –17.22 (–34.27 to –0.18) | 742 (10 studies) | Low | |
| LDL-C, mg/dL (follow-up: 8–24 weeks) | –3.6 | –3.25 | 0.35 (–3.03 to 3.72) | 607 (8 studies) | Low | |
| HDL-C, mg/dL (follow-up: 8–24 weeks) | 0.2 | 2.50 | 2.30 (0.23 to 4.37) | 547 (8 studies) | Moderate | |
| Hypoglycemia | There is no study directly evaluated the risk of hypoglycemia. Patients at high risk of hypoglycemia were excluded in 2 out of 13 studies. | |||||
| VLCDc | ||||||
| HbA1c, % (follow-up: 12–24 weeks) | –0.2 | –0.56 | –0.36 (–0.54 to –0.19) | 321 (5 studies) | Moderate | |
| HOMA-IR (follow-up: 12–24 weeks) | –0.45 | –1.52 | –1.07 (–3.13 to 0.98) | 119 (2 studies) | Low | |
| Fasting glucose, mg/dL (follow-up: 12–24 weeks) | –17.2 | –26.84 | –9.64 (–19.54 to 0.26) | 267 (3 studies) | Low | |
| Body weight, kg (follow-up: 12–24 weeks) | –3.4 | –7.24 | –3.84 (–7.55 to –0.13) | 291 (4 studies) | Moderate | |
| Systolic blood pressure, mm Hg (follow-up: 12–24 weeks) | –1.7 | –1.36 | 0.34 (–3.61 to 4.28) | 218 (3 studies) | Low | |
| Diastolic blood pressure, mm Hg (follow-up: 12–24 weeks) | –2.5 | –1.12 | 1.38 (–0.90 to 3.67) | 218 (3 studies) | Low | |
| Triglyceride, mg/dL (follow-up: 12–24 weeks) | –15.7 | –27.10 | –11.40 (–27.01 to 4.22) | 313 (5 studies) | Low | |
| LDL-C, mg/dL (follow-up: 12–24 weeks) | –1.35 | 5.84 | 7.19 (0.02 to 14.36) | 277 (4 studies) | Moderate | |
| HDL-C, mg/dL (follow-up: 12–24 weeks) | 2.3 | 2.73 | 0.43 (–1.98 to 2.84) | 312 (5 studies) | Low | |
| Hypoglycemia | Although no study directly evaluated the risk of hypoglycemia, patients at high risk of hypoglycemia were excluded in 4 out of 5 studies. | |||||
| Intermittent fastingd | ||||||
| HbA1c, % (follow-up: 24 weeks) | –0.6 | –0.5 | 0.10 (–0.35 to 0.55) | 63 (1 study) | Low | |
| HbA1c, % (follow-up: 52 weeks) | –0.5 | –0.3 | 0.20 (–0.22 to 0.62) | 137 (1 study) | Low | |
| Body weight, kg (follow-up: 24 weeks) | –4.0 | –5.0 | –1.00 (–6.94 to 4.94) | 63 (1 study) | Low | |
| Fat-free mass, kg (follow-up: 24 weeks) | –1.1 | –2.2 | –1.10 (–2.22 to 0.02) | 49 (1 study) | Low | |
| Fat mass, kg (follow-up: 24 weeks) | –4.0 | –3.8 | 0.20 (–1.46 to 1.86) | 49 (1 study) | Low | |
| Fat mass, % (follow-up: 24 weeks) | –2.1 | –1.7 | 0.40 (–0.86 to 1.66) | 49 (1 study) | Low | |
| Hypoglycemia | Although no study directly evaluated the risk of hypoglycemia, most studies in obese or overweight adults have excluded patients with diabetes as an exclusion criterion. | |||||
GRADE Working Group grades of evidence: High quality (Further research is very unlikely to change our confidence in the estimate of effect); Moderate quality (Further research is likely to have an important impact on our confidence in the estimate of effect and may change the estimate); Low quality (Further research is very likely to have an important impact on our confidence in the estimate of effect and is likely to change the estimate); Very low quality (We are very uncertain about the estimate).
CI, confidence interval; GRADE, Grading of Recommendations Assessment, Development and Evaluation; mLCD, moderately-low carbohydrate or low carbohydrate diet; HbA1c, glycosylated hemoglobin; HOMA-IR, homeostatic model assessment for insulin resistance; LDL-C, low-density lipoprotein cholesterol; HDL-C, high-density lipoprotein cholesterol; VLCD, very-low carbohydrate diet.
a The basis for the assumed risk is the mean change of outcomes compared to baseline in the control group across studies, and the corresponding risk (and its 95% CI) is based on the assumed risk in the comparison group,
b mLCD for type 2 diabetes mellitus: Patient or population (patients with type 2 diabetes mellitus), Intervention (mLCD),
![]()
HbA1 reduction
Body weight, blood pressure, lipid profiles, fasting blood glucose, and insulin resistance
Summary and conclusion of benefits
Harms (risks)
Summary and conclusion of harms
Balance of benefits and harms
Considerations in the use of the recommendation
RECOMMENDATION AND EVALUATION OF EVIDENCE FOR INTERMITTENT FASTING IN ADULTS WITH TYPE 2 DIABETES MELLITUS
Recommendation
Level of evidence
Benefits (advantages)
Harms (risks)
Balance of benefits and harms
Considerations in the use of the recommendation
RECOMMENDATION AND EVALUATION OF EVIDENCE FOR CARBOHYDRATE-RESTRICTED DIETS AND INTERMITTENT FASTING IN ADULTS WITH HYPERTENSION
Level of evidence
Carbohydrate-restricted diets
Benefits (advantages)
Table 3.
| Outcome |
Illustrative comparative riska (95% CI) |
No. of participants | Quality of the evidence (GRADE) | |||
|---|---|---|---|---|---|---|
| Assumed risk (control) |
Corresponding risk |
|||||
| Intervention | Mean difference | |||||
| mLCDb | ||||||
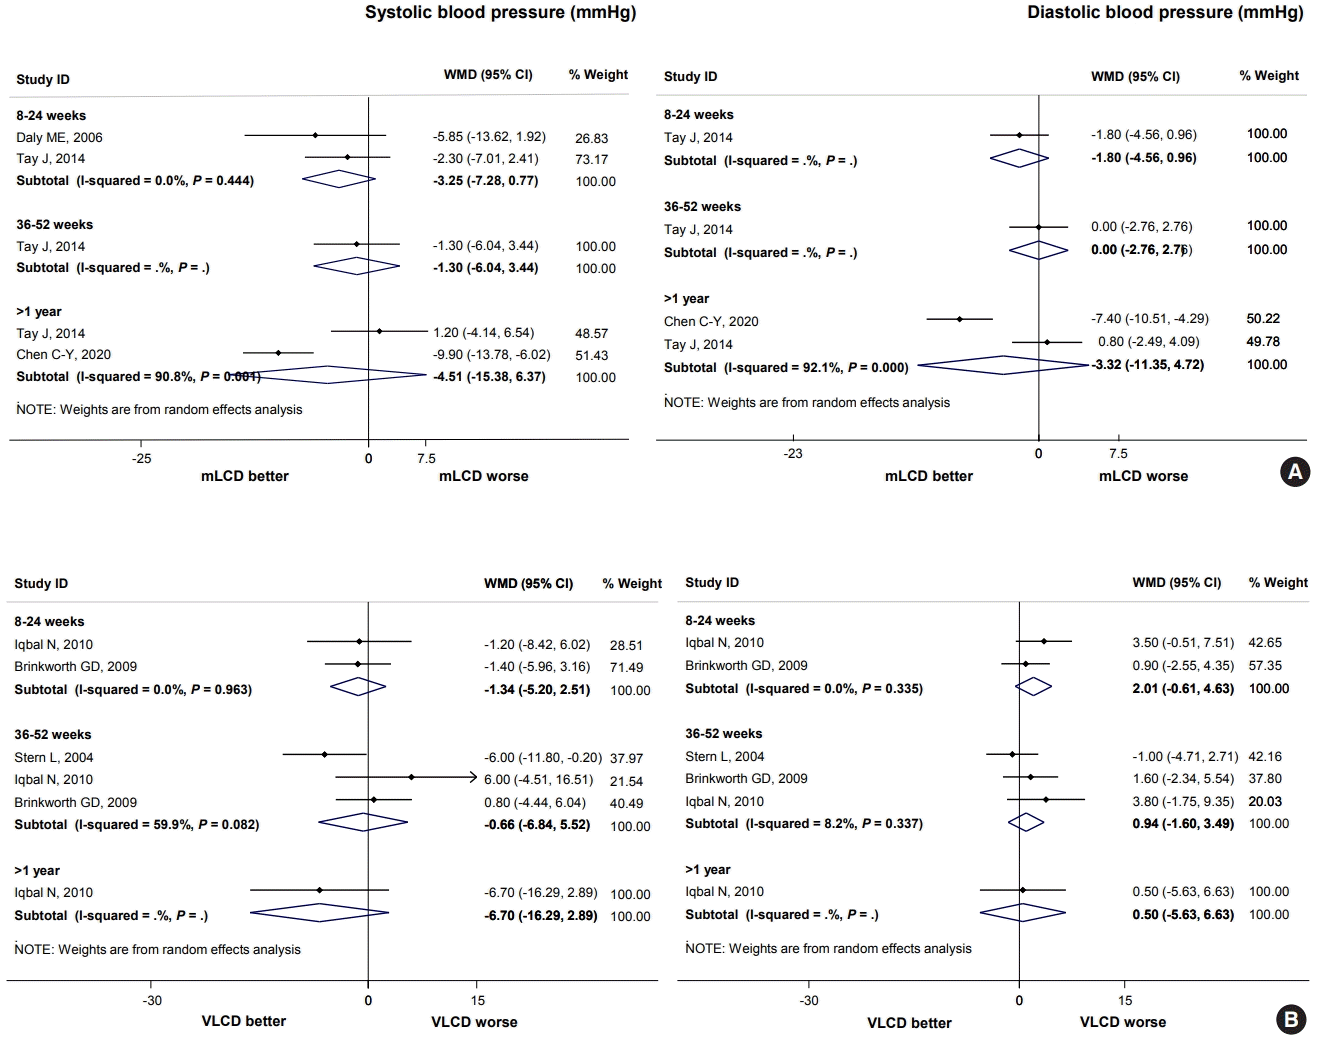
| Systolic blood pressure, mm Hg (follow-up: 8–24 weeks) | –4.55 | –7.80 | –3.25 (–7.28 to 0.77) | 195 (2 studies) | Very low | |
| Diastolic blood pressure, mm Hg (follow-up: 8–24 weeks) | –4.00 | –5.80 | –1.80 (–4.56 to 0.96) | 93 (1 study) | Very low | |
| Triglyceride, mg/dL (follow-up: 8–24 weeks) | –15.48 | –51.06 | –35.58 (–52.84 to –18.33) | 195 (2 studies) | Very low | |
| LDL-C, mg/dL (follow-up: 8–24 weeks) | –0.30 | –0.30 | 0.00 (–9.55 to 9.55) | 93 (1 study) | Very low | |
| HDL-C, mg/dL (follow-up: 36–52 weeks) | 2.3 | 3.90 | 1.60 (–1.13 to 4.33) | 93 (1 study) | Very low | |
| Body weight, kg (follow-up: 8–24 weeks) | –6.2 | –8.01 | –1.81 (–3.93 to 0.30) | 195 (2 studies) | Very low | |
| FMD, % (follow-up: 36–52 weeks) | –0.6 | –0.30 | 0.30 (–0.58 to 1.18) | 93 (1 study) | Very low | |
| VLCDc | ||||||
| Systolic blood pressure, mm Hg (follow-up: 8–24 weeks) | –6.3 | –7.64 | –1.34 (–5.20 to 2.51) | 232 (2 studies) | Very low | |
| Diastolic blood pressure, mm Hg (follow-up: 8–24 weeks) | –4.0 | –1.99 | 2.01 (–0.61 to 4.63) | 232 (2 studies) | Very low | |
| Triglyceride, mg/dL (follow-up: 8–24 weeks) | –19.95 | –30.12 | –10.17 (–43.00 to 22.67) | 232 (2 studies) | Very low | |
| LDL-C, mg/dL (follow-up: 8–24 weeks) | –6.75 | 2.16 | 8.91 (–9.27 to 27.08) | 232 (2 studies) | Very low | |
| HDL-C, mg/dL (follow-up: 8–24 weeks) | 2.75 | 4.60 | 1.85 (–5.98 to 9.69) | 232 (2 studies) | Very low | |
| Body weight, kg (follow-up: 8–24 weeks) | –6.05 | –7.21 | –1.16 (–2.65 to 0.34) | 232 (2 studies) | Very low | |
| FMD, % (follow-up: 36–52 weeks) | –0.3 | –2.10 | –1.80 (–3.48 to –0.12) | 49 (1 study) | Very low | |
GRADE Working Group grades of evidence: High quality (Further research is very unlikely to change our confidence in the estimate of effect); Moderate quality (Further research is likely to have an important impact on our confidence in the estimate of effect and may change the estimate); Low quality (Further research is very likely to have an important impact on our confidence in the estimate of effect and is likely to change the estimate); Very low quality (We are very uncertain about the estimate).
CI, confidence interval; GRADE, Grading of Recommendations Assessment, Development and Evaluation; mLCD, moderately-low carbohydrate or low carbohydrate diet; LDL-C, low-density lipoprotein cholesterol; HDL-C, high-density lipoprotein cholesterol; FMD, flow-mediated dilatation; VLCD, very-low carbohydrate diet.
![]()
 XML Download