

 PDF
PDF Citation
 Print
Print


INTRODUCTION
Y-chromosomal short tandem repeats (Y-STRs) are useful in paternal lineage testing and for identifying male content from female-male DNA mixtures commonly found in sexual crime.123 However, in case of same paternal lineage, it is difficult to distinguish between male relatives with Y-STRs with relatively low or moderate mutation rates (approximately 10−3 per locus per generation). Recently, rapidly mutating Y-STRs (RM Y-STRs; average mutation rate per locus per generation > 10−2)4 with higher mutation rates (over 10-fold) than existing Y-STRs, have been demonstrated to be suitable for identifying male relatives in many studies.456789 All 13 known RM Y-STRs have shown the possibility of differentiating between closely related males, i.e., between father and son, as well as unrelated men. In 2010, Ballantyne et al.456 discovered these 13 RM Y-STRs,4 and reported their superior performance in differentiating between closely and distantly related males compared to traditional Y-STR kits5; a subsequent multi-center study showed the possibility of male individualization and male relative differentiation.6 Bredemeyer et al.7 had also tested the 13 RM Y-STRs using a modified RM-Yplex8 in 64 father-son pairs and identified possible mutations. Furthermore, the value of RM Y-STR set to distinguish paternal lineages had been demonstrated even from endogamous populations with low Y-STR diversity.9
In the past two decades, STRs have been frequently analyzed by capillary electrophoresis (CE); however, massively parallel sequencing (MPS) has recently emerged as an attractive method in forensic laboratories owing to its numerous advantages, including: 1) the simultaneous analysis of multiple markers and samples, 2) the detection of sequence variances, such as isometric variants and single nucleotide polymorphisms (SNPs) in flanking regions or repeat patterns, 3) the reduced size of amplicons compared to that used in CE. Therefore, scrutinizing STRs using the MPS method would be more useful in cases of challenging samples, such as degraded DNA,101112 while increases in the number of alleles due to sequence variances have also been reported in many STR studies using MPS.713141516171819
Despite the existence of several commercial MPS kits containing Y-STR loci, such as the ForenSeq™ DNA Signature Prep Kit and PowerSeq® 46GY System, the sequence-based data of Y-STRs remain relatively insufficient compared to their length-based data (e.g., Y-chromosome STR haplotype reference database).20 In addition, the kits only include 2–4 RM Y-STRs; ForenSeq™ kit contains DYF387S1, DYS570, DYS576, and DYS612, whereas PowerSeq® 46GY contains DYS570 and DYS576. The compilation of sequence-based data, including multiple RM Y-STRs, in addition to existing Y-STRs, will be important in employing MPS into forensic practice. It would also suggest that RM Y-STRs have increased value for distinguishing between closely related males as well as unrelated males.
This study aimed to analyze the sequence variations of a Y-SNP (M175) and 31 Y-STRs that included the PowerPlex® Y23 loci, adding seven RM Y-STRs and a Yfiler™ Plus polymerase chain reaction (PCR) amplification kit locus (DYS460) for 220 male samples from four populations; African Americans (AfAm), Caucasians (Cauc), Hispanics (Hisp), and Koreans (Kor). Genotype concordance was confirmed between the CE and MPS methods. Significant gains in the number of observed alleles were identified using the MPS method. We further investigated the different allele distributions across the four populations. Finally, the importance of sequence variation analysis by MPS and usefulness of RM Y-STRs for increasing discrimination were addressed.
METHODS
DNA samples
A total of 220 unrelated male samples from four populations, AfAm (n = 17), Cauc (n = 50), Hisp (n = 48), and Kor (n = 105) were used for this study. DNA samples of AfAm, Cauc, and Hisp were obtained from the NHGRI Sample Repository for Human Genetic Research at the Coriell Institute for Medical Research (Camden, NJ, USA; listed Repository ID numbers in Supplementary Table 1) and those of Kor were selected from a previous report.17 All samples were quantified using NanoDrop 1000 spectrophotometer (Thermo Fisher Scientific, Waltham, MA, USA) and normalized to 1 ng/µL for subsequent analysis.
Multiplex PCR system for MPS analysis of 31 Y-STR loci
DNA samples were amplified using an in-house multiplex PCR system, with 31 Y-STR markers (DYF387S1, DYF399S1, DYF404S1, DYS19, DYS385ab, DYS389I, DYS389II, DYS390, DYS391, DYS392, DYS393, DYS437, DYS438, DYS439, DYS448, DYS449, DYS456, DYS458, DYS460, DYS481, DYS518, DYS533, DYS549, DYS570, DYS576, DYS612, DYS627, DYS635, DYS643, and YGATAH4) and a Y-SNP marker (M175). The system was constructed by adding 7 RM Y-STRs (DYF387S1, DYF399S1, DYF404S1, DYS449, DYS518, DYS612, and DYS627) and DYS460, a Yfiler™ plus (Thermo Fisher Scientific) locus, to the previously developed MPS panel reported by Kwon et al.17 for PowerPlex® Y23 (Promega, Madison, WI, USA) loci. This upgraded MPS panel covered all the commonly used commercial CE system loci, such as the PowerPlex® Y23 and Yfiler™ plus system. The primers used for the amplification of targeted Y-STRs and Y-SNP were designed using primer3 (http://bioinfo.ut.ee/primer3-0.4.0/), avoiding the region where mutation occurs with 1% or greater frequency, based on the National Center for Biotechnology Information (NCBI) SNP build 153 information (https://www.ncbi.nlm.nih.gov/SNP/), thereby eliminating even minor PCR interference and increasing the PCR yields. The size of the targeted markers ranged from 85 to 274 bp (Supplementary Table 2).
Library preparation
The MPS amplicon libraries were constructed using a PCR-based enrichment method, which requires only two PCR amplification steps, as previously described in Kwon et al.17 The primers used in the first-round PCR step included target-specific sequence and read sequence. The PCR component consisted of 1.0 ng of DNA template, 2.0 μL of Gold ST*R 10× buffer (Promega), 6.0 U of AmpliTaq Gold DNA polymerase (Thermo Fisher Scientific) and primer sets of appropriate concentration in a final volume of 20.0 μL. Thermal cycling was performed using a Veriti 96-well thermal cycler (Thermo Fisher Scientific) under the following conditions: 95°C for 11 minutes, 27 cycles of 94°C for 20 seconds, 60°C for 1 minutes, and 72°C for 45 seconds, and a final extension at 72°C for 5 minutes, with a final holding step at 4°C. The second-round PCR, or indexing PCR, added indices and platform-specific adapter sequences to the amplicons produced by the first-round PCR. The PCR component consisted of 1.0 μL of 10-fold diluted PCR products, 2.0 μL of Gold ST*R 10× buffer, 3.0 U of AmpliTaq Gold DNA polymerase, and 2 μL of Index 1 (i7) and Index 2 (i5) of the Nextera XT v2 index kit (Illumina, San Diego, CA, USA) in a final volume of 20.0 μL. Thermal cycling was implemented using the Veriti 96-well thermal cycler under the following conditions: 95°C for 15 minutes, followed by 16 cycles of 94°C for 20 seconds, 61°C for 30 seconds, and 72°C for 45 seconds, and a final extension at 72°C for 5 minutes, thereafter held at 4°C.
Post-PCR steps and validation of library
After the two rounds of PCR, the concentration and size range for each of the generated libraries were measured using an Agilent DNA 1000 kit (Agilent Technologies, Santa Clara, CA, USA) on an Agilent 2100 bioanalyzer (Agilent Technologies). The sizes of the barcoded libraries ranged from approximately 200 to 400 bp including read and platform-specific sequences. Each library was normalized to a concentration of 10 ng/μL and pooled in an equal volume. PCR clean-up was performed using 1.2× Agencourt AMPure XP beads (Beckman Coulter, Indianapolis, IN, USA) according to the manufacturer’s guidelines. Both the concentration and size range of the purified libraries were quantified using an Agilent DNA 1000 kit on an Agilent 2100 bioanalyzer. The quantities of the libraries were also confirmed using the KAPA Library Quantification Kit (KAPA Biosystems, Wilmington, MA, USA) on an AB 7500 real-time PCR system (Thermo Fisher Scientific). Finally, the libraries were normalized to 10 nM for sequencing.
MPS run and sequencing data analysis
The libraries were sequenced using a MiSeq Reagent kit v3 (2 × 300 cycles; Illumina) in a MiSeq system (Illumina), and FASTQ files for each sample were generated in both directions (Read1 and Read2, separately). The FASTQ files were analyzed using two programs, namely STRait Razor v3.021 (UNT Health Science Center, Fort Worth, TX, USA) and Microsoft Excel software (Microsoft, Redmond, WA, USA). First, the STRait Razor v3.0 was employed to check marker coverage and investigate the allele call results with a created configuration file for 32 Y chromosomal markers (Supplementary Table 3). For allele-calling, 100 reads were set as the minimum coverage threshold and both Read1 and Read2 files were used for the analysis. However, DYF387S1, DYS448, and DYS518 were analyzed with reads from the Read1 files and DYS449 was analyzed using the Read2 files due to their strand bias.
In sequence-based analysis, the output text files of STRait Razor were manually sorted into sequence-based alleles by markers in each population group using Excel. The repeat structure of each Y-STR was confirmed through allele sequence obtained from the STRbase (https://strbase.nist.gov/), and sequences of the flanking region were obtained from the NCBI 1000 genomes browser (https://www.ncbi.nlm.nih.gov/variation/tools/1000genomes/). Annotation of the SNPs observed in the flanking region was confirmed based on the NCBI SNP build 153 information.
STR genotyping by CE for data comparison
As a reference for the MPS data of 31 Y-STRs, conventional Y-STR genotyping based on CE was additionally performed. Genotypes of 105 Kor samples had been analyzed in a previous study.22 Those of the other populations were analyzed using the AmpFLSTR™ Yfiler™ PCR Amplification Kit for 17 loci (Thermo Fisher Scientific) and the Euplex-Y17 system, which is an in-house multiplex PCR system for 17 loci (Supplementary Fig. 1 and the detailed protocol was uploaded on our website; http://forensic.yonsei.ac.kr/protocols.html). Amplicons were separated using an Applied Biosystems® 3130 genetic analyzer (Thermo Fisher scientific) and genotypes were determined by comparing them with allelic ladders on Applied Biosystems® GeneMapper ID Software Version 3.2 (Thermo Fisher Scientific). Genotype concordance was compared between CE- and MPS-based data.
RESULTS
Sample and marker coverage
The generated libraries of 220 samples were successfully sequenced in several batches using MiSeq. The average sample read count was approximately 276,000, and the ratio of the highest to the lowest sample coverage was approximately 2.8 (485,212 and 175,772, respectively). Across all the 32 Y chromosomal markers in the panel, the average depth of coverage (DoC) was 7,219. In particular, a multi-copy locus DYF387S1 showed the highest DoC (12,581), followed by DYS390 and DYF404S1 (11,013 and 9,901, respectively). Further, the markers with the lowest DoC were DYS449 (1,776) and DYS518 (2,092); DYS19, DYS392, and DYS627 also showed relatively lower coverages (approximately 3,700). The maximum ratio across the markers was approximately 7 (Supplementary Fig. 2).
Genotype concordance between CE and MPS data
We obtained the genotypes of a total of 31 Y-STR markers and 1 Y-SNP included in the developed multiplex MPS panel, for comparison with CE data. Since all the samples were from unrelated males, all 220 male haplotypes were unique. Overall, a 99.94% concordance rate was observed for 32 Y chromosomal markers between the CE and MPS methods in this study (7,036/7,040). One sample with a null allele in both CE and MPS data was observed, and four different samples were discordant for genotypes between CE and MPS data (Supplementary Table 4). 1) In the DYS449 marker, two samples (NA17244 and NA17248) with heterozygous alleles showed discordance. In this case, heterozygous alleles 33 and 34 were genotyped in the CE results; however, only allele 34 could be genotyped in the MPS data. 2) In the DYS576 marker, two samples (NA17637 and NA17671) showed discrepancies. Those samples were genotyped as 17 and 18 from CE data, but not in MPS.
Sequence structure variation and allele gain
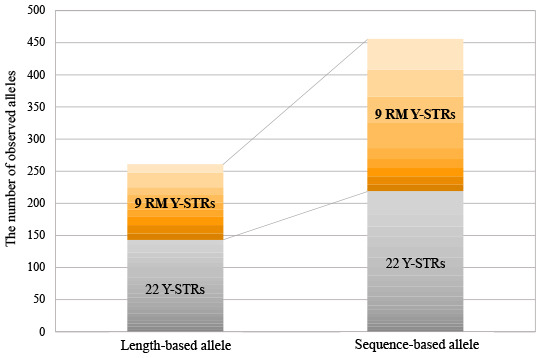
All sequence structures with allele frequency information are listed in Supplementary Table 5 for all populations, namely AfAm, Cauc, Hisp, and Kor. Excluding the four dropped out alleles in DYS449 and DYS576, the total number of alleles for the 31 Y-STRs across four populations increased 1.75-fold; the observed number of size-based alleles was 261, while that of sequence-based alleles was 456. Therefore, 195 alleles were newly identified in the sequence-based analysis. Seventeen of the 31 Y-STR loci exhibited identical length, although with different sequences. The 17 loci were identified by repeat region variations, and six of the 17 markers also showed flanking region variations.
Fig. 1 presents the number of length- and sequence-based alleles and the allele gain obtained by repeat and flanking regions for each marker in four populations. We particularly scrutinized the sequence structure of RM Y-STRs and confirmed more sequence allele variations. In total, 195 alleles increased due to sequence variations; only nine RM Y-STRs accounted for 119 alleles and the remaining 22 Y-STRs, except for RM Y-STRs, accounted for 76 alleles. There were two types of loci with sequence variations in repeat region: one with various combinations of the repeat numbers in iso-alleles (alleles with the same length but different sequences), and the other with nucleotide variation within the repeat block.
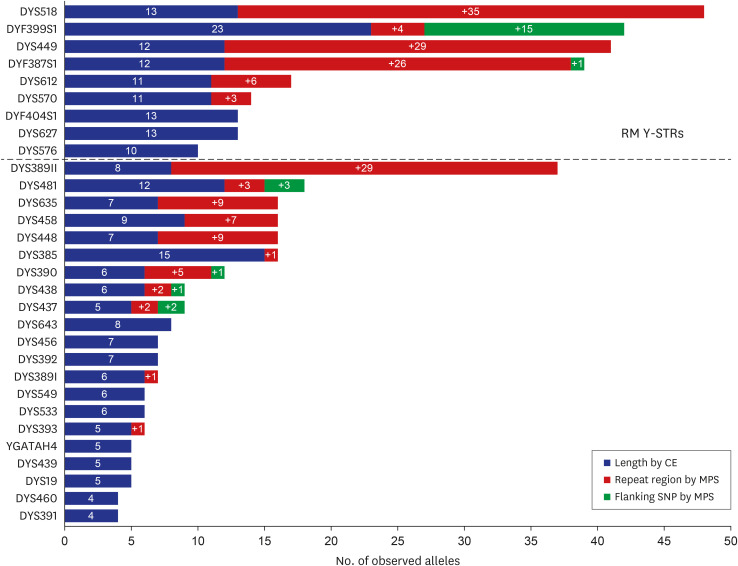
Fig. 1
Comparison of the number of observed alleles by CE and MPS analysis of 31 Y-STRs across four populations (n = 220). The blue bar presents the number of alleles by size-based method and the red bar presents the number of alleles observed by repeat region variations resulted from MPS method. The green bar presents the number of alleles observed by flanking region SNP resulted from MPS method. The nine RM Y-STRs used in this study are listed at the top of the figure.
CE = capillary electrophoresis, MPS = massively parallel sequencing, SNP = single nucleotide polymorphism, STR = short tandem repeat, RM = rapidly mutating.
![]()
The DYS518 marker showed the largest increases in the number of alleles due to repeat region variations (a 3.69-fold increase presenting two variable motifs (n, m), [AAAG]3 GAAG [AAAG]n GGAG [AAAG]4 gaagag [AAAG]m. For example, in the case of allele 39 (divided into seven iso-alleles), (n, m) showed various combinations, such as (17, 13), (16, 14), and (15, 15), and a structure with variation in repeat motif, like [AAAG]3 GAAG [AAAG]n GGAG [AAAG]4 gaagag [AAAG]m [GAAG]o (last AAAG motif to GAAG). In DYS449, a more than three-fold increase in the number of alleles and two variable motifs (n, m), [TTTC]n N50 [TTTC]m was observed. Allele 31 (divided into seven iso-alleles) consisted of not only (n, m) combinations, such as (15, 16) and (14, 17), but also the structure of [TTTC]2 TATC [TTTC]12 N50 [TTTC]16 (the second T to A in the TTTC motif) and CTTC [TTTC]15 N50 [TTTC]15 (the first T to C). Similarly, the number of allele gains in the DYF387S1 marker were from various combinations of the number of variable motifs (n and m). For instance, the allele 36 showed six different sequences, [AAAG]3 GTAG [GAAG]4 [AAAG]2 GAAG [AAAG]2 [GAAG]n [AAAG]m (n, m = 10, 13/9, 14, etc., Supplementary Table 5).
Flanking region SNPs were observed in six markers, DYF387S1, DYF399S1, DYS390, DYS437, DYS438, and DYS481. Detailed information on the position and frequency of each SNP is presented in Supplementary Table 6. In the DYF399S1 marker, two SNPs were observed in the 3′ direction of the repeat region, while the other markers had only one. Variations of rs4306075 (A>G, 1 nt away from repeat region 3′) and/or rs878949651 (A>G, 20 nt from 3′) were observed in all four populations. Further, SNPs were observed in a specific population. In the DYS437 marker, variation of rs9786886 (C>T, 3 nt from 5′) was seen in AfAm. In the DYF387S1 and DYS390 markers, unreported variation (G>A, 14 nt from 5′) and rs766823340 (T>G, 5 nt from 3′) were seen in Cauc, respectively. In the DYS438 marker, variation of rs7606133324 (A>C, 7 nt from 3′) occurred in Hisp. In the DYS481 marker, rs370750300 variation (G>T, 1 nt from 5′) was seen in Kor.
Supplementary Figs. 3, 4, 5, 6 shows the increase in the number of alleles for each population. RM Y-STRs presented a larger increase than the remaining Y-STRs in the number of alleles for each population. In addition, the ratio of the increased number of alleles by repeat region variations in DYS449 was higher in Kor (approximately 3.8-fold increase), than in the other populations (almost doubled). Moreover, increase by flanking region variation was the highest in AfAm (a 1.5-fold increase).
In Table 1 shows the organized sequence-based motifs obtained from the MPS results, as reported by Gettings et al.14 In the DYF399S1 marker, [GAAA]3 N7 [GAAA]n motif structure had higher frequency (39.20%) in the AfrAm population than in others. Additionally, the motif frequency of [TAGA]n [TACA]2 [TAGA]2 [TACA]2 [TAGA]n for DYS635 marker in Kor population was higher than that in the other populations, showing approximately 97.20% frequency. In the DYS437 marker, the motif structure [TCTA]n [TCTG]n [TCTA]n with rs9786886 SNP in AfAm had a higher frequency (58.80%). All sequences of the DYS458 marker in AfAm and Kor populations had the [GAAA]n reference repeat structure, although the sequences in the Cauc and Hisp populations had various alleles ([GAAA]n [GGAA]n, and [GAAA]n GGAA [GAAA]n).
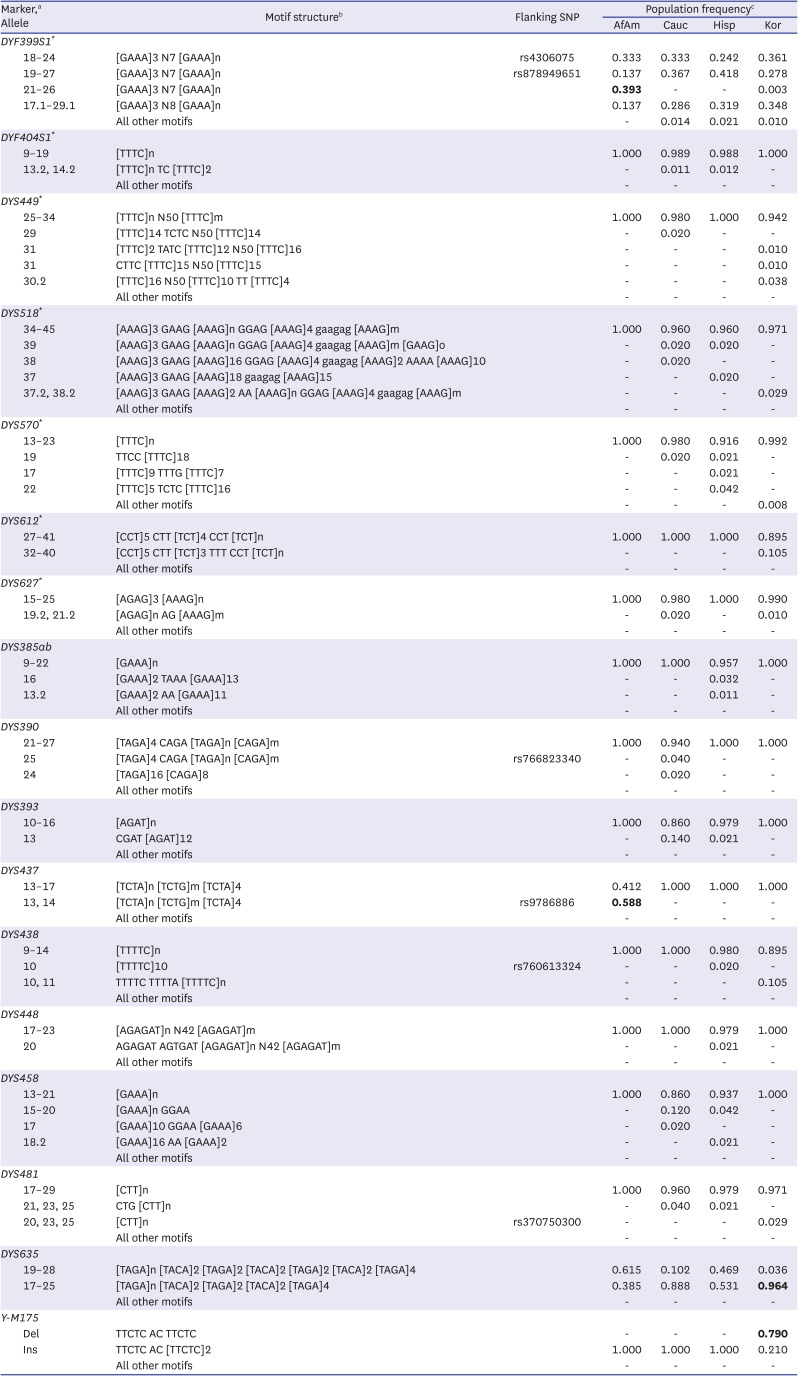
Table 1
Frequencies of sequence-based motif across four populations
SNP = single nucleotide polymorphism, AfAm = African Americans, Cau = Caucasians, Hisp = Hispanics, Kor = Korean, RM Y-STR = rapidly mutating Y-chromosomal short tandem repeat.
aMarkers are sorted in ascending order from RM Y-STRs. RM Y-STRs are marked with an asterisk; bThe sequence-based motif obtained from massively parallel sequencing method was organized as reported by Gettings et al.14 Motifs with more than 1% frequency at least in one population in each marker are indicated. Variable stretches are marked “n, m and o” and “all other motifs” is the sum of frequencies of less than 1% motif; cThe differences with more than 20% of the frequency compared to other populations are indicated as bold.
![]()
DISCUSSION
In summary, we observed a significant increase in the number of alleles from 261 (length-based, CE result) to 456 (sequence-based, MPS result) after using the in-house Y-chromosomal marker MPS panel containing nine RM Y-STRs; more than half of this increase was obtained from nine RM Y-STRs. Furthermore, the top 4 Y-STRs showing the most diverse alleles were the RM Y-STRs DYS518, DYF399S1, DYS449, and DYF387S1. Therefore, we especially scrutinized the sequence structure of RM Y-STRs and confirmed more sequence allele variations in repeat structures and flanking region SNPs.
In RM Y-STR, complex/compound repeats have shown a significant increase in the number of alleles due to various combinations in the number of repeat motifs and variations within the repeat motif. For example, the DYF387S1 marker included in the ForenSeq™ kit had many sequence allele gains with various combinations of the number of variable motifs (n and m). Allele 36 had six different sequences, [AAAG]3 GTAG [GAAG]4 [AAAG]2 GAAG [AAAG]2 [GAAG]n [AAAG]m (n, m = 10, 13/9, 14, etc., Supplementary Table 4). The result for DYF387S1 is in agreement with previous studies performed using the ForenSeq™ kit (not including DYS518 and DYS449 markers). As has been identified in many previous studies,13141516171819 most STRs with many sequence allele gains have a complex/compound repeat structure. However, the DYF404S1 and DYS576 markers with simple repeats, showed no increase in allele number. The DYS627 marker was an RM Y-STR and had a complex/compound repeat structure, with no increase in the number of alleles. This could be because n is primarily three in the [AGAG]n [AAAG]m structure, and only [AAAG]m could actually serve as a variable motif (like a simple repeat).
We further found that the sequence structure for PowerPlex® Y23 loci was similar to that of previous studies for the same loci using the MPS method.1517 In this study, seven of the 22 existing Y-STRs and six of the nine RM Y-STRs had complex/compound repeat structures and presented various sequences. Sequence diversity could detect variations within alleles and distinguish iso-alleles, rather than just length.7 Therefore, analyzing the highly polymorphic loci with complex/compound repeat structures having various combinations would be important in research on human genetic identification.71823
For flanking region SNPs, increased allele numbers were observed in only six Y-STRs, and the gains by SNPs were also smaller than those by repeat structure variations, except for DYF399S1 (Fig. 1). Intriguingly, the DYF399S1 marker showed the largest increases due to the SNPs in the flanking regions. As shown in Fig. 2, sequence-based alleles in DYF399S1 were distinguished. For example, allele 21 had the same [GAAA]3 N7 [GAAA]16 repeat structure, but showed five iso-alleles due to two observed SNPs (Supplementary Table 4).
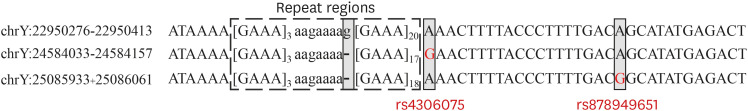
Fig. 2
Alignment of three sequence fragments of multi-copy DYF399S1 locus and SNP variation annotation. Bracketed motifs in repeat regions are counted for allele designation and lowercase letters in repeat regions are not counted as repeats. The left side shows the coordinates of the sequence in the Y chromosome. Gray boxes indicate nucleotides with sequence differences between fragments. The red letters indicate the SNPs that differentiate them into various alleles in the sequence-based analysis of DYF399S1. The rs number of each SNP is also shown (GRCh38 coordinates).
SNP = single nucleotide polymorphism.
![]()
Meanwhile, the relative differences of allele distribution were observed across four population groups. Although more data would need to be accumulated, the finding suggested that specific motifs with different allele distribution may be population-specific. In the DYS612 marker, [CCT]5 CTT [TCT]n TTT CCT [TCT]n motif was observed only in the Kor (10.5% frequency), as identified in the Kor population study (15% frequency),16 and was only shown in the Asian population by Novroski et al.24 The motif structure of the DYS635 marker with relatively higher allele distribution in the Kor population showed similar frequency (97.5%) in a previous study on other Kor populations.16
Just as the greatest increase in the number of alleles of the DYF399S1 marker was found in the AfAm, flanking region SNPs can provide increased resolution for specific populations by sequence analysis. Moreover, the DYS518.2 variant alleles observed in three Kor samples were also reported in other studies on East Asian samples, and all samples with this intermediate allele belong to the Y haplogroup Q.25262728 According to a previous study on the Korean population (n = 706),26 which included the Kor samples used in this study, all samples with DYS518.2 variant alleles belong to haplogroup Q-M242. This indicates that atypical alleles such as DYS518.2 variants could be associated with specific haplogroups.25262728 Identifying sequence variants would be particularly important and helpful in interpreting disproportionate mixed DNA samples, which are otherwise indistinguishable in the CE method.14
In this study, we obtained sufficient read counts above minimum DoC (> 100) to interpret the sequence-specific variants. In particular, one previous study13 had reported that the DYS518 marker has low amplification yield. However, the allele drop-out was not observed and the allele coverage was sufficient to interpret in our study, although DYS518 showed the second lowest coverage. Moreover, in studies using the ForenSeq™ DNA Signature Prep Kit,1924 the DYS392 marker with a trinucleotide repeat unit was difficult to interpret owing to its low coverage causing the allele to drop out. However, in the in-house MPS assay, all sequence-based alleles obtained from the DYS392 marker had more than 100 read counts and had not dropped out. The results overall indicated that the in-house MPS panel generated sufficient read counts with a strict criterion (> 100 reads) across all markers.
Further, we confirmed the genotype concordance between the CE and MPS results. Discordant alleles had two mechanisms; in the DYS449 marker with the lowest marker DoC, the relatively minor allele of heterozygous alleles had under minimum DoC threshold (100×) coverage and was therefore dropped out. Allele 33 (minor allele) was recovered by lowering the threshold (50×). In the DYS576 marker, one SNP (rs754193694) in the primer binding site was confirmed via Sanger sequencing including the MPS primer binding regions (Supplementary Table 4). Considering these issues, it is recommended to approach analysis with caution when interpreting the sample with null alleles and/or low coverage in terms of backward compatibility to CE-based genotypes.
We upgraded the in-house MPS panel by adding seven RM Y-STR loci and a DYS460 Yfiler™ Plus marker from the system to the previously studied panel (compatible with PowerPlex® Y23 system loci).17 The Y-STRs added to the upgraded panel were all RM Y-STRs, except for one marker (DYS460). The panel had a total of nine RM Y-STRs (DYF387S1, DYF399S1, DYF404S1, DYS449, DYS518, DYS570, DYS576, DYS612, and DYS627), and could analyze more RM Y-STRs than the ForenSeq™ DNA Signature Prep Kit with four RM Y-STRs (DYF387S1, DYS570, DYS576, and DYS612) and PowerSeq® 46GY System with two RM Y-STRs (DYS570 and DYS576). Further, the developed panel could produce smaller amplicons, ranging from 85–274 bp, compared to both the ForenSeq™ kit (119–402 bp)29 and PowerSeq® 46GY (140–300 bp).30 Therefore, reducing the sizes of amplicons could improve the interpretation of challenging samples, such as degraded DNA.10
In this study, sequence variations of a total of 31 Y-STRs, including nine RM Y-STRs, were identified for unrelated males. Compared to the CE method, sequence variations were observed in 17 Y-STRs and the number of alleles increased from 261 (size) to 456 (sequence), especially for RM Y-STRs (approximately double), which improved the discrimination power. Given the high sequence diversity of RM Y-STRs in this study, iso-allele differentiation through sequence analysis of RM Y-STRs demonstrated its potential to distinguish the unique profiles of closely relative males with the same haplotype. The sequence-specific data of numerous Y-STRs, especially RM Y-STRs, would provide meaningful data to related studies. This could also help to understand the characteristics of RM Y-STRs and conventional Y-STRs in forensic genetics. Finally, the compilation of sequence-based Y-STR data for worldwide populations would facilitate the application of MPS to solving male-related forensic cases.
 XML Download