

 PDF
PDF Citation
 Print
Print


INTRODUCTION
The number of patients visiting emergency departments (ED) reached 10 million per year in South Korea as of 2019.1 If the ED is overcrowded, many critical patients cannot be examined and treated by the best and quickest method in the right place and with sufficient medical resources.23 To solve this problem, the Korean Triage and Acuity Scale (KTAS) has been mandatorily applied at the ED in South Korea since 2016. The KTAS, which is based on the Canadian Triage and Acuity Scale (CTAS), consists of the following processes: 1) Check the ‘critical first look’ as soon as a patient arrives at the ED, 2) Screen for infectious disease, 3) Conduct triage assessment, 4) Select and document the presenting complaint of the patient, 5) Consider modifiers (e.g., consciousness, vital sign, pain, and other histories), and 6) Assign the triage level. In the KTAS decision process, there are 17 major classes, 167 main symptoms, and if we also consider modifiers, there are approximately 2,700 cases for the 5-level assignment decision tree. The goal is to triage a patient within 10 to 15 minutes of arrival.45 The 5-level triage tool, KTAS, is the most considerable predictor affecting the disposition of ED patients. The KTAS is associated with the average length of stay and mortality rate.56 The KTAS is a reliable triage tool, and KTAS scores determined by emergency nurses and experts are consistent in most cases.78 Also, the KTAS is preferred over triaging patients by Emergency Severity Index.9
This study was conducted to determine whether artificial intelligence can accurately classify KTAS levels and symptoms by extracting multivariate information from conversations between clinicians and emergency patients. Artificial intelligence has already been widely used and has shown remarkable performance in diverse areas such as medical imaging and diagnosis. The collaborative process of clinical science and data science is essential for accurate medical decision-making.10 Recent studies applied machine learning (ML) to predict the severity and hospitalization of patients at ED based on electronic health record (EHR). The machine learning approaches achieved high performance in predicting hospitalization for adult, children, and pediatric asthma patients.111213 Although multivariate logistic regression has been predominant in the field of medical statistics, in predicting the disposition of emergency patients, non-linear ML models, such as tree-based ensemble models, and deep neural networks, performed better than the logistic regression model.14 In addition, if natural language data is analyzed along with EHR, machine learning could more accurately predict the emergency patients' severity.1516 Although this machine learning approach showed high classification performance, it was challenging to interpret the decision of ML classifiers as in other areas. Several studies measured the feature importance for interpreting ML models. The mean impurity difference (MID) of complete RF nodes could be used to identify important features.1718 However, MID overestimates high cardinality features and cannot expand model interpretation to the test dataset. Other studies interpreted the model with the post-hoc analysis, permutation feature importance (PFI).192021 PFI is a model-agnostic methodology that can be used for interpretation regardless of the model type, and it allows model interpretation on both training data and test data. However, PFI always yields different results due to the random shuffling of the data. Recently, Shapley Additive exPlanations (SHAP) has been used to overcome this weakness and quantify the contribution of each feature in ML classification.2223 SHAP is an advanced algorithm that mathematically demonstrates the consistency and fairness of feature significance.
This preliminary study aimed to develop an automatic triage system using speech recognition and natural language processing (NLP) for the Korean language to save clinicians' precious time at ED. This study did not use EHR data as inputs of models, and the KTAS and symptoms were classified by analyzing bilateral conversations between clinicians and patients. This study used speech recognition models to transcribe the conversation and developed ML and deep learning-based classifiers that predict the KTAS and symptoms. This study also identified important words for the classification by measuring the game-theoretic feature importance, SHAP.
METHODS
Study design
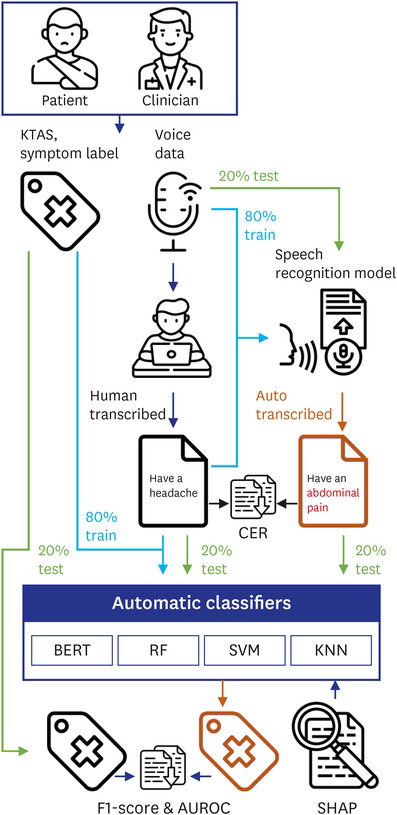
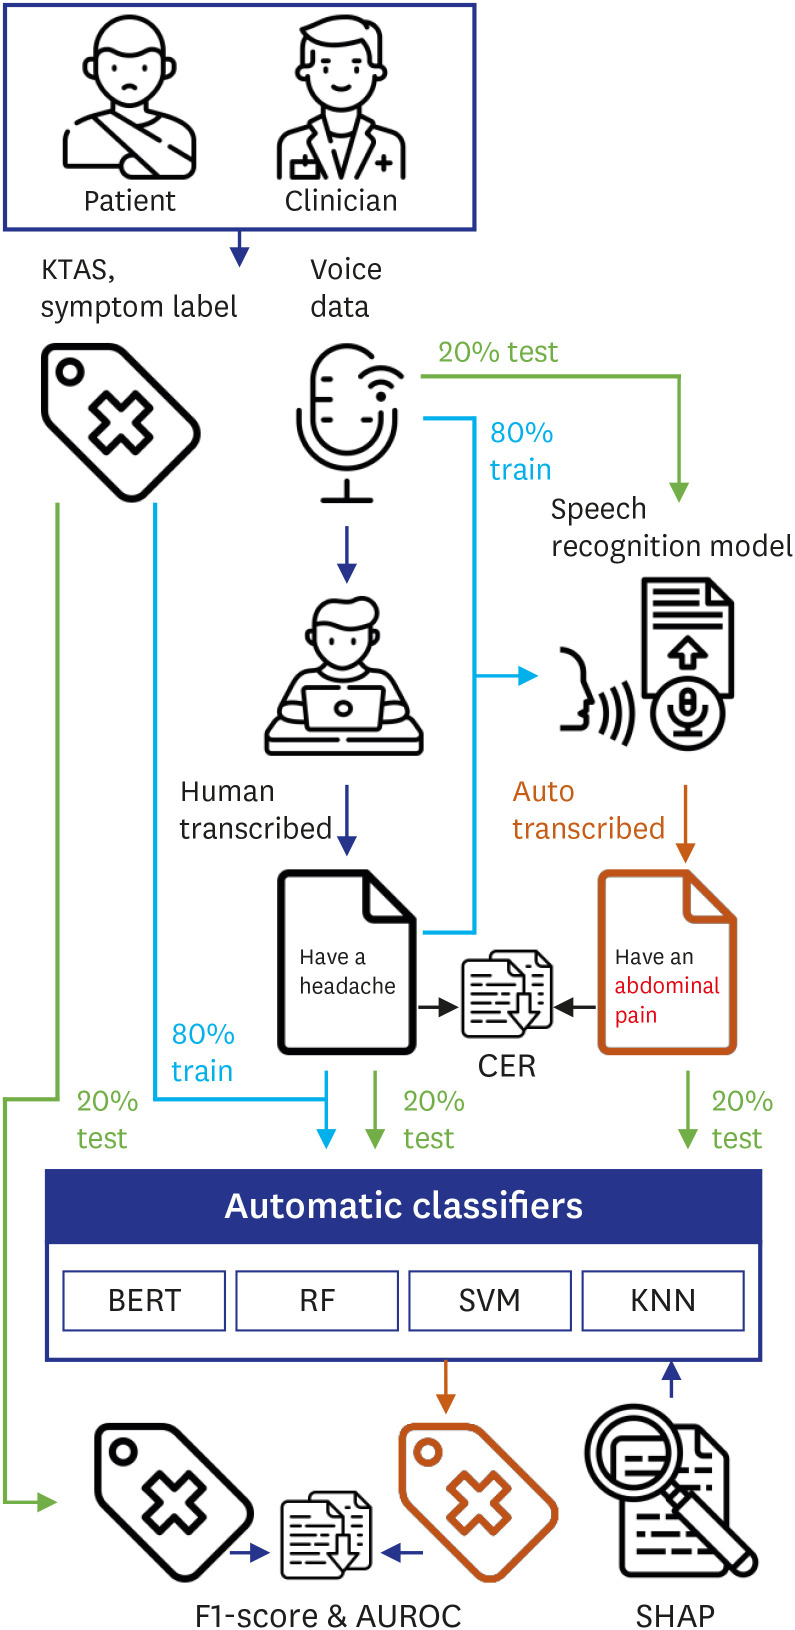
We conveniently selected 762 retrospective cases among conscious patients who visited the ED of Hanyang University Hospital between September and December 2019. We simulated the triage situation of each case based on the clinical records and recorded dialog during simulation. Each dialog represents a case between an emergency patient and a medical clinician. These data include necessary information for KTAS classification, such as signs of infectious diseases, symptoms, vital signs, pain scores, and other histories. This study's primary outcomes were based on three KTAS levels (2, 3, and 4) and six main symptoms (chest pain, dyspnea, fever, stroke, abdominal pain, and headache) that human clinicians have classified correctly. The six main symptoms accounted for 54.5% of internal medicine patients in the emergency medical center.24 For the speech recognition and classification task, we randomly split the overall dataset into a training dataset (80%) and a test dataset (20%). Fig. 1 shows our experimental system consists of four steps: 1) Voice data collection, 2) Automatic speech recognition, 3) Deep learning and ML-based classification, and 4) Analysis of word importance.
Fig. 1
Overall flow of the classification system in this study.
KTAS = Korean Triage and Acuity Scale, CER = character error rate, BERT = Bidirectional Encoder Representations from Transformers, SVM = support vector machine, KNN = k-nearest neighbors, RF = random forest, AUROC = area under the receiver operating characteristic curve, SHAP = Shapley Additive exPlanations.
Collection of voice data and human-transcribed scripts
We recruited twenty volunteers consisting of four emergency medical technicians, each having a certification of a KTAS classifier, and sixteen students from a university located in the capital area of South Korea and a university hospital in Seoul. The volunteers were older than 18 years of age and in good health status. Volunteers were excluded if they have a vocal cord or pulmonary/heart disease. The volunteers performed the given roles as if they were in a real case. Two commercial recorders (VTR6600; Philips, Amsterdam, Netherlands) were used to record the simulated dialogues, and each device was placed in front of the medical clinician or patient. After the voice data were collected, we recruited four undergraduate students from the Division of Electrical Engineering at Hanyang University, and they manually transcribed the simulated dialogues to generate human-transcribed scripts.
Automatic transcription: speech-to-text process
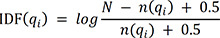
To automatically transcribe the dialogs, we trained speech recognition models (IBM-Custom-Speech and Microsoft-Custom-Speech) through a transfer learning algorithm. We converted a test set of dialogs into text documents and calculated the character error rate (CER), a general metric used to evaluate a Korean speech recognition model. The performance of a speech recognition model is better as the CER value decreases. The CER is a function defined as follows:
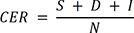
N is the total number of words in the ground-truth script, S, D, and I are substituted, deleted, and inserted characters in a speech recognition result to obtain the ground-truth script. Then, we statistically compared the error of speech recognition models using the McNemar's test.25 We calculated significant probabilities with a 2-tailed test. P values < 0.05 were considered statistically significant.
Training of the Bidirectional Encoder Representations from Transformers (BERT) model
The BERT is a deep learning-based NLP technique developed by Google, which showed superior performance in many NLP tasks.26 BERT consists of layers called bidirectional transformers that enable a classifier to grasp the context of the input sentences.26 As the original BERT model mainly focuses on English documents, we used the Korean Language Model (KorBERT) provided by ETRI (No. 2013-2-00131, Development of Knowledge Evolutionary WiseQA Platform Technology for Human Knowledge Augmented Services), which pre-trained a large number of Korean texts. Based on the KorBERT transformer layer, we developed a deep learning classifier called BERT-KTAS that simultaneously predicts KTAS and symptoms using text. We tokenized the whole transcripts as morphemes and used them as inputs of BERT-KTAS. BERT-KTAS refines the input tokens with its built-in embedding layer and then extracts information from inputs using transformer layers, finally performs classification by fully connected layers. We placed two fully connected layers behind the KorBERT transformers, one for KTAS classification and another for symptom classification. Each fully connected layer receives the encoded information from transformer layers and performs multi-class classification (three categories for KTAS levels and six categories for symptoms). In the training process, we tuned BERT-KTAS's hyperparameters (e.g., learning rate schedule, batch size, and train epochs) to maximize the area under the receiver operating characteristic curve (AUROC) using Grid Search and Warmup
Learning Rate Control.27 Further details of the structure and training processes of BERT-KTAS are provided in Supplementary Method 1.
Training of machine learning models
To compare with the BERT-KTAS, we also developed ML classifiers. ML is a high-level concept that includes deep learning, but in this study, ML refers to traditional ML models: support vector machine (SVM), k-nearest neighbors (KNN), and random forest (RF), which have been widely used in classification tasks. To enable these ML models to classify natural language, the pre-processing such as Feature selection and Word feature weighting had been preceded. First, we selected outcome-relevant words from the training dataset by maximal χ2 statistics.28 In our study, the domain of outcome was the set of all KTAS and symptom labels, , and the domain of inputs was the set of words in transcripts, . χ2 quantifies the difference of a word distribution for each label . We chose the first 100 words (noun, verb, adjective, and adverb) in the order of the magnitude of the χ2 statistic.
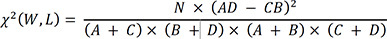
N is the number of all documents in the training dataset, A is the number of documents that include word W and belong to label L, B is the number of documents that include word W and do not belong to label L, C is the number of documents that do not include word W and belong to label L, and D is the number of documents that do not include word W and do not belong to label L.
Next, we converted the selected words to numeric vectors using Okapi BM25. Okapi BM25 showed better performance than other frequency-based word weighting techniques in the document clustering and categorization experiment.2930 In the BM25 equation, TF(qi) represents the frequency of the word (qi) in the text file (dj) and IDF(qi) calculates the weight of the word (qi)'s sparsity in the entire text.
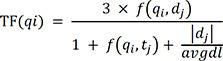
N is the number of documents in the dataset, qi is the i-th word in the set of selected words by χ2 statistics, n(qi) is the number of documents containing qi, f(qi,dj) is the qi's term frequency in document dj, |dj| is the length of document dj in words, and avgdl is the average document length in the dataset. We fitted the χ2 statistics and BM25 on the training dataset and transformed the test dataset using fitted expression. As a result, each document was converted to a 100-dimensional numerical vector and SVM, KNN, and RF classified these vectors. Unlike the BERT model, since ML cannot perform multi-output classification, KTAS levels and symptoms cannot be predicted simultaneously with one model. Thus, models for KTAS and symptoms were separately developed and evaluated. Also, since SVM is only capable of binary classification, we developed three SVMs for KTAS levels and six SVMs for symptoms. To derive predictions from SVMs, we selected the class with the highest prediction confidence among SVMs. We tuned the hyperparameters of each classifier to maximize the AUROC using 5-fold cross-validation and grid search. Further details of ML training process are explained in Supplementary Method 2.
Statistical analysis
We trained the classification models on the human-transcribed data and evaluated the models on the human-transcribed data and auto-transcribed data. We calculated the macro average of Recall (True positive/[True positive + False positive]), Precision (True Positive/[True positive + False negative]), F1-score (2 * Recall * Precision/[Recall + Precision]) and the AUROC to quantify the classification performance.31 Macro averaging is a method of averaging the evaluation metric results over an entire class. The 95% confidence interval (CI) was calculated using bootstrapping.32 To statistically compare the receiver operating characteristic (ROC) curves between BERT and other machine learning models, we conducted the DeLong's test.33 We calculated significant probabilities with a 2-tailed test. P values < 0.05 were considered statistically significant.
The models we used, such as SVM, RF, and BERT-KTAS, perform nonlinear operations, and this property complicates the models, making them difficult to be interpreted. Thus, we interpreted our classifiers using a game theory-based analysis method called SHAP, which is mathematically based on Shapely value, which is very consistent in the result and fair to identify feature importance. The Shapely is a function defined as follows:
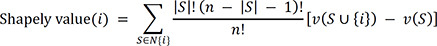
N is the set of features (words), n is the total number of features, S is a set (coalition) of features, and the function v(S) is the classifier's output when the coalition includes the features in S. The Shapley value is a game-theoretic metric that calculates the contribution of each participant for cooperation outcomes.34 SHAP interprets a machine learning model by approximating the shapely value of input variables.35 We approximated the Shapely value using coefficients of a linear model for ML and the permutationally distorted input word to approximate the Shapely value for BERT-KTAS. We conducted this study using NumPy,36 Scikit-learn,37 PyTorch in Python language.38
Ethics statement
This study was approved by the Institutional Review Board at Hanyang University Hospital (HYUH 2020-02-008-003). We designed a prospective and preliminary simulation study with scenarios developed from retrospective medical chart reviews. The study was carried out at the simulation room of Hanyang University Hospital (Seoul, Republic of Korea) in April 2020. The simulation participants were well informed of this study before the experiment and provided written consent.
RESULTS
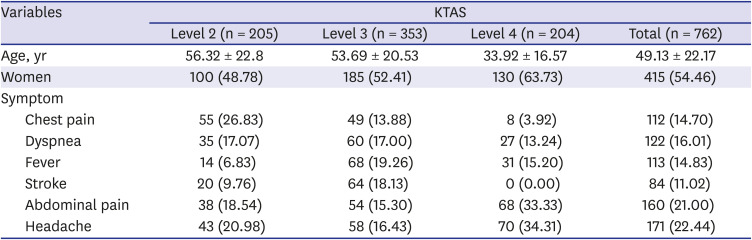
The baseline characteristics of participants who provided these cases are shown in Table 1. Of the 762 patients, KTAS level 2, level 3, and level 4 were 205, 353, and 204, respectively. There was no case of stroke in level 4 of KTAS.
Table 1
The demographic characteristics of study population
Speech recognition CER
The CERs of speech recognition models are shown in Table 2. IBM-Custom-Speech and Microsoft-Custom-Speech provide the transfer learning function, enabling us to further train the model based on the human-transcribed scripts. Through transfer learning, IBM, and Microsoft's CER were 25.21% and 30.8%, respectively. The results of McNemar's test show that the error rates between the two speech recognition models are significantly different (P < 0.05).

Classification over human-transcribed scripts
This result showed the classifiers' performance on human-transcribed test datasets. This experiment was the same as the experiment with an ideal speech recognition model with zero CER. Table 3 shows the result of classification on the human-transcribed documents. For the KTAS level, the SVM (AUROC, 0.9; 95% CI, 0.86–0.94), KNN (AUROC, 0.9; 95% CI, 0.85–0.94) and RF (AUROC, 0.9; 95% CI, 0.86–0.94) achieved higher performance than BERT-KTAS (AUROC, 0.85; 95% CI, 0.79–0.9) and P values of difference between the BERT-KTAS and the other models' AUROC (SVM, KNN, and RF) were 0.022, 0.014, and 0.016, respectively. However, for the symptom class, all performances were over 0.99 in AUROC and there is no statistically significant difference between them (all P > 0.05).
Table 3
Model performance with human-transcribed test dataseta
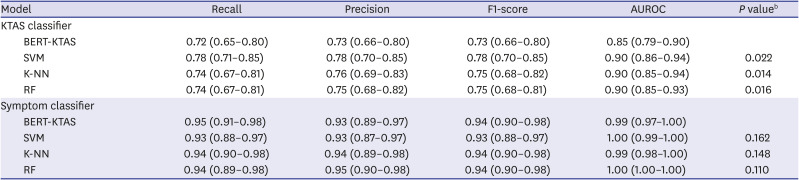
BERT = Bidirectional Encoder Representations from Transformers, KTAS = Korean Triage and Acuity System, SVM = support vector machine, K-NN = k-nearest neighbors, RF = random forest, AUROC = area under the receiver operating characteristic curve.
aAll performances are shown as mean (95% confidence interval); b
P value < 0.05 were considered statistically significant and derived from the Delong's test.
Classification over auto-transcribed scripts from speech recognition models
We also conducted the same experiment using the auto-transcribed scripts from speech recognition models. In this experiment, we could see the effect of CER of speech recognition models on the classification tasks. The performance of the overall classifiers decreased as CER increased. Table 4 shows the result of classification on the transcription of the IBM speech recognition model. In KTAS classification, the KNN achieved the highest AUROC (0.89; 95% CI, 0.85–0.93). In symptom classification, performance of all classifiers was similar, with AUROC greater than 0.98, but SVM was the highest in F1-score (AUROC, 0.9; 95% CI, 0.83–0.94). With the IBM speech recognition model, all P values of difference between BERT-KTAS and other models' AUROC were less than 0.05 in both KTAS and symptom classification. The list of classification performance with Microsoft speech recognition models is provided in Supplementary Table 1.
Table 4
Model performance with IBM's auto-transcribed test dataseta
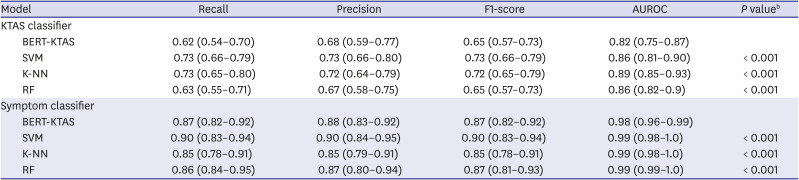
BERT = Bidirectional Encoder Representations from Transformers, KTAS = Korean Triage and Acuity System, SVM = support vector machine, K-NN = k-nearest neighbors, RF = random forest, AUROC = area under the receiver operating characteristic curve.
aAll performances are shown as mean (95% confidence interval); b
P value < 0.05 were considered statistically significant and derived from the Delong's test.
SHAP importance of models
Table 5 shows the top 5 medicine or symptom related nouns, verbs, adjectives, adverbs, and numbers for each model. The output of SHAP comes out as Korean morpheme stems, but we expressed it in words with appropriate endings. These are roughly the most important words of each classification model in each classification task, in descending order. BERT-KTAS mainly considered “hurt like it bursts,” “onset,” “hands are numb,” “symptom,” and “time” as important features for KTAS classification and considered “cold,” “hurt like it breaks,” “stomach,” “respiration,” and “very” for symptoms classification. Although BERT can capture the context, the vocabulary mainly used is less related to the actual KTAS and Symptom. The list of important words for ML was different from BERT-KTAS's result. When ML performed KTAS classification, “stress,” “chest,” “pain score point,” and “allergy” were important. In the symptom classification, words directly related to symptom classes such as “fever,” “breath,” “head,” “chest,” and “stomach” were important for ML.
Table 5
Ranking of important words of classification models
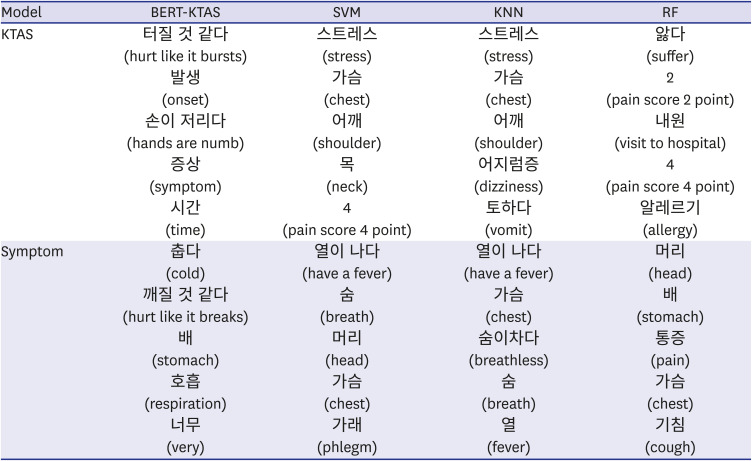
KTAS = Korean Triage and Acuity System, SVM = support vector machine, KNN = k-nearest neighbors, RF = random forest, BERT = Bidirectional Encoder Representations from Transformers, SHAP = Shapley Additive exPlanations.
aThe words are in descending order of the mean of the absolute values of the SHAP; bEach word is represented in Korean, and the translated vocabulary is represented in parentheses.
DISCUSSION
This preliminary study focused on the automatic KTAS classification using speech recognition, NLP, and artificial intelligence. Recent studies of the ML-based triage system showed high performance with text and numerical data in EHR.1516 Compared to these studies, we used voice data to triage emergency patients. We collected voice data from triage simulation and evaluated transfer-learned speech recognition models. According to a study, the error rate of the commercial Korean speech recognition models ranges from 16.29% to 61.43%.39 We obtained relatively low CER using transfer-learning. We developed a deep learning-based BERT-KTAS to classify the KTAS and main symptoms. This model automatically extracts useful information for the KTAS and symptom classification from input texts. Over auto-transcribed documents, BERT-KTAS achieved the AUROC 0.82 for KTAS classification. For the comparison with BERT-KTAS, we also developed ML-based classifiers with maximal χ2 statistics and BM25. With these processes, useful information for classification could be extracted before ML training. All the ML-based classifiers achieved AUROC greater than 0.86 with the auto-transcribed documents. In general, the performance with AUROC greater than 0.8 is evaluated as excellent discrimination.40
Deep learning is a neural network that includes multiple hidden layers and has the capacity to learn a complex pattern through the hierarchical nonlinear operation of sequential layers. However, the high complexity of the model tends to make itself overfit the training data, resulting in poor generalization ability in the test data.41 We improved the generalization performance of BERT-KTAS by applying the network dropout technique and a pre-trained model.42 Nevertheless, the prediction performances of BERT-KTAS were slightly lower than that of ML models on the auto transcribed data. The BERT pre-trained corpus contained 4.7 billion morphemes extracted from newspaper articles and encyclopedias. However, the corpus analyzed in the dialogue files of this study is from medical conversations between the patients and the clinicians, which is a specific and different domain from general articles and encyclopedias, and the vocabulary dictionary of BERT focused on general vocabularies rather than medical vocabularies. Therefore, the advantages of the pre-trained model were not fully exerted in KTAS prediction. On the other hand, ML models generally work better than deep learning on small datasets, with the help of curated features.43 Besides, the proposed ML models established word selection criteria directly from the prepared dataset through pre-processing. Therefore, the ML models were able to achieve better classification performance than BERT-KTAS in our study with relatively small datasets. Although BERT-KTAS achieved slightly lower AUROC than ML-based classifiers, BERT-KTAS does not require pre-processing necessary for ML-based classifiers because BERT has an embedding process built into the model. We expect that the generalization performance of BERT-KTAS will surpass ML in future large-scale problems with more classes and datasets.
The purpose of SHAP was to measure the contribution of word to KTAS or symptom classification by calculating the effect of each word on the model's prediction probability. The mathematical characteristics of SHAP (local accuracy, missingness, and consistency) support that this is a fair way to interpret the classification models using feature importance.35 According to the SHAP results, for the symptom classification, the vocabulary meaning the patient's symptom, such as “fever,” “breath,” “head,” “chest,” and “stomach,” were the important vocabulary. These words are directly related to the primary symptom outcomes of our study. However, the important vocabularies for the KTAS classification were different from the factors considered in actual human-aided KTAS. As mentioned above, since dictionary and pre-trained BERT were not targeted for medical domains, many medical vocabularies were split into sub-word tokens and could not be appropriately used for KTAS classification.44
There are several limitations to our study. First, although we have improved the performance of the speech recognition models through transfer learning, the CER of actual patients' voices could be higher. Therefore, future studies should collect more voice data and reduce the CER of speech recognition models through transfer learning. Second, our data contained only six main symptoms categories and three KTAS levels, so it is still insufficient to introduce this system to actual emergency departments. As our small-scale study was limited to simulated data as the first study, in the future, we will study our classification process to a large-scale dataset with actual patients and diverse KTAS levels and main symptoms to show the practicality of our classification process. We will also collect side information of patients (e.g., postures or moods) and analyze how the accuracies of classifiers can be increased by using these data as additional input features. Lastly, many factors considered in human-aided KTAS, such as patient first looks, respiration status, hemodynamic status, neurological status, were not identified as important words for classification in the SHAP results. To further improve the classification performance and model interpretation, studies on pre-processing technology to extract the actual KTAS related factors is needed.
In conclusion, this preliminary study showed the potential of developing an automatic classification system that directly classifies the KTAS level and symptoms from the conversation between patients and clinicians. This concept study will be helpful to reduce clinicians' workload at the ED. In a future study, we will first extract the factors related to KTAS from dialogues by developing a deep learning algorithm and then conduct classification based on these extracted factors.
 XML Download