

 PDF
PDF Citation
 Print
Print


INTRODUCTION
Obesity is an established risk factor for cardiovascular disease, diabetes mellitus (DM), impaired liver function and most of the metabolic diseases.1234 According to the World Health Organization (WHO), over 650 million adults (as many as 11% of men and 15% of women) were obese in 2016. In Korea, about 34% of the adult population (43% of men and 26% of women) were obese in a survey conducted by Korean Centers for Disease Control and Prevention (KCDC) in 2018. Over the past 4 decades, the global prevalence of obesity has increased dramatically.5 Diagnosis of obesity is commonly made based on body mass index (BMI). Though BMI has relation with body fat mass, it may simply overestimate people with high muscle to fat ratio and underestimate people with low muscle mass. In the same sense, it has been revealed that not all people who are obese develop metabolic disorders typically associated with obesity.67 Some studies have shown that some obese individuals are metabolically healthy,8 and only two-thirds of individuals with metabolic syndrome are obese.9 On the contrary, some normal weight individuals can have metabolic disease like type 2 DM.10
Recently, new concepts about obesity and normal weight subtypes with metabolic conditions have risen.69 Four phenotypes are defined as metabolically healthy normal weight (MHNW), metabolically healthy obese (MHO), metabolically unhealthy normal weight (MUNW), and metabolically unhealthy obese (MUO). It has been considered that each type has different risk for cardiovascular disease and so on. However, there is no uniform criteria for the definition of “metabolically healthy” and “metabolically unhealthy”. In this study, normal weight/obesity is defined based on BMI criteria and metabolically healthy/unhealthy was defined based on the national cholesterol education adult treatment panel III (ATP III) definition11 with modification of waist circumference (WC) for Koreans.
In times of extended fasting, low carbohydrate diet (below 20 g per day), and prolonged exercise, the human body's glucose reservations are insufficient to supply energy for the central nervous system (CNS).12 Fatty acids are not an appropriate energy source for CNS because they do not cross the blood-brain barrier, so the alternative energy sources, so called ketone bodies, are used in this situation. Ketone body production occurs mostly in the mitochondrial matrix of the liver.13 This process is named ketogenesis and the presence of ketone bodies in urine (via the elimination course of the ketone bodies) can indicate the change in energy metabolism, imbalance between ketone body production and consumption, prolonged fasting time, and many other physiological conditions. Ketone bodies are emerging as a significant indicator of metabolic health and recent studies have suggested that the presence of urinary ketones implies the superiority of metabolism, for example, obesity, central obesity, metabolic syndrome, dyslipidemia and type 2 DM.14
In this cross-sectional study, the relationship between 4 obesity and metabolic phenotypes (MHNW, MUNW, MHO, and MUO) and presence of urinary ketones were analyzed based on 5 years of Korea National Health and Nutritional Examination Survey data (KNHANES, 2013–2017).
METHODS
Data source and study subjects
This study used 5 years (2013–2017) of data from the KNHANES. KNHANES is a nationwide, population-based, cross-sectional health and nutritional survey conducted by the KCDC. KNHANES contains a health interview, health examination and nutritional survey about chronic disease and lifestyle. The survey includes approximately 10,000 subjects annually. Our study subjects were from the KNHANES 6th (2013–2015) and 7th (2016–2017), accounting for 8,018, 7,550, 7,380, 8,150, and 8,127 subjects, each year. Of the 39,225 subjects, 19,036 subjects (7,941 men and 11,095 women) were enrolled. The enrolled subjects were all over age 19, had samples taken after fasting for more than 8 hours and had data available for all markers of metabolic syndrome, body weight, height, urinary ketones, and total weighting (combination of health interview, health examination and nutritional survey weighting data). Subjects who met these criteria were excluded: subjects with a history of current cancers, current DM, fasting glucose level ≥ 126 mg/dL, glycated hemoglobin (HbA1c) ≥ 6.5%, and taking oral hypoglycemic agent (OHA) or insulin therapy, which could be possible factors for ketonuria. After these inclusion and exclusion criteria were applied, 19,036 subjects (3,622, 3,470, 3,780, 4,019, and 4,145 subjects, each year) were included in this study and regarded as the analysis group. All subjects included in this analysis were divided into 1 of 4 groups based on metabolic health (metabolically healthy and unhealthy) and BMI (normal weight and obesity) in each gender (MHNW, MHO, MUNW, and MUO). Of the 19,036 subjects, 7,941 subjects were men (MHNW [n = 4,271], MHO [n = 1,538], MUNW [n = 647], and MUO [n = 1,485]) and 11,095 subjects were women (MHNW [n = 7,143], MHO [n = 1,622], MUNW [n = 874], and MUO [n = 1,456]) (Fig. 1).
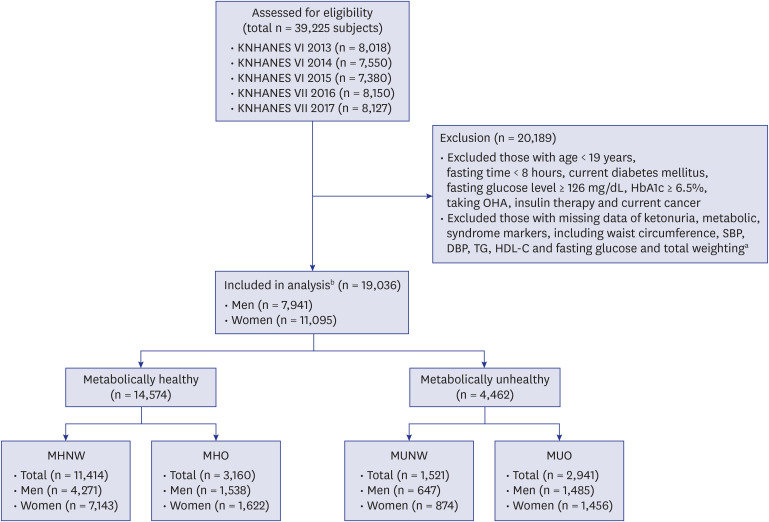
Fig. 1
Flowchart showing the selection and categorization of study subjects.
KNHANES = Korean National Health and Nutrition Examination Survey, BMI = body mass index, HbA1c = glycated hemoglobin, OHA = oral hypoglycemic agent, SBP = systolic blood pressure, DBP = diastolic blood pressure, TG = triglyceride, HDL-C = high-density lipoprotein-cholesterol, MHNW = metabolically healthy normal weight, MHO = metabolically healthy obese, MUNW = metabolically unhealthy normal weight, MUO = metabolically unhealthy obese.
aData from health interview, health examination and nutritional survey; bSubjects who did not meet the inclusion and exclusion criteria were not eliminated. Individuals who met all the inclusion and exclusion criteria were regarded as the analysis group.
![]()
Anthropometric and laboratory data
From the health examination survey, we obtained the data including BMI (kg/m2), WC (cm), systolic blood pressure (SBP) and diastolic blood pressure (DBP) (mmHg), fasting blood glucose (FBG) (mg/dL), HbA1c (%), total cholesterol (mg/dL), triglyceride (TG) (mg/dL), high-density lipoprotein-cholesterol (HDL-C) (mg/dL), low-density lipoprotein-cholesterol (LDL-C) (mg/dL), aspartate aminotransferase (AST) (IU/L), alanine aminotransferase (ALT) (IU/L), fasting time (hr), and urinary ketones. Data of HDL-C from different years was recalculated to minimize the gap that resulted from different laboratory conditions.
Presence of urinary ketones
Data regarding the presence of urinary ketones was shown in the health examination survey. If possible, first morning urine samples were used for analysis, otherwise, random spot urine samples were used. The urine samples were refrigerated (2°C–8°C) right away and laboratory analyses were done within 24 hours. Urinary ketones were measured by dipstick urinalysis using Urisys 2400 analyzer (Roche, Mannheim, Germany). Urinary ketone detection is categorized into 6 groups: negative (−), trace (+), and positive (1+ to 4+). The population with negative (−) urinary ketones is defined as the urinary ketone negative group and the trace (+) to positive (1+ to 4+) population are defined as the urinary ketone positive group.
Demographic features, clinical characteristics, and lifestyle questionnaires
Demographic features of age, gender and education level (under elementary school/middle school/high school/university) were included in this analysis. In the health interview survey, disease and lifestyle questionnaires are presented. History of current cancer includes gastric, hepatic, colon, breast, cervical, lung, thyroid and any other cancers. Type 2 diabetes was defined as a serum fasting glucose level ≥ 126 mg/dL, HbA1c ≥ 6.5%, using anti-diabetic medicine or a diagnosis of type 2 diabetes by a physician. Hypertension was defined as SBP ≥ 140 mmHg or DBP ≥ 90 mmHg, or the use of blood pressure (BP)-lowering medication. Regular alcohol drinkers were defined as those who drank alcohol more than once per month. All others were regarded as non-drinkers. Current smokers were defined as those who were currently smoking and had smoked more than five packs of cigarettes during their whole life. All others were regarded as ex-smokers or non-smokers. Aerobic exercises were defined as the practice of more than 2 hours 30 minutes of moderate-intensity physical activity or 1 hour 15 minutes of high-intensity physical activity or a mixture of moderate and high intensity physical activity. Sleep time per day, taking oral contraceptives and menopause status were also evaluated. Before merging the KNHANES (2013–2015) 5-year data, new variables for menopause and sleep time were generated because KNHANES questionnaires were not the same every year. From the nutritional survey, data about calorie intake (kcal/day) was acquired. Also, we used the information about daily intake of carbohydrates (g/day), fats (g/day), and proteins (g/day).
Definition of metabolic and obesity phenotypes
Obesity was defined according to the WHO Asian criteria (BMI ≥ 25 kg/m2).15 In this study, we classified subjects as normal weight if BMI < 25 kg/m2 and as obese if BMI ≥ 25 kg/m2. Underweight individuals (BMI ≤ 18 kg/m2) were regarded as normal weight individuals and included in this analysis. Metabolically unhealthy subjects were defined based on ATP III definition11 with modification of WC for Koreans. ATP III criteria with modification of WC for Koreans are as follows: abdominal obesity, defined as WC ≥ 90 cm in men or ≥ 85 cm in women16; TG ≥ 150 mg/dL, or drug treatment for dyslipidemia; HDL-C < 40 mg/dL in men or < 50 mg/dL in women; SBP ≥ 130 mmHg or DBP ≥ 85 mmHg or taking anti-hypertensive agent; and FBG ≥ 100 mg/dL, or use of anti-diabetes medication. Subjects were defined as metabolically healthy if they met none or less than any 3 criteria and metabolically unhealthy if they met 3 or more of the criteria. Based on WHO and modified ATP III criteria, the subjects were categorized into 4 groups, as follows; MHNW, MHO, MUNW, and MUO.17
Data management and statistical analysis
Before merging the KNHANES (2013–2015) 5-year data, new variables for menopause and sleep time were made because KNHANES questionnaires were not the same every year. After the comparison among those different years' KNHANES data, the data merge was done. KCDC recommended complex sample analysis of the KNHANES data by stratification, clustering, and unequal selection probabilities. As KNHANES data was complex sample data, subjects who did not meet the inclusion and exclusion criteria were not eliminated. Individuals who met all the inclusion and exclusion criteria were regarded as the analysis group. KNHANES total weighting data was used to calculate the composite weighting data through 2013–2017 KNHANES data. Composite weighting data was calculated by multiplying the total weighting data by one-fifth for each year (2013–2017).
Data was analyzed using SPSS complex sample analysis and calculated composite weighting data was used. Continuous variables are presented as mean ± standard errors; general linear model under complex sample analysis was used to compare the mean values of the variables including age, height, weight, BMI, WC, SBP, DBP, fasting glucose, HbA1c, HDL-C, TG, total cholesterol, LDL-C, AST, ALT, daily calorie intake, daily carbohydrate/fat/protein intake, and daily sleep time. Categorical variables are presented as unweighted number of cases (weighted %) (No. [%]); χ2 test under complex sample analysis was used to compare the frequency of education level, alcohol drinking status, current smoking status, practice of aerobic exercise, using oral contraceptives, menopause status and presence of ketonuria. Complex logistic regression analysis was used to evaluate the odds ratio (OR) for the presence of urinary ketones according to the metabolic and obesity phenotypes before and after adjustment with some significant influencing factors to ketonuria. The P value < 0.05 was considered statistically significant. Complex sample analyses were performed with SPSS (version 25.0; SPSS Inc., Armonk, NY, USA).
RESULTS
Basic metabolic and clinical characteristics are shown in Table 1. The characteristics were compared between men and women and the analysis demonstrated a significant difference between them. The mean age of men and women was 43.7 and 46.6 years old, respectively. Presence of urinary ketones was 485 (7.1%) and 656 (6.9%) respectively. All parameters showed a significant difference between men and women (P < 0.05), except HbA1c, LDL-C, sleep time and presence of urinary ketones.
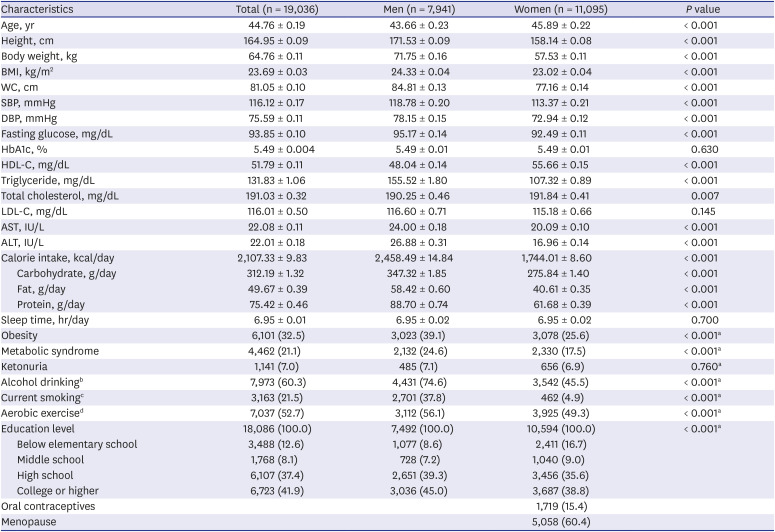
Table 1
Comparison of general characteristics by gender
Values are expressed as mean ± standard error for continuous data or unweighted number (weighted %) for categorical data after data weighting by complex sample analysis. P-values are presented by general linear model under complex sample analysis without adjustment.
BMI = body mass index, WC = waist circumference, SBP = systolic blood pressure, DBP = diastolic blood pressure, HbA1c = glycated hemoglobin, HDL-C = high-density lipoprotein-cholesterol, LDL-C = low-density lipoprotein-cholesterol, AST = aspartate aminotransferase, ALT = alanine aminotransferase.
aP values are presented by χ2 test under complex sample analysis without adjustment; bAlcohol drinkers are defined as the population who consumed more than a drink of alcohol in a month, within a year; cCurrent smokers are defined as the population who smoked more than 100 cigarettes throughout their lifespan; dAerobic exercise is defined as the practice of more than 2 hours 30 minutes of moderate-intensity physical activity or 1 hour 15 minutes of high-intensity physical activity.
![]()
General characteristics and P values were compared between 2 groups according to the presence of urinary ketones in men and women, respectively (Tables 2 and 3). General characteristics such as age, height, BMI, WC, SBP, DBP, fasting glucose, HbA1c, HDL-C, AST, daily carbohydrate intake, obesity, metabolic syndrome (including all of its subcategories except high BP), current smoking status, practice of aerobic exercise, and education level showed a significant difference between the ketonuria negative and ketonuria positive groups without adjustment in men (P < 0.05). After adjustment with age, daily sleep time, alcohol drinking status, current smoking status, practice of aerobic exercise, and education level for men, age, body weight, BMI, fasting glucose, HbA1c, HDL-C, TG, daily calorie intake, and daily carbohydrate intake showed a significant difference between the 2 groups in men (P < 0.05). In women, nearly all general characteristics were significantly different between the urinary ketone positive group and urinary ketone negative group before adjustment in women (P < 0.05). After adjustment with age, daily sleep time, alcohol drinking status, current smoking status, practice of aerobic exercise, education level, menopause status, and using oral contraceptive pill, some characteristics were still significantly different in women; age, body weight, BMI, WC, fasting glucose, HbA1c, HDL-C, TG, total cholesterol, daily carbohydrate intake, and daily protein intake (P < 0.05).
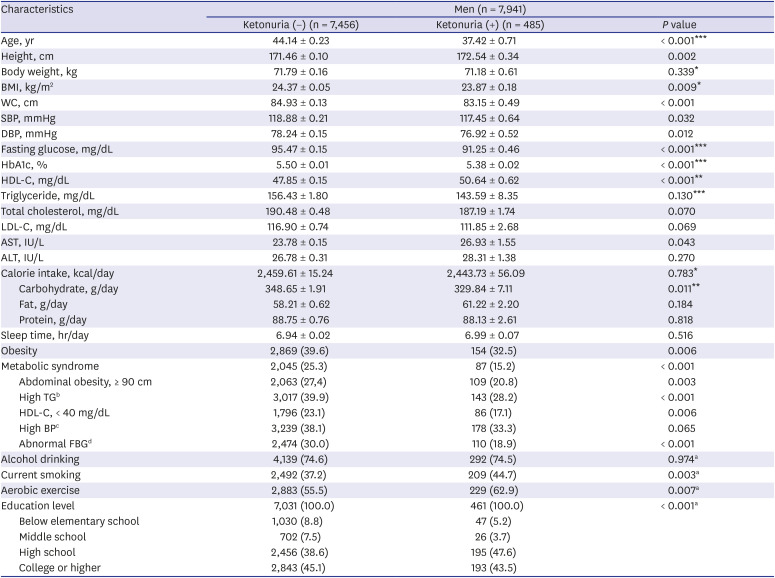
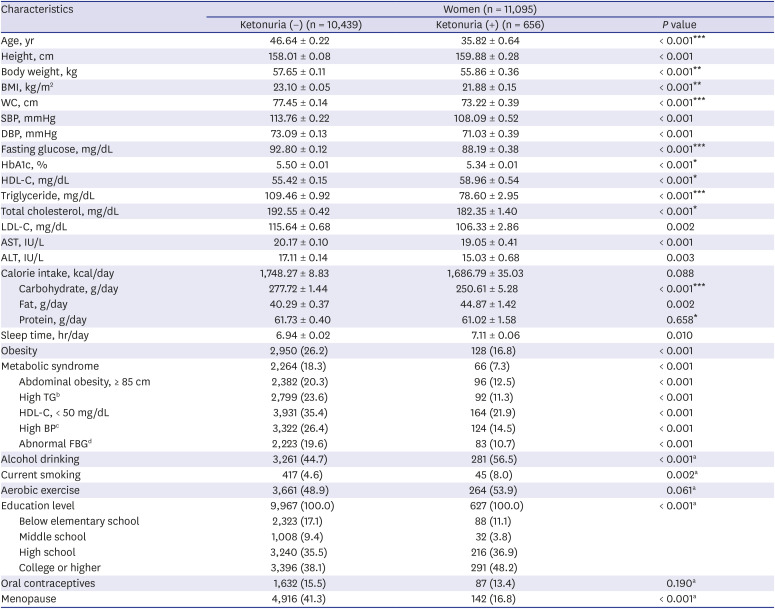
Table 2
Comparison of general characteristics in relation to the presence of urinary ketones in men
Values are expressed as mean ± standard error after data weighting by complex sample analysis or number (%). P values are presented by general linear model under complex sample analysis without adjustment.
BMI = body mass index, WC = waist circumference, SBP = systolic blood pressure, DBP = diastolic blood pressure, HbA1c = glycated hemoglobin, HDL-C = high-density lipoprotein-cholesterol, LDL-C = low-density lipoprotein-cholesterol, AST = aspartate aminotransferase, ALT = alanine aminotransferase, TG = triglyceride, FBG = fasting blood glucose, DM = diabetes mellitus.
aP values are presented by χ2 test under complex sample analysis without adjustment: bTG ≥ 150 mg/dL or drug treatment for dyslipidemia; cSBP ≥ 130 mmHg, DBP ≥ 85 mmHg or drug treatment for HTN; dFBG ≥ 100 mg/dL or drug treatment for DM. *P < 0.05, **P < 0.01, ***P < 0.001 by general linear model under complex sample analysis after adjustment with age, daily sleep time, alcohol drinking status, current smoking status, practice of aerobic exercise and education level for men.
![]()
Table 3
Comparison of general characteristics in relation to the presence of urinary ketones in women
Values are expressed as mean ± standard error after data weighting by complex sample analysis or number (%). P-values are presented by general linear model under complex sample analysis without adjustment.
BMI = body mass index, WC = waist circumference, SBP = systolic blood pressure, DBP = diastolic blood pressure, HbA1c = glycated hemoglobin, HDL-C = high-density lipoprotein-cholesterol, LDL-C = low-density lipoprotein-cholesterol, AST = aspartate aminotransferase, ALT = alanine aminotransferase, TG = triglyceride, FBG = fasting blood glucose, DM = diabetes mellitus.
aP values are presented by χ2 test under complex sample analysis without adjustment; bTG ≥ 150 mg/dL or drug treatment for dyslipidemia; cSBP ≥ 130 mmHg, DBP ≥ 85 mmHg or drug treatment for HTN; dFBG ≥ 100 mg/dL or drug treatment for DM. *P value < 0.05, **P value < 0.01, ***P value < 0.001 by general linear model under complex sample analysis after adjustment with age, daily sleep time, alcohol drinking status, current smoking status, practice of aerobic exercise, education level, using oral contraceptive pill and menopause status for women.
![]()
Differences in general characteristics related to metabolic conditions, social status and lifestyle features, including alcohol drinking status, current smoking status, practice of aerobic exercise, educational level, taking oral contraceptives, and menopause status were compared among metabolic and obesity groups. Those groups were divided into 4 groups in both genders; MHNW, MHO, MUNW, and MUO (Supplementary Tables 1 and 2). All parameters except daily carbohydrate intake among groups were significantly different in men before adjustment. All continuous variables were still significantly different after adjustment in men except for daily calorie/carbohydrate/fat/protein intake. Before adjusting, all features except daily carbohydrate intake and current smoking status were significantly different in women. After adjustment with age, daily sleep time, alcohol drinking status, current smoking status, practice of aerobic exercise, educational level, taking oral contraceptives, and menopause status in women, age, height, body weight, BMI, WC, SBP, DBP, fasting glucose, HbA1c, HDL-C, TG, total cholesterol, LDL-C, AST, and ALT variables showed P value lower than 0.05.
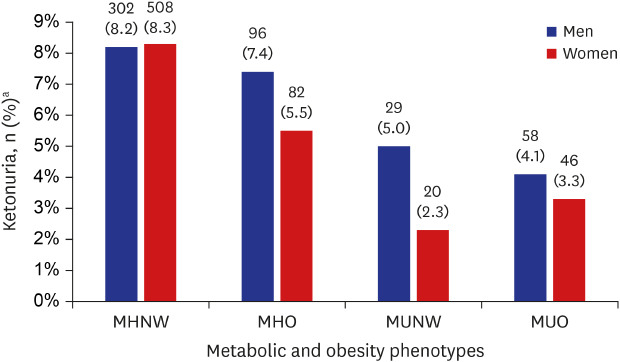
As shown in Fig. 2, No. (%) for the presence of ketonuria in the MHNW, MHO, MUNW and MUO groups were 302 (8.2%), 96 (7.4%), 29 (5.0%), and 58 (4.1%) in men, respectively, showing statistical significance (P < 0.05). Also, in women, No. (%) for the presence of ketonuria in the MHNW, MHO, MUNW and MUO groups were 508 (8.3%), 82 (5.5%), 20 (2.3%), and 46 (3.3%), respectively, with statistical significance (P < 0.05). In both genders, the MHNW and MHO groups in which the subjects did not have metabolic syndrome showed a higher prevalence of ketonuria compared to the MUNW and MUO groups in which the subjects had the feature of metabolic syndrome. Also, in metabolic healthy phenotypes (MHNW and MHO groups), prevalence of ketonuria was higher in the MHNW group in both genders. In men, the MUNW group showed a higher prevalence of ketonuria than the MUO group (5.0% and 4.1%, respectively). On the other hand, the MUO group showed a higher prevalence of ketonuria than the MUNW group in women (3.3% and 2.3%, respectively).

Fig. 2
Proportion of ketonuria in each metabolic and obesity phenotype.
P value < 0.001 both in men and women; P value is calculated by χ2 test under complex sample analysis.
MHNW = metabolically healthy normal weight, MHO = metabolically healthy obese, MUNW = metabolically unhealthy normal weight, MUO = metabolically unhealthy obese.
aValues are presented as unweighted number (weighted %).
![]()
OR and confidence interval (CI) of the presence of urinary ketones with or without adjustment in relation to the metabolic and obesity groups were shown in Table 4. In crude model, ORs of ketonuria in the MHO, MUNW, and MUO groups compared to the MHNW group were 0.895 (95% CI, 0.681–1.177), 0.594 (95% CI, 0.391–0.903), and 0.484 (95% CI, 0.356–0.658), respectively, in men (Model 1, men). By complex general linear analysis, age, AST, ALT, daily fat/protein intake, sleeping time, alcohol drinking status, current smoking status, practice of aerobic exercise, and education level were significantly associated with metabolic and obesity type in men (Supplementary Table 1). After adjustment with these factors, described above, the ORs of ketonuria in the MUNW, MHO, and MUO groups were 0.866 (95% CI, 0.608–1.233), 0.815 (95% CI, 0.485–1.368) and 0.391 (95% CI, 0.254–0.601) in men (Model 2, men). After adjustment, only the MUO group's OR showed significantly lower urinary ketones than the MHNW group. In women, ORs of the presence of urinary ketones in the MHO, MUNW, and MUO groups were 0.649 (95% CI, 0.488–0.864), 0.258 (95% CI, 0.156–0.426) and 0.375 (95% CI, 0.266–0.528) compared to the MHNW group, respectively, in women (Model 1, women). All categories showed statistically significant ORs in Model 1. By complex general linear analysis, age, AST, ALT, daily fat/protein intake, sleeping time, alcohol drinking status, aerobic exercise, education level, using oral contraceptives, and menopause status were significantly associated with metabolic and obesity types in women (Supplementary Table 2). Adjustment was done with these variables, and the calculated ORs were MHO (OR, 0.698; 95% CI, 0.486–1.002), MUNW (OR, 0.467; 95% CI, 0.226–0.966), and MUO (OR, 0.801; 95% CI, 0.512–1.254) (Model 2, women). Significant difference in ORs were still valid in the MUNW group after adjustment. Furthermore, in men, OR of MHO and MUNW were 0.866 (95% CI, 0.608–1.233) and 0.815 (95% CI, 0.485–1.368), and in women, OR of MHO and MUNW were 0.698 (95% CI, 0.486–1.002) and 0.467 (95% CI, 0.226–0.966). Based on the OR of MHO and MUNW, it could be assumed that metabolic health status had a greater effect on the presence of ketonuria than obesity.
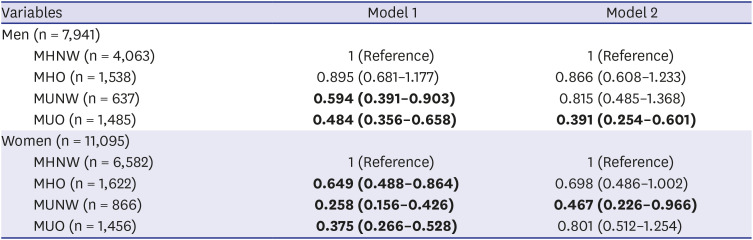
Table 4
The odds ratio of the presence of ketonuria according to the metabolic and obesity types
Values represent the odds ratio with a 95% confidence interval by logistic regression under complex sample analysis. Model 1: before adjustment. Model 2: after adjustment with age, AST, ALT, daily fat intake, daily protein intake, daily sleep time, alcohol drinking status, current smoking status, practice of aerobic exercise and education level for men and after adjustment with age, AST, ALT, daily fat intake, daily protein intake, daily sleep time, alcohol drinking status, current practice of aerobic exercise, education level, using oral contraceptives and menopause status for women. The bold number is the odds ratio, which does not include 1 in confidence interval.
MHNW = metabolically healthy normal weight, MHO = metabolically healthy obese, MUNW = metabolically unhealthy normal weight, MUO = metabolically unhealthy obese, AST = aspartate aminotransferase, ALT = alanine aminotransferase.
![]()
DISCUSSION
The association among obesity and metabolic phenotypes with the presence of ketonuria was analyzed in this cross-sectional study. In this study, relatively healthy individuals were analyzed and individuals with ketonuria were younger, leaner (low body weight ant BMI) and showed more favorable results in variables related to metabolism. The MHNW group showed the highest No. (%) of presence of ketonuria in both men and women. In both genders, metabolically healthy phenotypes (MHNW and MHO groups) showed a higher prevalence of ketonuria compared to metabolically unhealthy phenotypes (MUNW and MUO groups). In the same manner, compared to the MHNW group, the MUO group showed lower presence of ketonuria in men, and tendency to have less ketonuria in women.
Obesity has a relation with general health concerns and increased mortality. Obese people are at risk of developing co-morbidities including cardiovascular disease, type 2 DM and cancers.1 Recently, new classification of obesity and metabolic phenotypes were suggested because it has been recognized that not all people with obesity have metabolic disorders commonly associated with obesity.18 Simultaneously, there are people with normal weight but at increased risk for metabolic disorders such as type 2 DM.10 Traditional concepts that obesity has a relationship with metabolic diseases have been circumvented by the new approach of the obesity phenotypes; MHNW, MHO, MUNW, and MUO. New concepts that obesity is categorized into MHNW, MHO, MUNW, and MUO has been carefully considered in relation with metabolic syndrome.
There are several studies that revealed the risk and superiority of metabolic markers and disease among those obese and metabolic subtypes. In a 5.4 year cohort study, metabolically unhealthy subjects had a higher risk of coronary heart disease (CHD) (hazard ratio [HR], 1.49; 95% CI, 1.45–1.54), cerebrovascular disease (CVD) (HR, 1.07; 95% CI, 1.04–1.11) and heart failure (HF) (HR, 1.96; 95% CI, 1.86–2.06) compared with metabolically healthy normal weight subjects. Incidence of CHD, CVD, and HF was increased together with the number of metabolic abnormalities.19 People with metabolically unhealthy obesity are at high risk of cardiovascular disease and DM compared with people with metabolically healthy obesity.20 One study revealed that there were metabolites such as L-kynurenin, glycerol 1-phosphate, and glycolic acid that show differences between the MHO and MUO groups. Those metabolites are involved in principle metabolic pathways like fatty acid biosynthesis, representatively.20 Further on, there was analysis that myocardial dysfunction was related more strongly with metabolically unhealthy phenotypes rather than simple BMI.21 One study showed that even if metabolic health is maintained during long periods of life time, obesity remains a risk factor for cardiovascular disease.22 Interestingly, a large proportion of metabolically healthy women's phenotypes were changed into unhealthy types after 10 or 20 years in all BMI categories (84% of women with obesity and 68% of women with normal weight).22 Cardiovascular risk was increased higher in women with metabolically healthy obesity than metabolically healthy normal weight.22
Ketone bodies (acetoacetate, β-hydroxybutyrate, and acetones) are small molecules that are derived from fatty acids. Ketone body production is increased commonly in times of fasting and the ketogenesis occurs mostly in the mitochondrial matrix of the liver. Energy-restricted metabolic situations like intermittent fasting or having carbohydrate-restricted diets are naturally associated with ketogenesis and result in the presence of urinary ketones which is one of the clinical features that physicians can understand of the metabolic status of ketogenesis. There were several studies that ketonuria in relatively healthy non-diabetic individuals indicated metabolically healthy status comparing to negative ketonuria groups. In a 12 year longitudinal study in Korea, the relationship between the presence of spontaneous fasting ketonuria was associated with a low risk of DM (HR, 0.63; 95% CI, 0.41–0.97) and subjects with ketonuria show lower glucose level after loading of glucose.23 We already have reported the results that the healthy obese group with the presence of ketonuria get more reduction in body weight, BMI, and waist circumference compared to the non-ketonuria group.24 In one study conducted during the Muslim fasting period, most of the obese individuals did not show ketonuria after more than 20 days of fasting, on the other hand, the normal weight group showed ketonuria after 3–6 days of fasting.25 Some mechanisms to understand the role of ketone bodies in metabolic process were suggested. Three-hydroxy-3-methylglutaryl coenzyme A synthase 2 (HMGCS2) is a representative enzyme which is produced in the metabolic process called ketogenesis.26 Peroxisome proliferator-activated receptor alpha (PPARα) and fibroblast growth factor 21 (FGF 21) are upregulated during ketogenesis and they are considered as important factors that regulate glucose metabolism and have preventive effect on DM.2728 Second, β-hydroxybutyrate activates adenosine monophoshate (AMP) kinase in hepatocyte, leading to the increased insulin sensitivity.29 Ketone bodies may have an impact on oxidative stress and regulation of inflammation.30 All of those mechanisms with ketone bodies have positive effects on the metabolic process.
As above, the presence of urinary ketones was different according to the individuals' metabolic status and obesity. Metabolically healthy normal weight individuals showed a higher proportion of positive ketonuria than metabolically unhealthy obese individuals in this study. In men, the MUNW group had a higher rate of ketonuria than the MUO group, but in women, the rate of ketonuria was higher in the MUO group than in the MUNW group. Ketonuria tends to be produced better with younger age, however, according to the status of menopausal women, the association between metabolic status, obesity, and ketonuria is not very strong. Therefore, it is assumed that in women, the MUNW group is older and has a higher proportion of postmenopausal women than the MUO group, which is the reason why the MUNW group has a smaller proportion of ketonuria than the MUO group. Likewise, for men, the OR of the MUNW and MUO groups tends to decrease as they become fatter. For women, however, the OR of the MUNW group, on the contrary, was lower than that of the MUO group, which could have been a major cause of inclusion in any menopausal women, who dilute the relationship between metabolic status, obesity and ketonuria.
Also, the MHNW group showed higher urinary ketones than the MUO group and the MUNW and MHO groups showed no significant difference in the presence of urinary ketones compared to the MHNW group in men. These results suggested that there were some interactions between obesity and metabolic conditions. As well, these results implied that the presence of urinary ketones was influenced not only by obesity, but also the individuals' metabolic conditions. The study showed individuals' obesity and metabolic phenotypes could be changed over time22 and it implied that there was underlying interaction between obesity with metabolic healthy conditions and transient status between MHNW and MUO in a way. In women, ketonuria in the MUNW groups was lower than the MHNW group, nearly 0.5 times. On the other hand, the MUO group's OR was 0.801 (95% CI, 0.512–1.254) compared to the MHNW group. These results were due to the lack of complete control over the effects of menopausal status, pregnancy in women, stress factors, and so on which could have an effect on the presence of urinary ketones.
The present study has several limitations. First, the definition of metabolically healthy and unhealthy is not clear enough to discriminate the phenotypes of obesity and metabolically unhealthy individuals at risk. Second, chronic disease, stress factors or status of pregnancy could have an effect on the presence of urinary ketones, but these clinical conditions were not completely excluded, which can lead to the over or under estimation of the presence of urinary ketones. Finally, it was a cross-sectional study so causality could not be induced in this analysis.
In conclusion, the presence of urinary ketones was different according to the individuals' metabolic status and obesity. Compared to the MHNW group, the MUO group showed lower presence of ketonuria in men, and tendency to have less ketonuria in women. In other words, this study suggested that metabolically healthy and normal weight individuals show higher ketonuria and supported the emerging role of ketone bodies as a significant parameter of metabolic health and weight.
 XML Download