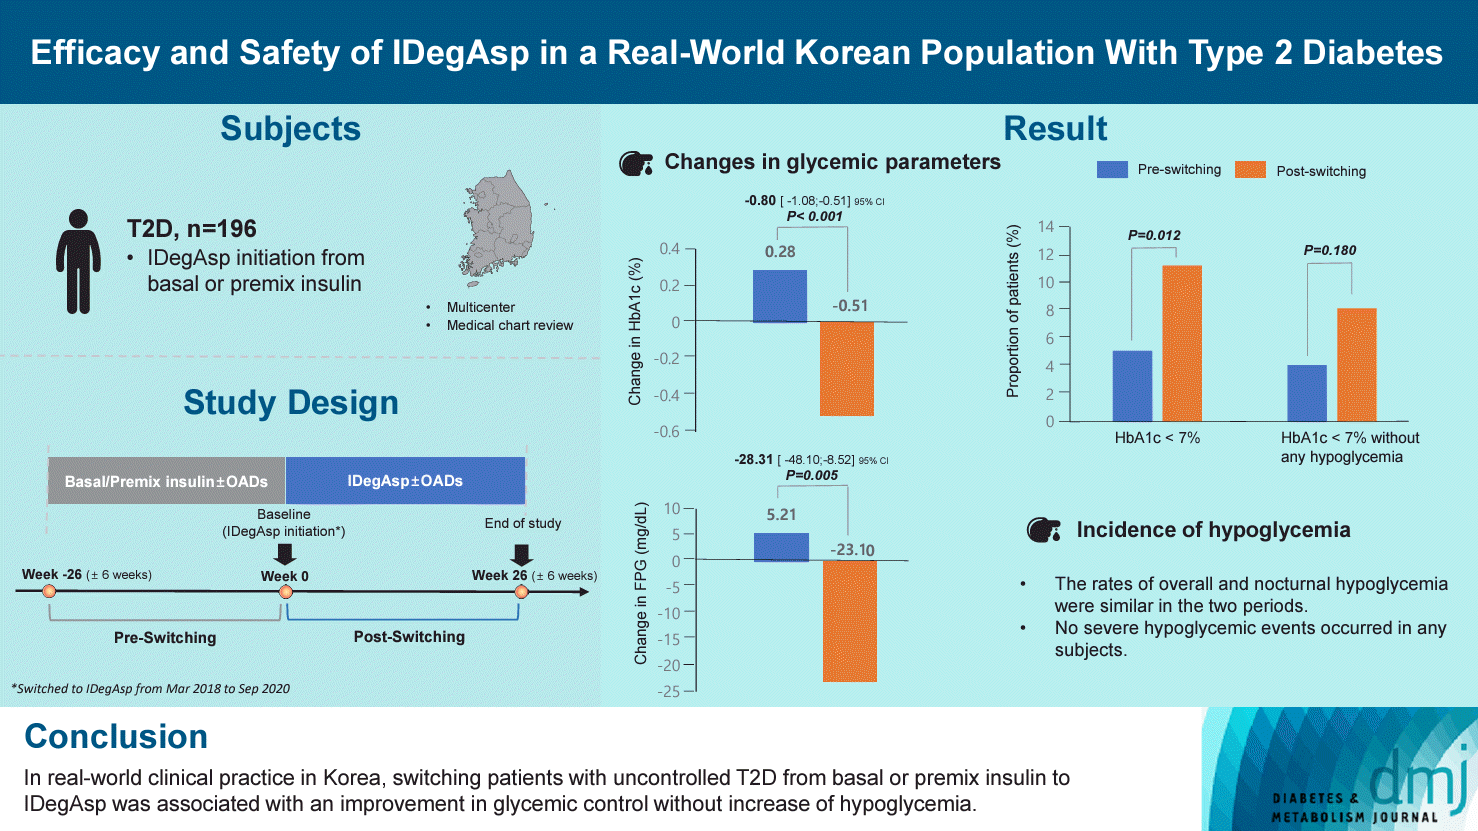
Highlights
INTRODUCTION
METHODS
RESULTS
Baseline characteristics of the study population
Table 1.
Values are presented as mean±standard deviation or number (%).
T2DM, type 2 diabetes mellitus; BMI, body mass index; HbA1c, glycosylated hemoglobin; FPG, fasting plasma glucose; LDL-C, low-density lipoprotein cholesterol; HDL-C, high-density lipoprotein cholesterol; IDegAsp, insulin degludec/insulin aspart.
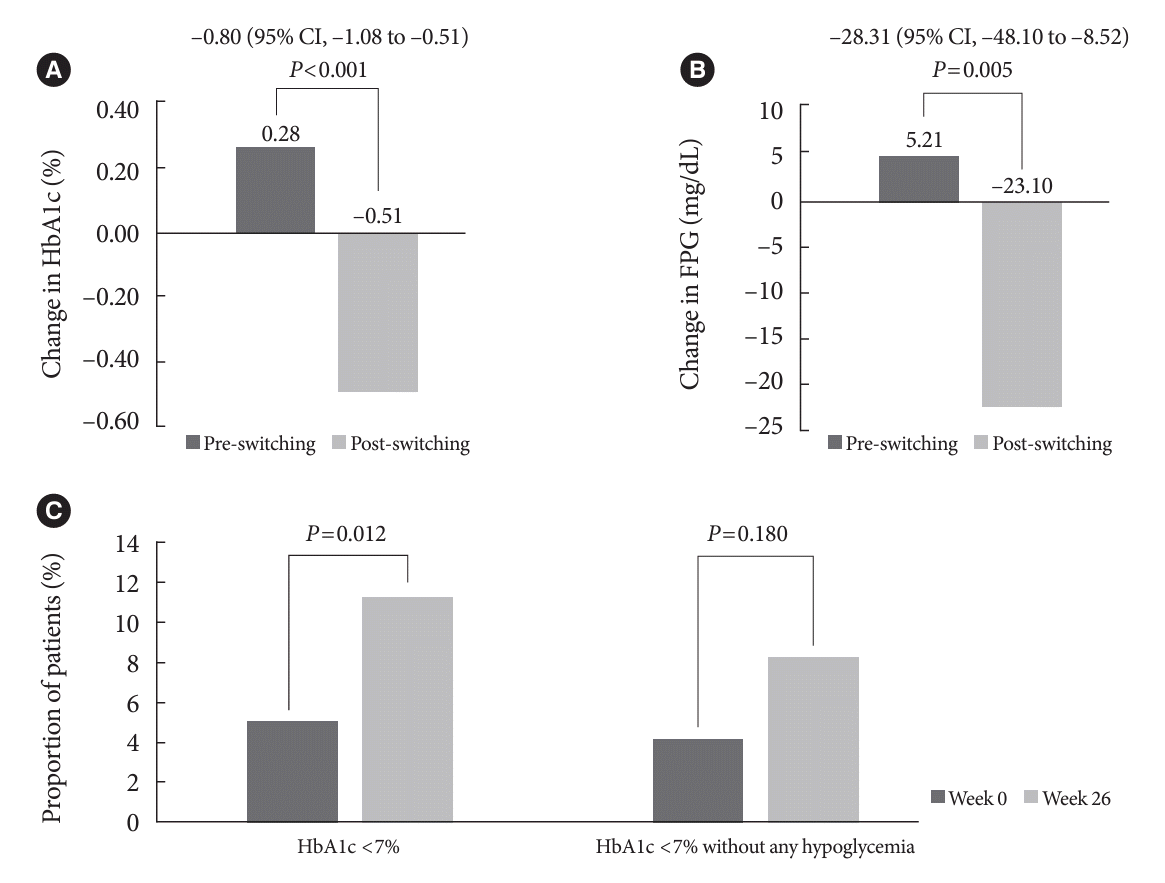
Glycemic control after switching to IDegAsp
Fig. 1.

Table 2.
| Variable |
Pre-switching |
Post-switching |
P valuea,b (pre- vs. post-switching) | ||||
|---|---|---|---|---|---|---|---|
| Week –26 | Week 0 | P valuea | Week –26 | Week 0 | P valuea | ||
| HbA1c, % | 8.50±1.31 | 8.78±1.25 | 0.002 | 8.78±1.25 | 8.27±1.17 | <0.001 | - |
| Change in the 26-week period | 0.28±1.27 | - | –0.51±1.12 | - | <0.001 | ||
| FPG, mg/dL | 158.03±63.98 | 163.24±65.64 | 0.369 | 163.24±65.64 | 140.15±55.37 | <0.001 | - |
| Change in the 26-week period | 5.21±80.41 | - | –23.10±78.65 | - | 0.005 | ||
| Proportion of achieving HbA1c <7% | 18 (9.18) | 10 (5.10) | 0.057 | 10 (5.10) | 22 (11.22) | 0.012 | - |
| Proportion of achieving HbA1c <7% without any hypoglycemia | 6 (4.08) | - | 12 (8.16) | - | 0.180 | ||
| Body weight, kg | 69.11±13.54 | 69.74±13.97 | 0.010 | 69.74±13.97 | 69.75±13.74 | 0.980 | - |
| Change in the 26-week period | 0.63±2.84 | - | 0.01±2.36 | - | 0.113 | ||
| Daily total insulin dose, U | 37.42±21.80 | 39.15±20.92 | 0.079 | 39.15±20.92 | 41.14±22.91 | 0.001 | - |
| Change in the 26-week period | 1.72±13.69 | - | 1.98±8.54 | - | 0.828 | ||
| Daily total insulin dose, U/kg | 0.53±0.27 | 0.56±0.28 | 0.075 | 0.56±0.28 | 0.58±0.29 | 0.024 | - |
| Change in the 26-week period | 0.03±0.18 | - | 0.02±0.11 | - | 0.765 | ||
Changes in body weight and total daily insulin dose post-switching to IDegAsp
Incidence of hypoglycemia
Table 3.
| Variable | Pre-switching | Post-switching | P valuea |
|---|---|---|---|
| Overall hypoglycemic events | 34 (23.13) | 32 (21.77) | 0.860 |
| Severe hypoglycemic events | 0 | 0 | NA |
| Nocturnal hypoglycemic events | 6 (4.76) | 6 (4.76) | 1.000 |
Clinical predictors of HbA1c improvement during the post-switching period
Table 4.
Values are presented as unstandardized coefficients (B) and standardized coefficient (β) using multiple regression analysis (Enter method of independent variables). Dependent variable was baseline value in HbA1c at week 0; R square (adjusted R square): 0.315 (0.279); F=8.74. This analysis was performed using multiple regression (Enter method of independent variables).
HbA1c, glycosylated hemoglobin; IDegAsp, insulin degludec/insulin aspart; BMI, body mass index; T2DM, type 2 diabetes mellitus.


 PDF
PDF Citation
 Print
Print


 XML Download