Journal List > Ann Lab Med > v.44(6) > 1516088445

Lee, Choi, Kim, Im, Hwang, Yang, Lee, Lee, Song, Park, and Song: Detecting M-Protein via Mass Spectrometry and Affinity Beads: Enrichment With Mixed Kappa-Lambda Beads Enables Prompt Application in Clinical Laboratories

Abstract

Background

Detecting monoclonal protein (M-protein), a hallmark of plasma cell disorders, traditionally relies on methods such as protein electrophoresis, immune-electrophoresis, and immunofixation electrophoresis (IFE). Mass spectrometry (MS)-based methods, such as matrix-assisted laser desorption/ionization time-of-flight (MALDI-TOF) and electrospray ionization-quadrupole time-of-flight (ESI-qTOF) MS, have emerged as sensitive methods. We explored the M-protein-detection efficacies of different MS techniques.

Methods

To isolate immunoglobulin and light chain proteins, six types of beads (IgG, IgA, IgM, kappa, lambda, and mixed kappa and lambda) were used to prepare samples along with CaptureSelect nanobody affinity beads (NBs). After purification, both MALDI-TOF MS and liquid chromatography coupled with Synapt G2 ESI-qTOF high-resolution MS analysis were performed. We purified 25 normal and 25 abnormal IFE samples using NBs and MALDI-TOF MS (NB-MALDI-TOF).

Results

Abnormal samples showed monoclonal peaks, whereas normal samples showed polyclonal peaks. The IgG and mixed kappa and lambda beads showed monoclonal peaks following the use of daratumumab (an IgG/kappa type of monoclonal antibody) with both MALDI-TOF and ESI-qTOF MS analysis. The limits of detection for MALDI-TOF MS and ESI-qTOF MS were established as 0.1 g/dL and 0.025 g/dL, respectively. NB-MALDI-TOF and IFE exhibited comparable sensitivity and specificity (92% and 92%, respectively).

Conclusions

NBs for M-protein detection, particularly with mixed kappa-lambda beads, identified monoclonal peaks with both MALDI-TOF and ESI-qTOF analyses. Qualitative analysis using MALDI-TOF yielded results comparable with that of IFE. NB-MALDI-TOF might be used as an alternative method to replace conventional tests (such as IFE) to detect M-protein with high sensitivity.

INTRODUCTION

Monoclonal protein (M-protein) is produced by plasma cells and indicates an abnormal increase of clonal cells [1]. M-protein is a characteristic feature of plasma cell disorders (PCDs), including multiple myeloma (MM), smoldering MM, non-IgM monoclonal gammopathy of undetermined significance (MGUS), IgM MGUS, light chain MGUS, solitary plasmacytoma, solitary plasmacytoma with minimal marrow involvement, and systemic amyloid light chain amyloidosis [2].
Protein electrophoresis (PEP), immune-electrophoresis (IEP), and immunofixation electrophoresis (IFE) have been used to evaluate the M-protein [3]. PEP is a cost-effective method employed in clinical laboratories to quantify the M-protein [4]. IFE is a sensitive method for identifying M-proteins and determining the immunoglobulin type (IgG, IgA, IgM, IgD, or IgE) and the light chain type (kappa or lambda), which is key for diagnosing and monitoring hematological diseases [5]. Free light chain (FLC) assays sensitively measure free kappa and lambda light chains and detect abnormalities in light chain production [6]. An integrated approach comprising PEP, IFE, and FLC showed significantly improved sensitivity [7]. However, PEP, IEP, and IFE are susceptible to various interfering substances, such as antibiotics, therapeutic monoclonal antibodies (t-mAbs), and radiocontrast agents [8]. Differences between laboratories in their applications are persistent issues [9]. An excessively high FLC level can induce a prozone effect, leading to a falsely low result, whereas light chain polymerization can result in overestimated FLC levels [10].
Mass spectrometry (MS) shows promise for M-protein detection [11, 12] and has undergone major advancements over the past decade [13]. Matrix-assisted laser desorption/ionization time-of-flight (MALDI-TOF) and electrospray ionization-quadrupole time-of-flight (ESI-qTOF) MS have been employed in several studies for M-protein detection [14, 15]. Both techniques utilize nanobody affinity beads (NB) for sample preparation and have been validated [16]. MALDI-TOF-based detection can be more sensitive than IFE, potentially offering an effective method for detecting M-protein [17].
We optimized an MS approach for detecting M-protein in clinical laboratories and minimizing the operational burdens. We developed a novel qualitative method for detecting the M-protein involving kappa and lambda NBs using both MALDI-TOF MS and ESI-qTOF MS. In addition, we explored the M-protein-detection efficacies of different MS techniques.

MATERIALS AND METHODS

Sample collection and reagents

Residual t-mAbs (daratumumab, cetuximab, and rituximab) were provided by Seoul National University Hospital (Seoul, Korea). The Institutional Review Board at SNUH approved the use of residual serum samples after routine tests (approval number 2303-053-1441). The serum samples were stored at −80°C and transferred to a regular freezer (−15 to −23°C) the day before use. The samples were aliquoted before freezing, and multiple freeze–thaw cycles were avoided.
Dithiothreitol (DTT), Tris-2-carboxyethlphosphine hydrochloride (TCEP), and formic acid (FA) were purchased from Sigma-Aldrich (Steinheim, Germany). Acetonitrile (ACN) was purchased from Burdick & Jackson (Muskegon, MI, USA). HPLC-grade deionized water was from the MilliQ device (Millipore, MA, USA). Dulbecco’s phosphate-buffered saline was obtained from WelGENE, Inc. (Daegu, Korea).

Sample preparation

A Melon Gel Spin Kit (Thermo Fisher Scientific, Inc., MA, USA) was used for IgG purification according to the manufacturer’s instructions. Twenty microliters of serum was diluted 1:10 with purification buffer and added to a spin column containing 200 μL settled gel resin. For reduction, 20 μL purified IgG was incubated with 20 μL 40 mM TCEP in 0.2% trifluoroacetic acid (TFA) for 15 min. Reduced IgG was then desalted using C4 ZipTip (Millipore, MA, USA). Fifty microliters of DynaBeads magnetic beads (MBs; Thermo Fisher Scientific, Inc.) was mixed with 2 μL serum, followed by elution and reduction with 200 mM DTT in 0.1% TFA. A magnetic bar was used to remove the MBs.
Five types of CaptureSelect affinity resins (Thermo Fisher Scientific, Inc.), including IgG (catalog number 194328010), IgA (194288010), IgM (195289010), kappa (19421010), and lambda (294375010) resins were used to purify IgG, IgA, IgM, kappa, lambda, and mixed kappa and lambda (KnL). For IgG purification, 20 μL IgG nanobody affinity beads (NBs) was mixed with 2 μL daratumumab diluted in serum. To test patient samples, 20 μL NBs (IgG, IgA, IgM, kappa, lambda, and KnL) was incubated separately with 2 μL serum for 30 min at room temperature (RT) on a shaker. Before using the NBs, the storage buffer was replaced with phosphate-buffered saline (PBS). The NB samples were washed thrice with 200 μL PBS and thrice with 200 μL distilled water (DW). For elution and reduction, we incubated the NBs with 20 mM TCEP in 0.1% TFA for 30 min at RT on a shaker.

High-resolution MS analysis

High-resolution assays were conducted using liquid chromatography (LC)-ESI-qTOF MS, following enrichment with NB technology. The average molecular masses of the t-mAbs (daratumumab and cetuximab) were calculated from the known amino acid sequences of their kappa light chains. In addition, normal and abnormal patient samples were analyzed using high-resolution MS.
A 50 μL solution of t-mAbs was treated using two different methods after immunoglobulin enrichment. In the first treatment, t-mAbs were incubated with 10 μL DTT (100 mM) at 55°C for 30 min to reduce their disulfide bonds. The buffer was changed to MS-grade water for native MS measurements, after which FA was added. For the second treatment (after the DTT reduction step), 20 μL iodoacetamide (IAA) (200 mM) was added, and the sample was incubated at RT in the dark for 1 hr. Following reduction and alkylation, the buffer was changed to MS-grade water and acidified with FA. We subjected patient serum samples (50 μL) to the first treatment method after immunoglobulin enrichment.
To obtain native MS measurements, we performed high-resolution MS analysis with an AQUITY UPLC system coupled to a Synapt G2-HDMS mass spectrometer (Waters, Manchester, UK), using MassLynx 4.1 software (Waters, Manchester, UK).
Chromatographic separation was performed using an ACQUITY UPLC Protein BEH C4 Van Guard Pre-column (2.1 μm, 2.1 mm×5 mm; Waters, Wexford, Ireland) and a BioResolve RP mAb Polyphenyl analytical column (2.7 μm, 2.1 mm×100 mm; Waters, Wexford, Ireland) with mobile phases A and B consisting of water and acetonitrile with 0.1% FA, respectively, and a flow rate of 0.4 mL/min. The chromatographic gradient of mobile phase B was as follows: 0–3 min, 3%; 14 min, 95%; 16 min, 3%; 18 min, 95%; 20 min, 3%; 22 min, 95%; 24 min, 3%; and 30 min, 3% (total run time: 30 min). The extracts were analyzed in positive-ion mode using an ESI source, covering m/z ratios of 500 to 4,000.
Additional optimized MS parameters were used, including a capillary voltage of 2.5 kV, a cone voltage of 40 V, a source temperature of 140°C, and a desolvation-gas flow rate of 500 L/hr. The acquired multiple-charge profiles were deconvoluted using the MaxEnt 1 (Waters, Manchester, UK) algorithm. Chromatograms and spectra were obtained using MassLynx 4.1 software.

MALDI-TOF MS analysis

Normal serum was selected as the negative control and prepared in the same way as the samples. The positive control was prepared by adding daratumumab to normal serum (final concentration: 0.5 g/dL). The calibrator was prepared by reducing 0.025 g/dL rituximab with 20 mM TCEP in 0.1% TFA.
For matrix preparation, 1 mL TA50 (ACN: 0.1% TFA=50:50) was prepared by mixing ACN and 0.1% TFA at a 50:50 ratio. We prepared a saturated solution of α-cyano-4-hydroxycinnamic acid (CHCA) matrix (Bruker Daltonics, Bremen, Germany) by adding 10 mg CHCA to an Eppendorf tube, dissolving it in 1 mL TA50, and vortexing it for >1 min to dissolve the CHCA. The solution was centrifuged at 16,000×g for 1 min to pellet any undissolved CHCA. One microliter of each sample was placed between two CHCA matrix layers in a 96-well plate.
MS data were obtained using a MALDI-TOF Microflex LT instrument (Bruker Daltonics, Bremen, Germany) in linear mode. Before analysis, instrument calibration was performed with Protein II Standard (Bruker Daltonics, Bremen, Germany), containing three calibrants at 22,307.0, 23,982.0, and 44,163.0. These calibrants were adjusted to be within 1,000 parts per million to ensure accuracy. The mass range for detection was set from 9,000 to 60,000, and 500 summed laser shots were obtained for each sample. DW, ACN, and matrix abnormalities were checked for before proceeding to data analysis. Meaningful peaks with a signal:noise ratio above 3–6 and an intensity above 1,000 were obtained.
The AutoeXecute feature within flexContrl 3.4 software (Bruker Daltonics) facilitated automated mass detection. Flexanalysis (Bruker Daltonics) software was used to observe the mass spectrum and analyze the results.

Analytical performance evaluation

To determine precision, normal and abnormal (IgG/kappa) serum samples were tested in three different ways. The Melon Kit with C4 ZipTip, MB, and NB was utilized in combination with MALDI-TOF MS five times/day and repeated for 5 consecutive days for IgG purification. The m/z values were collected at the highest intensities for the normal and abnormal peaks. The average, SD, and CV of the m/z values were calculated using Microsoft Excel 2010 (Microsoft Corp., Redmond, WA, USA).
To evaluate the limit of detection (LoD), we serially diluted daratumumab in normal serum at concentrations of 0, 0.05, 0.1, 0.2, 0.5, and 1.0 g/dL for MALDI-TOF MS combined with NB serum preparation (NB-MALDI-TOF MS). For qTOF MS combined with NB serum preparation (the NB-LC-ESI-qTOF MS method), the daratumumab concentrations used were 0, 0.01, 0.025, 0.05, 0.075, 0.1, and 0.2 g/dL.

Comparing NB-MALDI-TOF MS with IFE using patient samples

We compared the clinical performance of the NB-MALDI-TOF MS method with IFE using 25 normal samples and 25 abnormal samples. IFE was performed on a HYDRASIS 2 instrument (Sebia, Lisses, France). PEP was performed with a CAPILLARYS 3 TERA instrument (Sebia) to quantify M-protein levels. For FLC measurements, serum Freelite assays (The Binding Site, Birmingham, UK) were conducted to quantify the serum levels of the kappa and lambda chains.

RESULTS

High-resolution MS analysis

Daratumumab and cetuximab were investigated via high-resolution MS (Supplemental Data Table S1). The molecular mass of the daratumumab light chain was calculated from the amino acid sequence as 23,384.02, consistent with the mass observed via high-resolution MS after deconvolution. The molecular mass of cetuximab was calculated as 23,426.95, consistent with the observed mass.
Using daratumumab and cetuximab stock solutions, the molecular weight differences between samples treated with DTT versus those treated with DTT plus IAA were compared using high-resolution MS against the calculated molecular weights (Supplemental Data Table S1). The observed differences were less than 1 Da in samples treated solely with DTT. In contrast, t-mAbs treated with both DTT and IAA exhibited a difference of 57 Da, which was attributed to a mass shift possibly caused by cysteine alkylation, which can occur during IAA treatment at pH 8 [18, 19]. The mass shifts observed with the t-mAbs were also observed with the Melon IgG Purification Kit combined with MALDI-TOF MS after applying IAA. Because the m/z ratio is critical in MALDI-TOF MS analysis, IAA treatment was avoided to minimize the m/z difference.
We observed an m/z difference of <100 Da during MALDI-TOF MS analyses of serum samples, and the high-resolution MS exhibited a precision of <1 Da (Supplemental Data Table S1). Differences in the m/z ratio were found with all preparation methods used, including the Melon Kit with C4 ZipTip, MB, and NB.

Analytical performance of MALDI-TOF MS

Abnormal samples showed monoclonal peaks in all repeats, whereas normal samples showed polyclonal peaks in all mass spectra.
Variations in the m/z ratio were documented across five replicates, measured over 5 days. The m/z ratio ranges were observed for both normal and abnormal (IgG/kappa) samples (Supplemental Data Table S2). The CVs of five replicates in a day were 0.03%–0.09% for the Melon Kit with C4 ZipTip, 0.04%–0.07% for MB, and 0.06%–0.12% for NB (Supplemental Data Table S3). The CV results for 5 days were 0.1%–0.2% for single-charged light chains, whereas they were 0.6%–1.0% for double-charged light chains (Supplemental Data Table S4).
Reduced light chains with single and double charges of purified IgG, IgA, IgM, kappa, and lambda, as well as mixed KnL beads, were observed in mass-spectrum range within 22,000–24,500 Da and 11,000–12,500 Da, respectively. Qualitative analysis revealed the presence of monoclonal peaks for IgG, IgA, IgM, kappa, lambda, and KnL.
Negative results, obtained with serum IFE and NB-MALDI-TOF MS when identifying immunoglobulin subtypes (including IgG, IgA, IgM, kappa, lambda, and KnL), were used as negative controls (Fig. 1). To identify M-proteins, the presence of monoclonal peaks was closely monitored, and peak shapes were compared to negative controls. Relatively broad, rounded polyclonal peaks were observed for normal patient samples, whereas narrow and sharp monoclonal peaks were observed for abnormal patient samples. In the KnL mass spectra, the purified kappa and lambda chains exhibited a mass spectrum similar to that of IgG (Fig. 2). The features of the polyclonal and monoclonal peaks observed with KnL showed the same curve patterns as those found with the IgG mass spectrum, using Flexanalysis software. Regarding the peaks for purified IgG, we observed polyclonal and monoclonal peaks in the KnL mass spectra for patients with normal and abnormal samples. The KnL beads showed single peaks for both normal and abnormal (IgG/kappa) serum samples (Supplemental Data Fig. S1).
The LoD determined when using IgG affinity beads was 0.1 g/dL for the monoclonal daratumumab peak, which was the lowest among the three methods (Fig. 3). The Melon Kit with C4 ZipTip showed an LoD for the monoclonal peak between 0.2 and 0.5 g/dL, whereas that for the MBs was 0.5 g/dL.
Samples yielding negative or positive NB-LC-ESI-qTOF MS results for identifying immunoglobulin subtypes were used as negative and positive controls, respectively (Supplemental Data Fig. S2). The monoclonal peaks were narrow and sharp with the abnormal samples (Fig. 4). The LoD of the NB-LC-ESI-qTOF MS method was 0.025 g/dL (Supplemental Data Fig. S3).

Comparison of NB-MALDI-TOF MS and IFE results using patient samples

Different immunoglobulin subtypes were included for the 25 abnormal IFE samples. Eight IgG/kappa, six IgG/lambda, two IgA/kappa, three IgA/lambda, three IgM/kappa, one IgM/lambda, one lambda-free light chain, and one biclonal (IgG/lambda, IgG/kappa) subtype were studied.
All 25 normal IFE samples showed negative PEP results, whereas two of them showed positive results via NB-MADLI-TOF MS (Table 1). One sample was identified as IgG/lambda, and the other one was suspected as the IgA/lambda subtype. Two of the 25 abnormal IFE samples showed negative results via NB-MALDI-TOF MS (Table 2). Overall, the NB-MALDI-TOF MS results showed 92% concordance with the IFE results, with 92% sensitivity and 92% specificity.
We identified four discrepancies between the IFE and NB-MALDI-TOF MS methods. One sample with an IgG/kappa subtype by IFE showed a negative result by NB-MALDI-TOF MS analysis. The kappa: lambda ratio was normal with an increased kappa chain level (Supplemental Data Fig. S4). A sample with a suspected IgG/kappa subtype and a lambda type (as determined via IFE) showed negative results via NB-MALDI-TOF MS. The kappa: lambda ratio was elevated with a markedly higher kappa chain level (Supplemental Data Fig. S5). A sample that was negative via IFE showed positive IgG/lambda results via NB-MALDI-TOF MS. The kappa: lambda ratio was normal with normal kappa and lambda chain levels (Supplemental Data Fig. S6). A sample scored as negative via IFE was suspected of an IgA/lambda subtype based on NB-MALDI-TOF MS. The kappa: lambda ratio was normal with normal kappa and lambda chain levels (Supplemental Data Fig. S7).
NB-MALDI-TOF MS analysis helped confirm the IFE results in two cases. The IgG/lambda subtype was suspected based on our IFE data, although the results were ambiguous. Peaks indicating the IgG/lambda subtype were found in the NB-MALDI-TOF MS spectra. The kappa: lambda ratio was normal with increased kappa and lambda chain levels (Supplemental Data Fig. S8). The IgM/kappa subtype was suspected based on dim IFE bands, whereas the IgM/kappa peaks were clearly found with NB-MALDI-TOF MS. The kappa: lambda ratio was normal with increased kappa chain levels (Supplemental Data Fig. S9).

DISCUSSION

Traditional methods for detecting M-protein using electrophoresis have several limitations, including false positives, low sensitivity, and a labor-intensive burden in clinical laboratories [20, 21]. We developed an MS-based M-protein-detection method because of its potential clinical applications, and it showed sufficient accuracy and sensitivity. The development of MS-based methods is a highly sensitive and versatile approach that incorporates various MS technologies [22, 23]. MALDI-TOF MS, LC-ESI-qTOF MS, and quadrupole-Orbitrap MS (QE Orbitrap) each offer distinct advantages and disadvantages [24-27]. The choice of technology in clinical laboratories often depends on several factors, including the sensitivity required, cost, and operational complexity [28]. MALDI-TOF MS is favored in many scenarios due to its cost-effectiveness, simplicity, and rapid processing capabilities [25], which are advantageous for adapting MS into routine clinical laboratory operations for M-protein detection. We assessed the feasibility and optimization of MALDI-TOF MS for analyzing its benefits in a clinical laboratory setting.
Reducing reagents, such as TCEP or DTT, can be utilized to disrupt disulfide bonds and separate heavy and light chains using MALDI-TOF MS or ESI-qTOF MS [13, 19]. In contrast, clonotypic peptide analysis requires digestion to target specific peptides [29]. Although mass spectrometers, such as the Orbitrap, offer heightened sensitivity and accuracy for personalized assays, clonotypic peptide analysis can be more costly, time-consuming, and labor-intensive than adapting MALDI-TOF MS in clinical laboratories [30].
Employing MALDI-TOF MS for M-protein detection is crucial for effectively preparing and purifying immunoglobulin and light chain samples [11]. Several approaches have been considered, including bead-based methods, affinity LC, and developing new antibodies for diverse immunoglobulin binding [31, 32]. NBs were selected as the preferred option due to their cost-effectiveness and capability for isolating immunoglobulins and light chains, as previously demonstrated by MALDI-TOF MS [33].
Utilizing NBs (IgG, IgA, IgM, kappa, lambda, and KnL) combined with MALDI-TOF, particularly with KnL beads, represents a novel approach for helping implement MS-based methods in clinical laboratories. The mass spectra of KnL were compared with that of IgG, which previously demonstrated utility with NBs in identifying M-proteins by MS [31]. The mass spectra and curve patterns of KnL with normal and abnormal samples showed the same characteristics found in the IgG spectra. The optimal amount of KnL beads required for antibody purification was determined by diluting daratumumab in PBS and serum samples. Using NB-MALDI-TOF MS, we identified monoclonal peaks via KnL MS with comparable sensitivity relative to IgG (LoD: 0.1 g/dL). This approach proved highly effective in M-protein screening, and we observed 92% concordance between the NB-MALDI-TOF MS and IFE results. We also demonstrated the applicability of this qualitative method using NBs for MALDI-TOF MS and LC-ESI-qTOF MS analyses.
To evaluate the efficiency of sample purification with NBs, we compared the results obtained after purifying IgG samples using the Melon Kit with C4 ZipTip and MB. The NBs showed the lowest LoD among the three methods tested. In accordance with another report [17], the hypo-gamma, normal-gamma, and hyper-gamma samples demonstrated different LoDs. With NB-MALDI-TOF MS analysis, the LoDs were 0.1, 0.2, and 0.5 g/dL, respectively. With NB-LC-ESI-qTOF MS, the LoDs were 0.025, 0.05, and 0.05 g/dL, respectively. The LoD increased with the hyper-gamma samples. Consistent with previous findings [34, 35], high-resolution MS based on LC-ESI-qTOF demonstrated superior results over MALDI-TOF MS in terms of the LoD. High-resolution qTOF MS and NB-LC-ESI-qTOF MS analysis helped differentiate daratumumab from the M-protein with a molecular weight difference of <1 Da. MALDI-TOF MS exhibited a larger molecular weight discrepancy, approximately 100 Da, which complicated the differentiation between daratumumab and M-protein using MALDI-TOF.
Discrepancies between IFE and NB-MALDI-TOF MS results were observed for four of the 50 patients studied. Two samples showed negative results via IFE but were positive with NB-MALDI-TOF MS, whereas two positive results found with IFE were negative via NB-MALDI-TOF MS. One patient with a negative IFE result but a positive NB-MALDI-TOF MS result experienced relapse within 6 months of observing this discrepancy. In all cases when IFE showed positive results, the corresponding NB-MALDI-TOF MS outcomes consistently indicated the same subtype. The M-protein could not be quantified via PEP for two patients with an IgM/kappa and IgM/lambda type owing to its small amount. Among the 23 patients with abnormal IFE and NB-MALDI-TOF MS results, the FLC ratio revealed a discrepancy rate of 47.8%. Nine patients (39.1%) with discrepancies had an FLC ratio within the normal range. As the kappa and lambda chains were not measurable for two patients (8.7%), their ratios could not be calculated. This finding reflects a limitation of the FLC ratio that it relies on an indirect determination of monoclonality using the kappa: lambda ratio, which is known for poor accuracy and agreement between different assays [36]. As a complementary test to IFE, IFE with NB-MALDI-TOF can potentially help detect M-proteins with higher concordance when compared with correlating IFE results with the FLC ratio.
This study has several limitations, including the restriction of IFE and NB utility to IgG, IgM, and IgA, while excluding IgD and IgE. NB-LC-ESI-qTOF MS was partially conducted to confirm the NB-MALDI-TOF MS results. Further efforts are needed to enhance the resolution and achieve lower LoD levels.
In conclusion, NB-MALDI-TOF MS assisted with KnL measurements as a qualitative approach for M-protein detection that enabled prompt application to clinical laboratories. This method demonstrated high sensitivity and specificity comparable to that of IFE. Utilizing MS combined with affinity beads, particularly KnL beads, could help implement and develop MS-based methods for M-protein identification.

ACKNOWLEDGEMENTS

We express our sincere gratitude to Jung-Eun Bae for providing invaluable technical support.

Notes

AUTHOR CONTRIBUTIONS

Lee J was instrumental in conceptualizing the methodologies employed in the research and took a leading role in drafting and revising the manuscript, ensuring a comprehensive presentation of the ideas and findings. Choi JH was responsible for the provision and execution of the Quadrupole Time-of-Flight (qTOF) method, adding a crucial dimension to the multifaceted methodological approach adopted in the study. Kim EH and Im JH executed the vital task of sample preparation for the MALDI-TOF method. Yang SJ contributed to optimizing all the methods explored in this research. Hwang HY contributed ideas and assistance throughout the developmental phases of the research using MS. Lee JH, Lee KH, and Song JH offered insights and counsel on the methodologies and contributed to identifying the clinical implications of detecting M-protein using MS. Park SM shared expertise and provided counsel on the effective utilization of sample preparation methods, a contribution that helped fine-tune the method to achieve optimal results. Song SH, as the chief and main supervisor, held responsibility for the research, guiding the project to completion through careful supervision and ensuring high scientific standards.

CONFLICTS OF INTEREST

None declared.

RESEARCH FUNDING

This research was supported by the National Research Council of Science & Technology (NST) grant by the Korea government (MSIT) (No. GTL24021-400).

Appendix

SUPPLEMENTARY MATERIALS

Supplementary materials can be found via https://doi.org/10.3343/alm.2024.0039

References

1. Rajkumar SV, Dimopoulos MA, Palumbo A, Blade J, Merlini G, Mateos MV, et al. 2014; International Myeloma Working Group updated criteria for the diagnosis of multiple myeloma. Lancet Oncol. 15:e538–48. DOI: 10.1016/S1470-2045(14)70442-5. PMID: 25439696.
2. International Myeloma Working Group. 2003; Criteria for the classification of monoclonal gammopathies, multiple myeloma and related disorders: a report of the International Myeloma Working Group. Br J Haematol. 121:749–57. DOI: 10.1046/j.1365-2141.2003.04355.x.
3. Katzmann JA, Kyle RA, Benson J, Larson DR, Snyder MR, Lust JA, et al. 2009; Screening panels for detection of monoclonal gammopathies. Clin Chem. 55:1517–22. DOI: 10.1373/clinchem.2009.126664. PMID: 19520758. PMCID: PMC3773468.
4. Vavricka SR, Burri E, Beglinger C, Degen L, Manz M. 2009; Serum protein electrophoresis: an underused but very useful test. Digestion. 79:203–10. DOI: 10.1159/000212077. PMID: 19365122.
5. Mrosewski I, Urbank M. 2021; Identification of paraproteins via serum immunofixation or serum immunosubtraction and immunoturbidimetric quantitation of serum immunoglobulins in the laboratory testing for monoclonal gammopathies. Arch Pathol Lab Med. 145:1552–7. DOI: 10.5858/arpa.2020-0441-OA. PMID: 33635966.
6. Dispenzieri A, Kyle R, Merlini G, Miguel JS, Ludwig H, Hajek R, et al. 2009; International Myeloma Working Group guidelines for serum-free light chain analysis in multiple myeloma and related disorders. Leukemia. 23:215–24. DOI: 10.1038/leu.2008.307. PMID: 19020545.
7. Oliveros Conejero R, Pascual Usandizaga P, Garrido Chércoles A. 2020; Optimization of workflow and screening panels for the detection of malignant monoclonal gammopathies. Adv Lab Med. 1:20200042. DOI: 10.1515/almed-2020-0042. PMID: 37361501. PMCID: PMC10197466. PMID: 132a2c46435f44cb9221bd29608030d0.
8. McCudden CR, Jacobs JFM, Keren D, Caillon H, Dejoie T, Andersen K. 2018; Recognition and management of common, rare, and novel serum protein electrophoresis and immunofixation interferences. Clin Biochem. 51:72–9. DOI: 10.1016/j.clinbiochem.2017.08.013. PMID: 28843491.
9. Lim SM, Wijeratne N, Choy KW, Nguyen TTH, Setiawan L, Loh TP. 2024; A review of clinical guidelines, laboratory recommendations and external quality assurance programs for monoclonal gammopathy testing. Crit Rev Clin Lab Sci. 61:107–26. DOI: 10.1080/10408363.2023.2257306. PMID: 37776896.
10. Bhole MV, Sadler R, Ramasamy K. 2014; Serum-free light-chain assay: clinical utility and limitations. Ann Clin Biochem. 51:528–42. DOI: 10.1177/0004563213518758. PMID: 24489083.
11. Chapman JR, Thoren KL. 2020; Tracking of low disease burden in multiple myeloma: using mass spectrometry assays in peripheral blood. Best Pract Res Clin Haematol. 33:101142. DOI: 10.1016/j.beha.2020.101142. PMID: 32139008.
12. Giles HV, Wechalekar A, Pratt G. 2022; The potential role of mass spectrometry for the identification and monitoring of patients with plasma cell disorders: where are we now and which questions remain unanswered? Br J Haematol. 198:641–53. DOI: 10.1111/bjh.18226. PMID: 35514140.
13. Barnidge DR, Dasari S, Botz CM, Murray DH, Snyder MR, Katzmann JA, et al. 2014; Using mass spectrometry to monitor monoclonal immunoglobulins in patients with a monoclonal gammopathy. J Proteome Res. 13:1419–27. DOI: 10.1021/pr400985k. PMID: 24467232.
14. Milani P, Murray DL, Barnidge DR, Kohlhagen MC, Mills JR, Merlini G, et al. 2017; The utility of MASS-FIX to detect and monitor monoclonal proteins in the clinic. Am J Hematol. 92:772–9. DOI: 10.1002/ajh.24772. PMID: 28439985.
15. Fatica EM, Martinez M, Ladwig PM, Murray JD, Kohlhagen MC, Kyle RA, et al. 2021; MALDI-TOF mass spectrometry can distinguish immunofixation bands of the same isotype as monoclonal or biclonal proteins. Clin Biochem. 97:67–73. DOI: 10.1016/j.clinbiochem.2021.08.001. PMID: 34384797.
16. Kohlhagen MC, Barnidge DR, Mills JR, Stoner J, Gurtner KM, Liptac AM, et al. 2016; Screening method for M-proteins in serum using nanobody enrichment coupled to MALDI-TOF mass spectrometry. Clin Chem. 62:1345–52. DOI: 10.1373/clinchem.2015.253781. PMID: 27515443.
17. Kohlhagen M, Dasari S, Willrich M, Hetrick M, Netzel B, Dispenzieri A, et al. 2020; Automation and validation of a MALDI-TOF MS (Mass-Fix) replacement of immunofixation electrophoresis in the clinical lab. Clin Chem Lab Med. 59:155–63. DOI: 10.1515/cclm-2020-0581. PMID: 32745067.
18. Ren Y, Shi Z, Zhang C, Han Y, Liu S, Hao P. 2022; Evaluation and minimization of over-alkylation in proteomic sample preparation. Int J Mass Spectrom. 481:116919. DOI: 10.1016/j.ijms.2022.116919.
19. Müller T, Winter D. 2017; Systematic evaluation of protein reduction and alkylation reveals massive unspecific side effects by iodine-containing reagents. Mol Cell Proteomics. 16:1173–87. DOI: 10.1074/mcp.M116.064048. PMID: 28539326. PMCID: PMC5500753.
20. Booth RA, McCudden CR, Balion CM, Blasutig IM, Bouhtiauy I, Rodriguez-Capote K, et al. 2018; Candidate recommendations for protein electrophoresis reporting from the Canadian Society of Clinical Chemists Monoclonal Gammopathy Working Group. Clin Biochem. 51:10–20. DOI: 10.1016/j.clinbiochem.2017.10.013. PMID: 29061378.
21. Tang F, Malek E, Math S, Schmotzer CL, Beck RC. 2018; Interference of therapeutic monoclonal antibodies with routine serum protein electrophoresis and immunofixation in patients with myeloma: frequency and duration of detection of daratumumab and elotuzumab. Am J Clin Pathol. 150:121–9. DOI: 10.1093/ajcp/aqy037. PMID: 29901687.
22. Rappold BA. 2022; Review of the use of liquid chromatography-tandem mass spectrometry in clinical laboratories: part I-development. Ann Lab Med. 42:121–40. DOI: 10.3343/alm.2022.42.2.121. PMID: 34635606. PMCID: PMC8548246.
23. Bertamini L, D'Agostino M, Gay F. 2021; MRD assessment in multiple myeloma: progress and challenges. Curr Hematol Malig Rep. 16:162–71. DOI: 10.1007/s11899-021-00633-5. PMID: 33950462.
24. Ladwig PM, Barnidge DR, Willrich MAV. 2017; Mass spectrometry approaches for identification and quantitation of therapeutic monoclonal antibodies in the clinical laboratory. Clin Vaccine Immunol. 24:e00545–16. DOI: 10.1128/CVI.00545-16. PMID: 28274937. PMCID: PMC5424237.
25. Murray DL, Puig N, Kristinsson S, Usmani SZ, Dispenzieri A, Bianchi G, et al. 2021; Mass spectrometry for the evaluation of monoclonal proteins in multiple myeloma and related disorders: an International Myeloma Working Group Mass Spectrometry Committee Report. Blood Cancer J. 11:24. DOI: 10.1038/s41408-021-00408-4. PMID: 33563895. PMCID: PMC7873248. PMID: dee72de3162d43b8836c27ef0bcaf4e6.
26. Keren DF, Schroeder L. 2016; Challenges of measuring monoclonal proteins in serum. Clin Chem Lab Med. 54:947–61. DOI: 10.1515/cclm-2015-0862. PMID: 26910744.
27. McDonald Z, Taylor P, Liyasova M, Liu Q, Ma B. 2021; Mass spectrometry provides a highly sensitive noninvasive means of sequencing and tracking M-protein in the blood of multiple myeloma patients. J Proteome Res. 20:4176–85. DOI: 10.1021/acs.jproteome.0c01022. PMID: 34242034.
28. Rappold BA. 2022; Review of the use of liquid chromatography-tandem mass spectrometry in clinical laboratories: part II-operations. Ann Lab Med. 42:531–57. DOI: 10.3343/alm.2022.42.5.531. PMID: 35470272. PMCID: PMC9057814.
29. Liyasova M, McDonald Z, Taylor P, Gorospe K, Xu X, Yao C, et al. 2021; A personalized mass spectrometry-based assay to monitor M-protein in patients with multiple myeloma (EasyM). Clin Cancer Res. 27:5028–37. DOI: 10.1158/1078-0432.CCR-21-0649. PMID: 34210683. PMCID: PMC9401514.
30. Murray DL. 2022; Bringing mass spectrometry into the care of patients with multiple myeloma. Int J Hematol. 115:790–8. DOI: 10.1007/s12185-022-03364-2. PMID: 35471500.
31. Mills JR, Barnidge DR, Murray DL. 2015; Detecting monoclonal immunoglobulins in human serum using mass spectrometry. Methods. 81:56–65. DOI: 10.1016/j.ymeth.2015.04.020. PMID: 25916620.
32. Goulet DR, Atkins WM. 2020; Considerations for the design of antibody-based therapeutics. J Pharm Sci. 109:74–103. DOI: 10.1016/j.xphs.2019.05.031. PMID: 31173761. PMCID: PMC6891151.
33. Mills JR, Kohlhagen MC, Dasari S, Vanderboom PM, Kyle RA, Katzmann JA, et al. 2016; Comprehensive assessment of M-proteins using nanobody enrichment coupled to MALDI-TOF mass spectrometry. Clin Chem. 62:1334–44. DOI: 10.1373/clinchem.2015.253740. PMID: 27540026.
34. Santockyte R, Puig O, Zheng N, Ouyang Z, Titsch C, Zhang YJ, et al. 2021; High-throughput therapeutic antibody interference-free high-resolution mass spectrometry assay for monitoring M-proteins in multiple myeloma. Anal Chem. 93:834–42. DOI: 10.1021/acs.analchem.0c03357. PMID: 33300779.
35. Muccio S, Hirtz C, Descloux S, Fedeli O, Macé S, Lehmann S, et al. 2024; A sensitive high-resolution mass spectrometry method for quantifying intact M-protein light chains in patients with multiple myeloma. Clin Chim Acta. 552:117634. DOI: 10.1016/j.cca.2023.117634. PMID: 37980975.
36. Sarto C, Intra J, Fania C, Brivio R, Brambilla P, Leoni V. 2021; Monoclonal free light chain detection and quantification: performances and limits of available laboratory assays. Clin Biochem. 95:28–33. DOI: 10.1016/j.clinbiochem.2021.05.006. PMID: 33991536.

Fig. 1

Negative results found with IFE (A) and NB-MALDI-TOF (B). The m/z ranges of single- and double-charged light chains are presented in the red boxes. The X-axis represents the mass-to-charge ratio (m/z), and the Y-axis shows the summed signal intensity for 500 shots using MALDI-TOF.
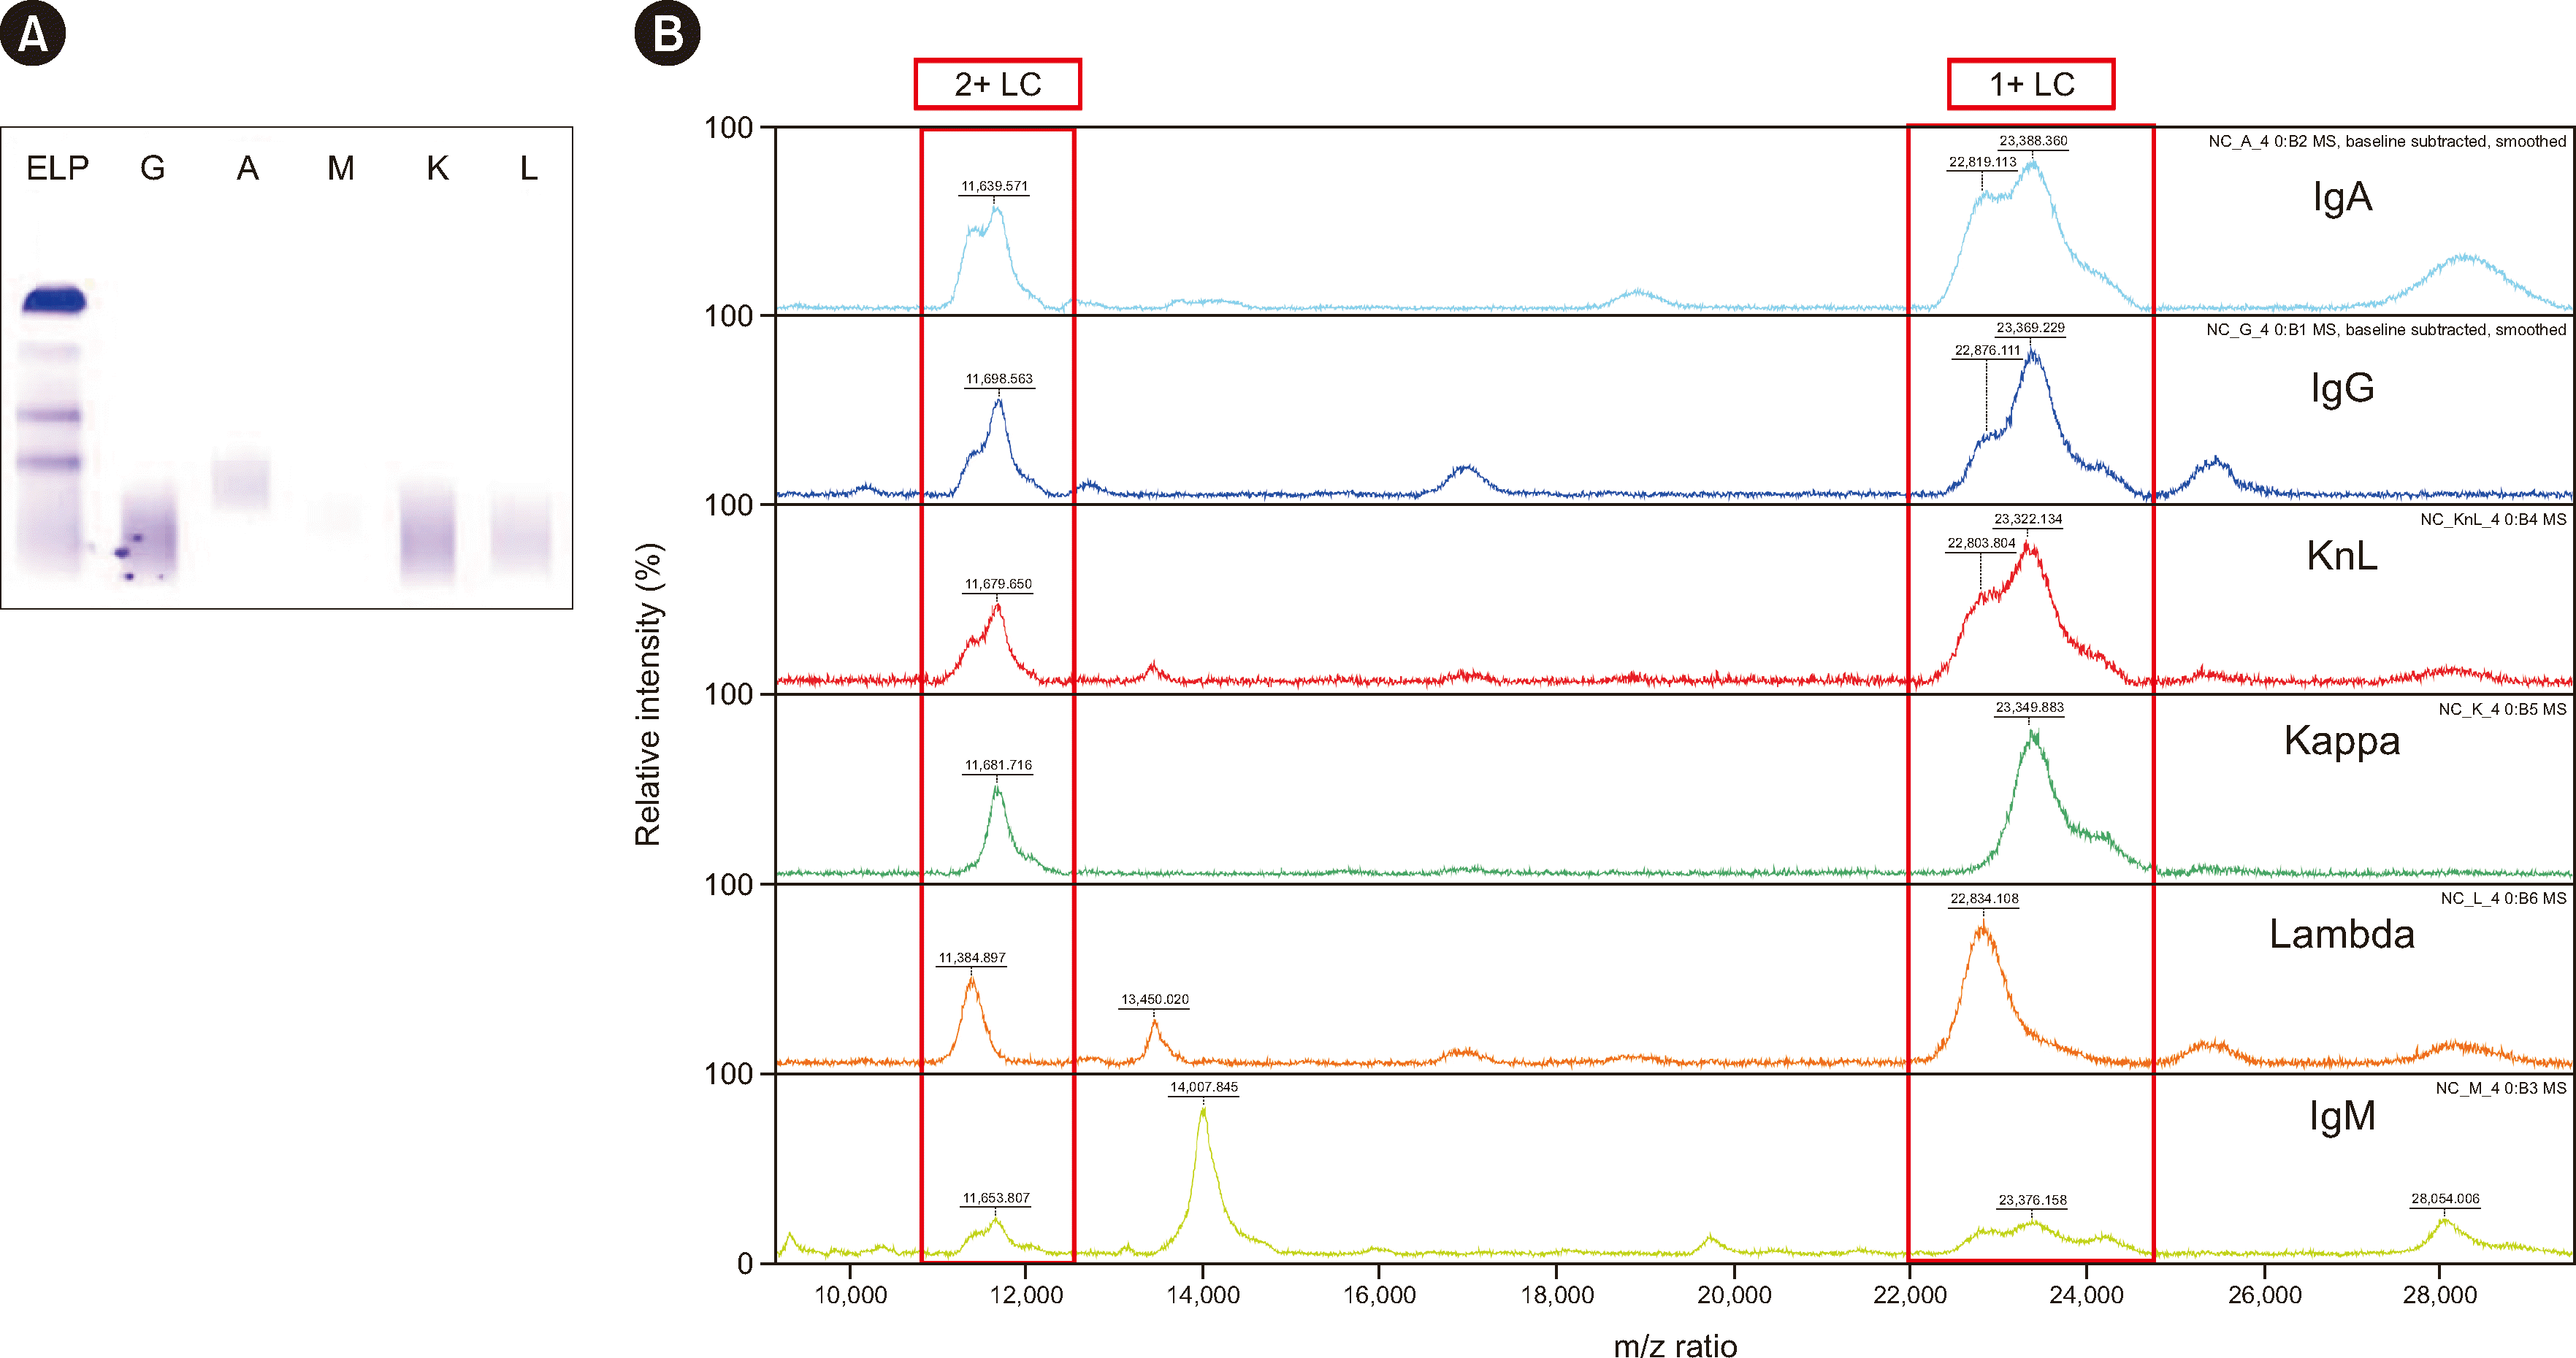
Abbreviations: Intens., intensity; IgA, immunoglobulin A; IgG, immunoglobulin G; IFE, immunofixation electrophoresis; NB-MALDI-TOF, nanobody affinity beads combined with matrix-assisted laser desorption/ionization time-of-flight; K, kappa; KnL, mixed kappa and lambda beads; L, lambda; 1+ LC, single-charged light chain; 2+ LC, double-charged light chain; IgM, immunoglobulin M; m/z, mass-to-charge ratio.
alm-44-6-518-f1.tif
Fig. 2

Examples of NB-MALDI-TOF spectra found with normal and abnormal samples. (A) Polyclonal peaks observed with IgG beads. (B) Polyclonal peaks observed with mixed kappa and lambda. (C) Monoclonal peaks observed with IgG beads. (D) Monoclonal peaks observed with an abnormal IFE sample identified as having the IgG/kappa subtype.
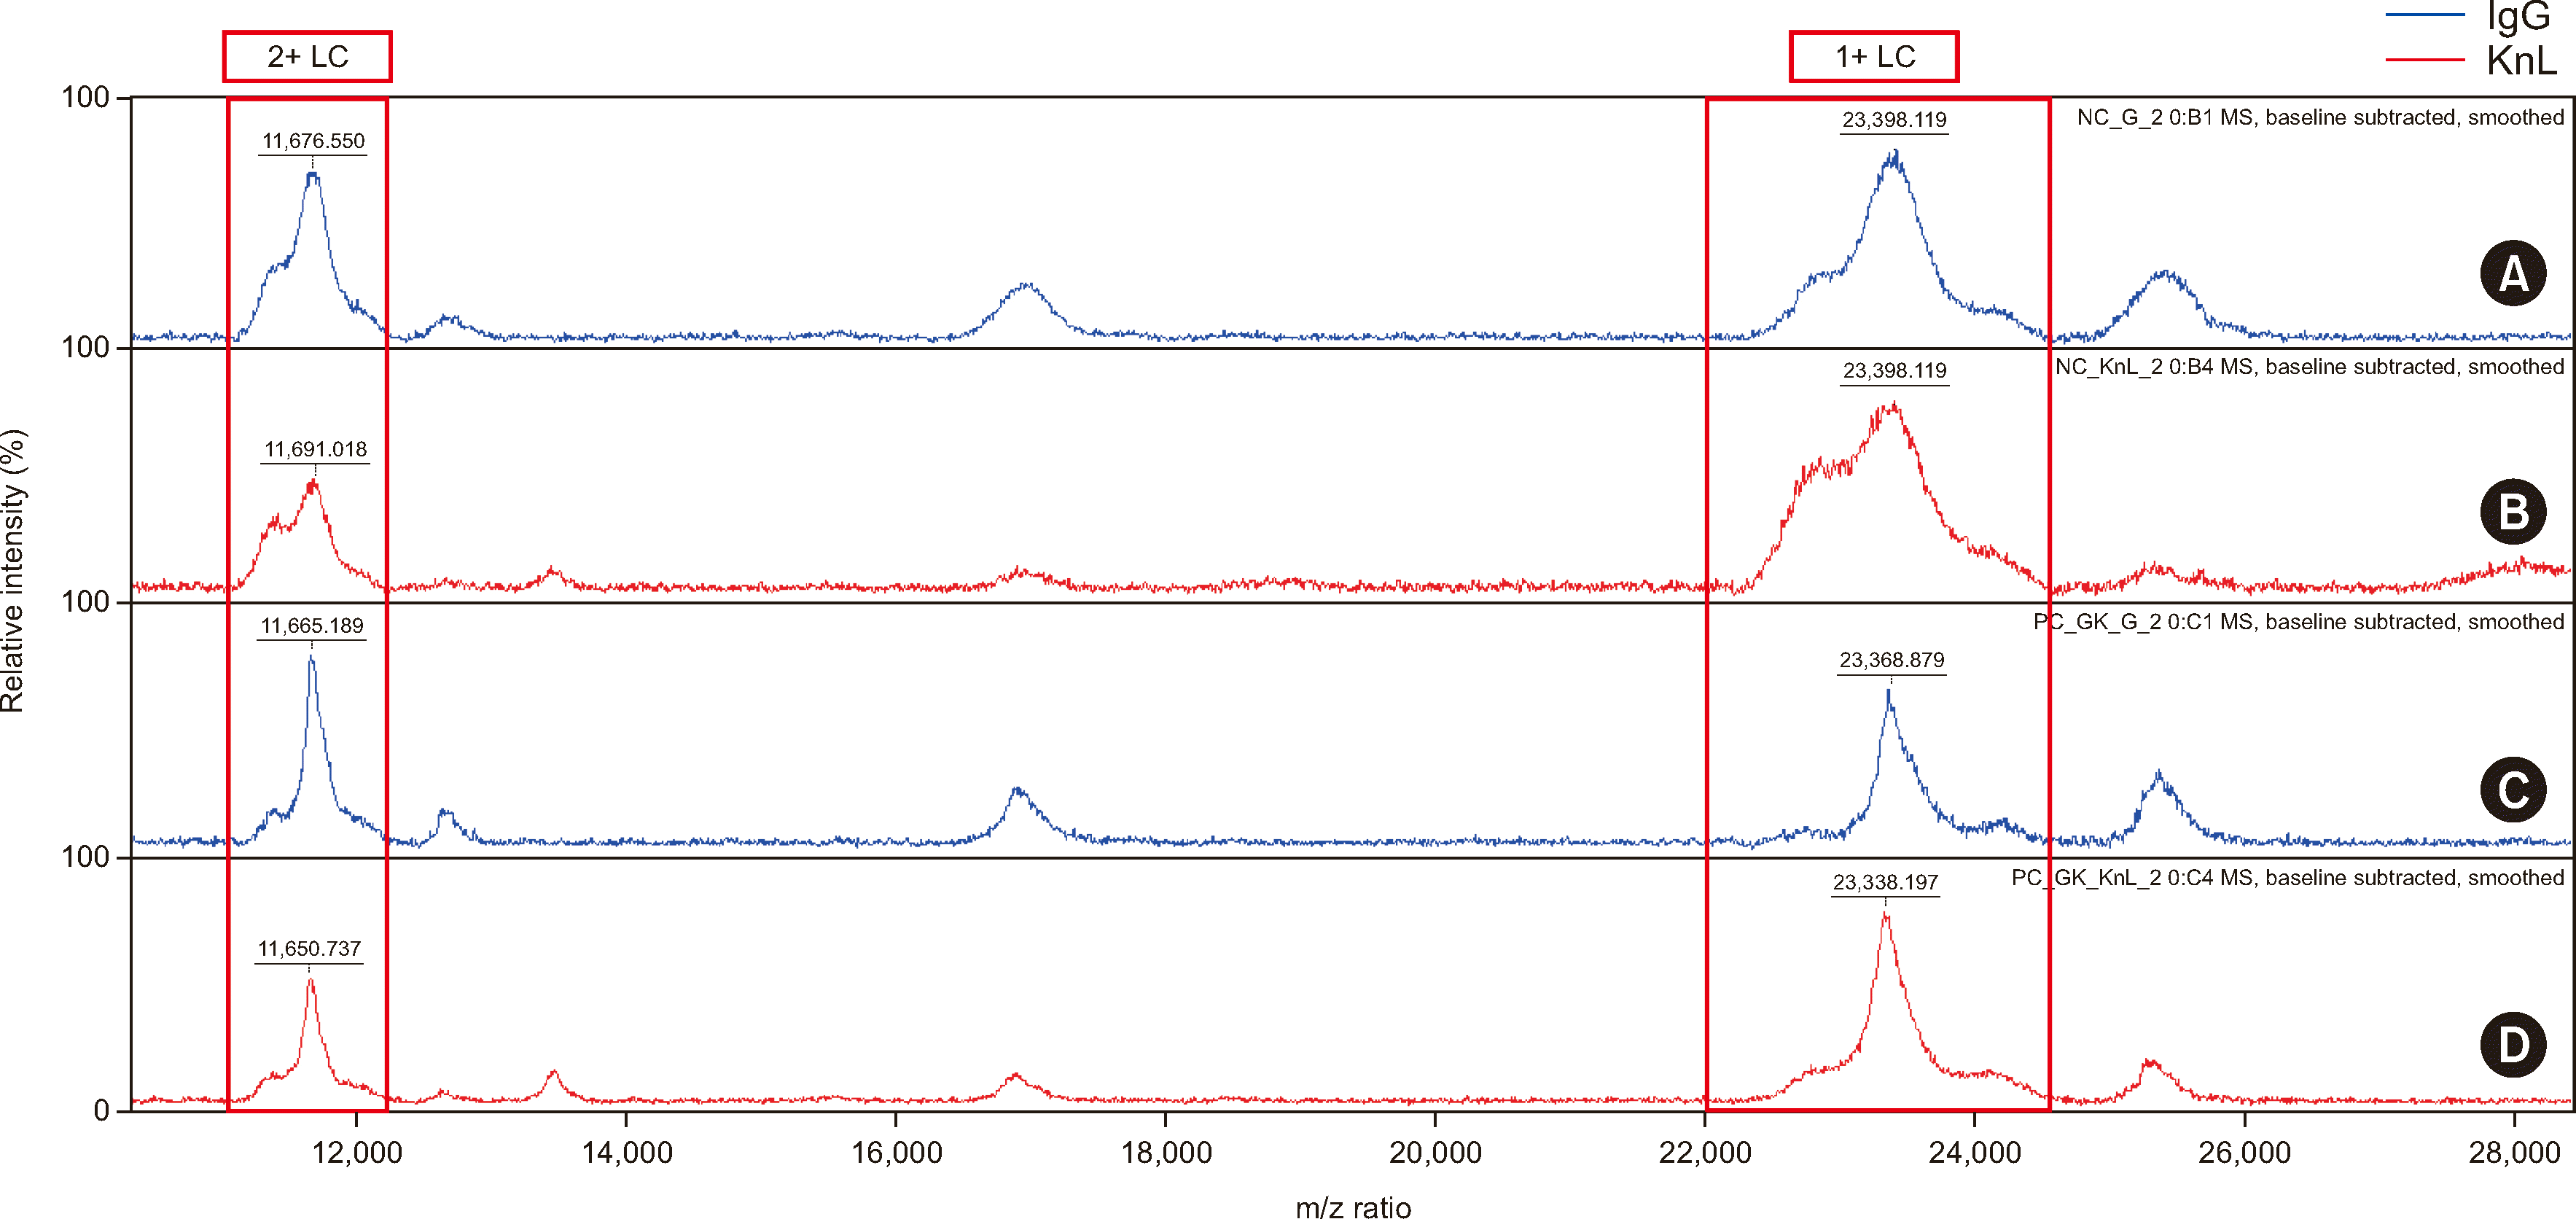
Abbreviations: IFE, immunofixation electrophoresis; KnL, kappa and lambda mixed beads; 1+ LC, single-charged light chain; 2+ LC, double-charged light chain; NB-MALDI-TOF, nanobody affinity beads combined with matrix-assisted laser desorption/ionization time-of-flight.
alm-44-6-518-f2.tif
Fig. 3

Evaluation of limit of detection of NB-MALDI-TOF method following IgG purification using normal serum sample (A) and samples spiked with daratumumab at concentrations of 0.05 (B), 0.1 (C), 0.2 (D), 0.5 (E), or 1.0 g/dL (F).
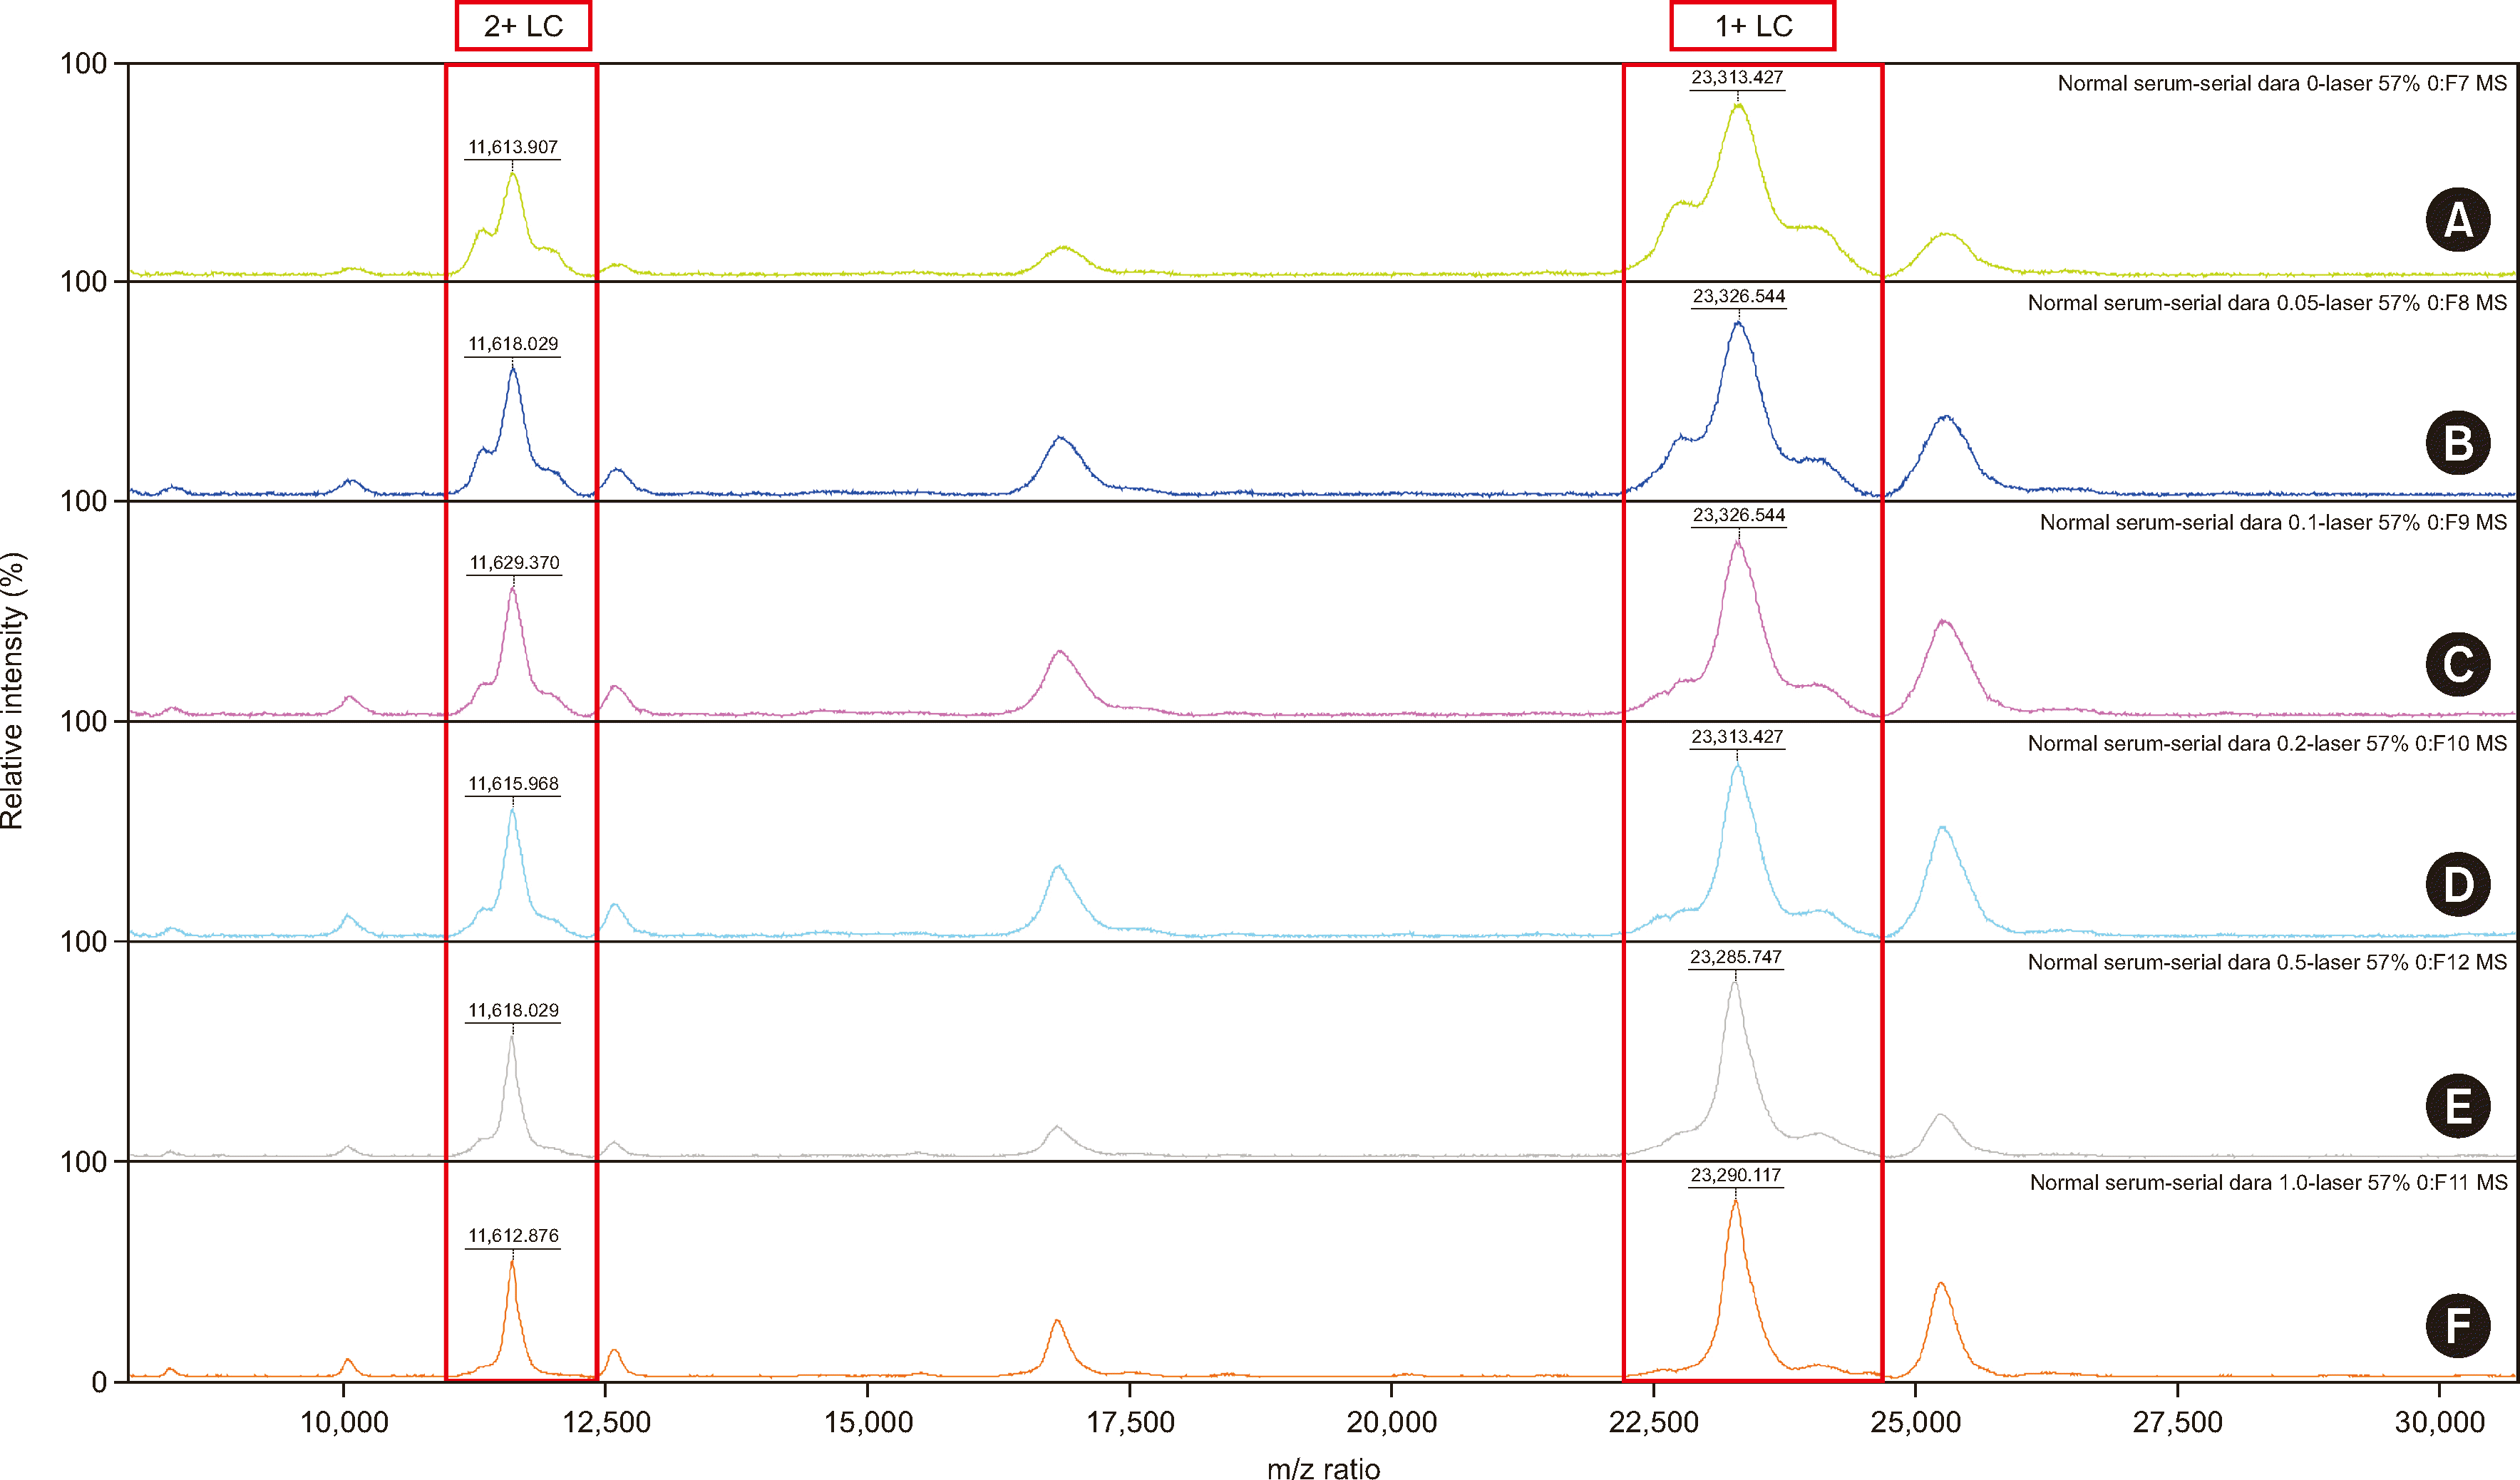
Abbreviations: 1+ LC, single-charged light chain; 2+ LC, double-charged light chain; NB-MALDI-TOF, nanobody affinity beads combined with matrix-assisted laser desorption/ionization time-of-flight.
alm-44-6-518-f3.tif
Fig. 4

NB-LC-ESI-qTOF results after purification with IgG, IgA, IgM, mixed kappa and lambda, kappa, and lambda beads. Mass spectra of samples after NB purification with IgG (A), IgA (B), IgM (C), KnL (D), kappa (E), and lambda (F) beads. Normal pooled serum spiked with daratumumab (0.1 g/dL) showed positive results with monoclonal peaks in the mass spectra after purification with IgG, KnL, and kappa beads (A, D, E) and negative results after purification with IgA, IgM, and lambda beads (B, C, F). The X-axis represents the mass values after deconvolution, and the Y-axis shows the relative intensity observed using NB-LC-ESI-qTOF. The intensity is annotated in the top right corner of each spectrum at 100% relative intensity.
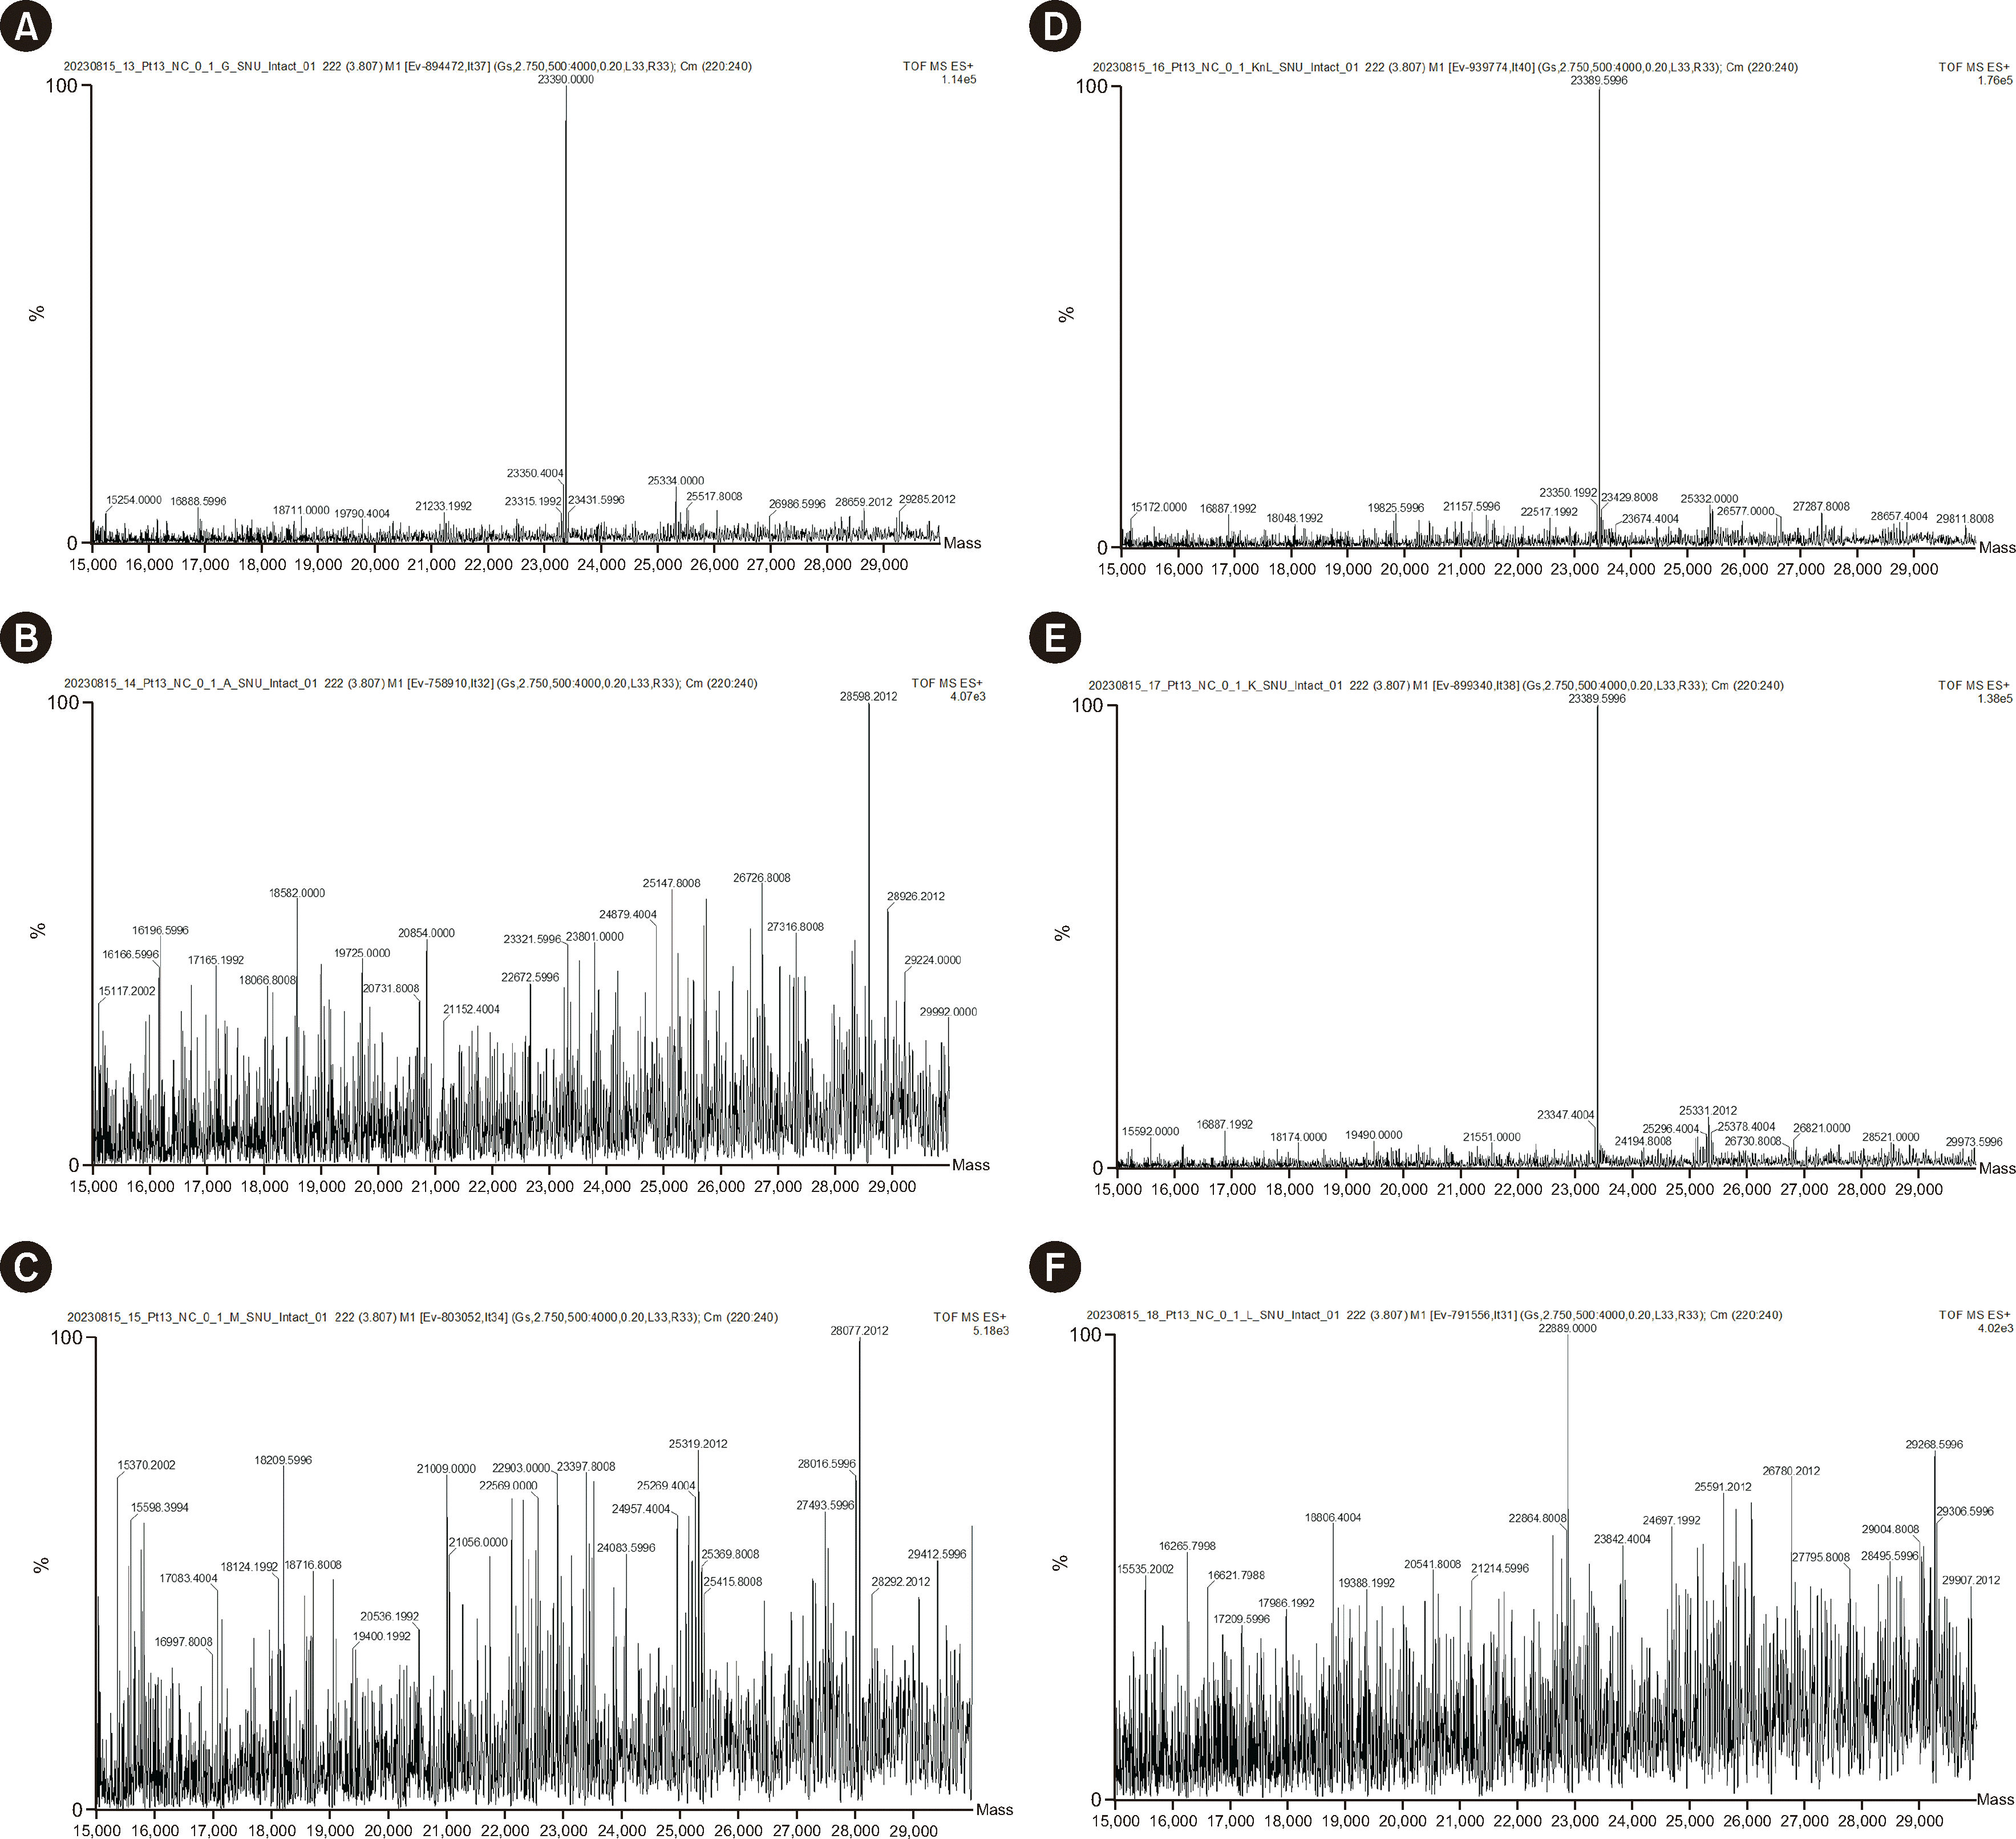
Abbreviations: KnL, mixed kappa and lambda; NB, nanobody affinity bead; NB-LC-ESI-qTOF, nanobody affinity beads combined with liquid chromatography-electrospray ionization-quadrupole time-of-flight.
alm-44-6-518-f4.tif
Table 1

Results obtained with normal serum samples via IFE versus those obtained with NB-MALDI-TOF and PEP

No. case IFE NB-MALDI-TOF
1 Negative Negative
2 Negative Negative
3 Negative IgG/lambda
4 Negative s/o IgA/lambda
5 Negative Negative
6 Negative Negative
7 Negative Negative
8 Negative Negative
9 Negative Negative
10 Negative Negative
11 Negative Negative
12 Negative Negative
13 Negative Negative
14 Negative Negative
15 Negative Negative
16 Negative Negative
17 Negative Negative
18 Negative Negative
19 Negative Negative
20 Negative Negative
21 Negative Negative
22 Negative Negative
23 Negative Negative
24 Negative Negative
25 Negative Negative

Abbreviations: IFE, immunofixation electrophoresis; NB-MALDI-TOF, nanobody affinity beads combined with matrix-assisted laser desorption/ionization time-of-flight; PEP, protein electrophoresis; s/o, suspected of.

Table 2

Comparison of abnormal samples from IFE with results from NB-MALDI-TOF, PEP, and FLC assay.

No. case IFE NB-MALDI-TOF PEP M-protein, g/dL M-protein, % K/L ratio
(0.26–1.65)*
Kappa, mg/L
(3.3–19.4)*
Lambda, mg/L
(5.71–26.30)*
1 IgG/kappa IgG/kappa Positive 0.03 0.5 N/A <0.54 <1.40
2 IgG/kappa IgG/kappa Positive 1.14 14.2 4.92 452.53 92.06
3 IgG/kappa IgG/kappa Positive 0.30 5.2 1.12 21.19 19.00
4 IgG/kappa IgG/kappa Positive 0.26 4.3 1.10 18.25 16.52
5 IgG/kappa IgG/kappa Positive 0.08 1.3 1.57 4.53 2.88
6 IgG/kappa Negative Positive 0.17 2.5 1.56 25.39 16.25
7 IgG/kappa IgG/kappa Positive 0.88 12.4 2.21 47.47 21.52
8 s/o IgG/kappa Negative Positive 0.18 2.9 34.16 496.39 14.53
9 s/o IgG/lambda IgG/lambda Positive 0.60 7.2 1.28 40.52 31.60
10 IgG/lambda IgG/lambda Positive 1.36 18.2 0.40 19.13 47.67
11 IgG/lambda IgG/lambda Positive 0.72 11.0 0.22 27.34 124.43
12 IgG/lambda IgG/lambda Positive 0.28 4.0 1.15 37.14 32.25
13 IgG/lambda IgG/lambda Positive 1.51 24.8 0.02 6.00 256.49
14 IgG/lambda IgG/lambda Positive 0.80 10.9 10.95 357.89 32.69
15 IgA/kappa IgA/kappa Positive 0.63 9.4 26.72 196.12 7.34
16 IgA/kappa IgA/kappa Positive 0.30 4.4 1.78 11.23 6.31
17 IgA/lambda IgA/lambda Positive 4.49 49.9 0.02 4.02 221.48
18 IgA/lambda IgA/lambda Positive 0.31 4.3 0.98 55.73 56.89
19 IgA/lambda IgA/lambda Positive 0.40 6.4 0.50 97.23 195.41
20 IgM/kappa IgM/kappa Positive 0.58 8.6 3.63 24.47 6.75
21 IgM/kappa IgM/kappa Positive 0.63 9.5 5.02 26.39 5.26
22 s/o IgM/kappa IgM/kappa Negative N/D N/D 1.41 21.24 15.05
23 IgM/lambda IgM/lambda Negative N/D N/D 2.09 54.93 26.27
24 Lambda Lambda Positive 0.08 1.7 0.01 24.69 2,050.12
25 IgG/lambda +IgG/kappa (s/o daratumumab) IgG/lambda +IgG/kappa (s/o daratumumab) Positive 0.38 5.9 N/A <0.54 <1.40

*Reference interval.

Abbreviations: CHCA, α-cyano-4-hydroxycinnamic acid; DTT, dithiothreitol; DW, distilled water; FLC, free light chain; HC, heavy chain; IAA, iodoacetamide; PEP, protein electrophoresis; IFE, immunofixation electrophoresis; LC, light chain; LC-MS, liquid chromatography-mass spectrometry; LoD, limit of detection; MALDI-TOF, matrix-assisted laser desorption/ionization-time-of-flight; MB, magnetic beads; MM, multiple myeloma; M-protein, monoclonal protein; MRD, minimal residual disease; MS, mass spectrometry; N/A, not available; N/D, not detected; NB, nanobody affinity beads; NB-MALDI-TOF, nanobody affinity beads combined with matrix-assisted laser desorption/ionization-time-of-flight; PBS, phosphate-buffered saline; PCD, plasma cell disorder; PEP, protein electrophoresis; QE Orbitrap, Q-Exactive quadrupole Orbitrap; qTOF, quadrupole time-of-flight; s/o, suspected of; TCEP, tris-2-carboxyethl phosphine hydrochloride; t-mAb, therapy-related monoclonal antibody.

TOOLS
Similar articles