Abstract
Background
Lactate is a commonly used biomarker for sepsis, although it has limitations in certain cases, suggesting the need for novel biomarkers. We evaluated the diagnostic accuracy of plasma renin concentration and renin activity for mortality and kidney outcomes in patients with sepsis with hypoperfusion or hypotension.
Methods
This was a multicenter, prospective, observational study of 117 patients with septic shock treated at three tertiary emergency departments between September 2021 and October 2022. The accuracy of renin activity, renin, and lactate concentrations in predicting 28-day mortality, acute kidney injury (AKI), and renal replacement requirement was assessed using the area under the ROC curve (AUC) analysis.
Results
The AUCs of initial renin activity, renin, and lactate concentrations for predicting 28-day mortality were 0.66 (95% confidence interval [CI], 0.55–0.77), 0.63 (95% CI, 0.52–0.75), and 0.65 (95% CI, 0.53–0.77), respectively, and those at 24 hrs were 0.74 (95% CI, 0.62–0.86), 0.70 (95% CI, 0.56–0.83), and 0.67 (95% CI, 0.54–0.79). Renin concentrations and renin activity outperformed initial lactate concentrations in predicting AKI within 14 days. The AUCs of renin and lactate concentrations were 0.71 (95% CI, 0.61–0.80) and 0.57 (95% CI, 0.46–0.67), respectively (P=0.030). The AUC of renin activity (0.70; 95% CI, 0.60–0.80) was also higher than that of lactate concentration (P=0.044).
Septic shock is a potentially life-threatening condition characterized by decreased tissue perfusion; if not adequately treated, irreversible organ failure can develop [1]. Despite advancements in intensive care, sepsis remains associated with considerable morbidity and mortality [2-4]. Parameters that can predict tissue perfusion status and prognosis are crucial for reducing sepsis-related mortality [5].
The Third International Consensus Definitions for Sepsis and Septic Shock (Sepsis-3) suggest measuring lactate as an indicator of tissue perfusion and septic shock [6, 7]. Normalization of the lactate concentration is an important objective in the treatment of early sepsis [8, 9]. In patients with infection, the lactate concentration is indicative of potential complications related to sepsis [10], thereby serving as a crucial marker for identifying and treating sepsis [6]. However, its performance is limited in cases involving aerobic glycolysis, hepatic failure, and the use of medications [11-13].
The renin-angiotensin-aldosterone system (RAAS) is activated as a physiological mechanism to prevent systemic hypotension in the presence of hypovolemia or tissue hypoperfusion [14-16]. Renin drives the RAAS and has recently been suggested to serve as a predictor in critically ill patients [17-19]. Plasma renin concentrations may reflect overall RAAS activation and vasomotor tone in patients with sepsis. Increased blood renin concentration indicate a compensatory response to low blood pressure and decreased tissue perfusion. Plasma renin activity (PRA) assay and direct renin concentration measurement are used for measuring renin. The results of these assays are generally equivalent in the absence of renin inhibition; however, when an inhibitor is bound to the renin active site, renin activity is inhibited in the activity assay, whereas in the direct renin assay, renin recognition is unaffected [20]. Several studies have investigated the utility of plasma renin concentrations as a biomarker for tissue perfusion. However, the results have been inconsistent. In a study of critically ill patients, renin was identified as a marker for intensive care unit (ICU) mortality and tissue perfusion. In another study of patients with septic shock, renin was associated with adverse kidney outcomes and the severity of shock [19, 21]. Studies of patients treated in an ICU revealed that renin concentrations were not significantly affected by diurnal variation, renal replacement therapy (RRT), or the use of medication [19, 22].
According to these findings, renin may be a reliable biomarker for determining the state of tissue perfusion and may likely be particularly useful in patients with sepsis, various types of shock, and underlying diseases such as liver disease. However, evidence of the usability of renin as a biomarker, particularly in the context of sepsis, is limited. Accordingly, we compared the diagnostic accuracy of plasma renin concentrations, renin activity, and lactate concentrations for mortality and kidney outcomes in patients with septic shock admitted to the emergency department (ED) with hypoperfusion.
This was a multicenter, prospective, observational study of patients with septic shock treated at three tertiary EDs between September 2021 and October 2022. The institutional review boards of the participating hospitals authorized the study protocol (approval No.: 2021-03-180). Written informed consent was obtained from all patients or their legal representatives.
The study included patients aged ≥19 yrs suspected of infection with refractory hypotension despite 20–30 mL/kg of fluid resuscitation or hypoperfusion [23].
Hypotension was defined as a systolic blood pressure (SBP) <90 mmHg, mean arterial pressure <70 mmHg, or SBP decrease from baseline >40 mmHg; hypoperfusion was defined as a blood lactate concentration >4 mmol/L. The exclusion criteria were as follows: 1) patients aged <19 yrs, 2) patients with limitations on resuscitation, such as a do-not-resuscitate order, 3) patients with terminal diseases, including cancers and neurological or hematological disorders, 4) patients with end-stage kidney disease who were undergoing hemodialysis or peritoneal dialysis, and 5) patients transferred to another hospital within 24 hrs of study enrollment.
Venous blood specimens for measuring renin activity, renin concentration, and lactate were drawn into EDTA tubes at study enrollment and 24 hrs later. To measure renin activity and renin concentration, blood specimens were centrifuged for 10 minutes at 1,168 g. The EDTA-plasma samples were aliquoted into three separate tubes for subsequent testing: one designated for the assessment of renin activity, another for the determination of renin concentration, and a third tube serving as a backup. The EDTA-plasma samples were stored at a temperature of −20°C and then transported to the central laboratory (GCCL, Yongin, Gyeonggi-do, Korea). The plasma renin activity of each patient was determined using liquid chromatography-tandem mass spectrometry (Triple Quad 5500 LC-MS/MS system, Sciex, Framingham, MA, USA). The reference interval of renin activity is 0.17 to 5.38 ng/mL/hr. [24] The DRG Renin ELISA Kit (DRG Instruments GmbH, Marburg, Germany) was used to measure renin concentrations (suggested reference interval: 2.14 to 53.83 pg/mL) [25]. For lactate concentration measurement, whole blood specimens were collected from patients and analyzed on GEM Premier 3500 and GEM Premier 5000 blood gas analyzers (both Werfen, Bedford, MA).
The primary endpoint was 28-day mortality. Secondary endpoints included acute kidney injury (AKI), in-hospital mortality, 90-day mortality, RRT requirement, shock reversal interval, ICU length of stay (LOS), doses of vasopressor, and maximum sequential organ failure assessment (SOFA) score within 24 hrs. AKI was defined according to the Kidney Disease: Improving Global Outcomes (KDIGO) classification [26]. For the evaluation of the KDIGO stage, the baseline creatinine level was derived from the lowest value between 1 yr and 24 hrs before ED admission. If this value was not available, it was estimated according to a predefined formula (creatinine=0.74−0.2 (for women)+ 0.003×age) [27]. Vasopressor dose was defined as the norepinephrine equivalent dose [28]. The shock reversal interval was defined as the interval from the onset of shock to the time of vasopressor discontinuation for more than 24 hrs.
The ratio of the negative rate to the positive rate of 28-day mortality, which was the primary endpoint in this study, was anticipated to be 4:1 based on findings in a previous study involving patients with nearly identical characteristics [29]. When the expected area under the ROC curve (AUC) of renin was calculated at a level of 0.700, significance level of 0.05, and power of 0.80, 105 patients were required, including 84 in the negative group and 21 in the positive group. Considering a 10% attrition rate, 116 patients were recruited.
Baseline characteristics of the study groups according to survival status are reported as median values and interquartile ranges for continuous variables and as numbers and percentages for categorical variables. Parameters were compared using Wilcoxon rank-sum tests for continuous variables and chi-squared tests for categorical variables. Correlations between plasma renin concentrations and quantitative variables were determined using Spearman’s rank correlation. The prognostic accuracy of lactate, renin concentration, and renin activity as predictors of mortality, AKI, and RRT requirement was determined based on AUCs. AKI was defined as a KDIGO score of 2 or 3. Optimal cutoffs of lactate, renin concentration, and renin activity were calculated based on the Youden index. The AUCs of lactate, renin concentration, and renin activity were compared using a nonparametric method for ROC curves. A two-tailed P-value <0.05 was considered to indicate a statistically significant difference. All analyses were conducted using Stata 17.0 (Stata Corp., College Station, TX, USA).
During the study period, 137 patients were screened. Fourteen patients were excluded for general reasons such as lack of consent or a do-not-resuscitate order. Six patients were additionally excluded because their blood specimens were unsuitable for analysis. Finally, 117 patients were included in the analysis (Supplemental Data Fig. S1). The in-hospital mortality, 28-day mortality, and 90-day mortality rates were 28.2% (33/117), 23.1% (27/117), and 37.6% (44/117), respectively. The baseline characteristics according to 28-day mortality are presented in Table 1. The most prevalent infection source was the gastrointestinal tract, followed by the lungs and urinary tract (38.2%, 36.4%, and 35.1%, respectively). In non-survivors, the lungs were the most common infection source (non-survivors vs. survivors, 72.2% vs. 25.4%, P<0.001), whereas, in survivors, the hepatobiliary system was the most common infection source (survivors vs. non-survivors, 31.0% vs. 6.3%, P=0.045). Blood culture tests revealed the presence of bacteria in 51.3% of total patients (N=60), with no significant difference between the two groups in this regard (48.9% vs. 59.3%, P=0.344) or in the frequency of vasopressor usage (94.4% vs. 96.3%, P=0.702).
Table 2 shows the renin activity, renin concentration, and lactate concentrations at the time of enrollment and 24 hrs later. At the time of enrollment, blood specimens were collected from all participating patients, and after 24 hrs, specimens were collected from 94 patients. Lactate, renin concentration, and renin activity differed significantly between survivors and non-survivors, irrespective of the collection time.
The AUCs of lactate, renin concentration, and renin activity for predicting 28-day mortality are shown in Fig. 1A and 1B. The AUCs of initial renin activity, renin concentration, and lactate concentrations for predicting 28-day mortality were 0.66 (95% confidence interval [CI], 0.55–0.77), 0.63 (95% CI, 0.52–0.75), and 0.65 (95% CI, 0.53–0.77), respectively. At 24 hrs, they were 0.74 (95% CI, 0.62–0.86), 0.70 (95% CI, 0.56–0.83), and 0.67 (95% CI, 0.54–0.79), respectively. The accuracy of prognosis tended to improve after 24 hrs, with no significant difference among the three markers (all P>0.05). The AUCs for predicting 90-day mortality and in-hospital mortality are shown in Supplemental Data Fig. S2.
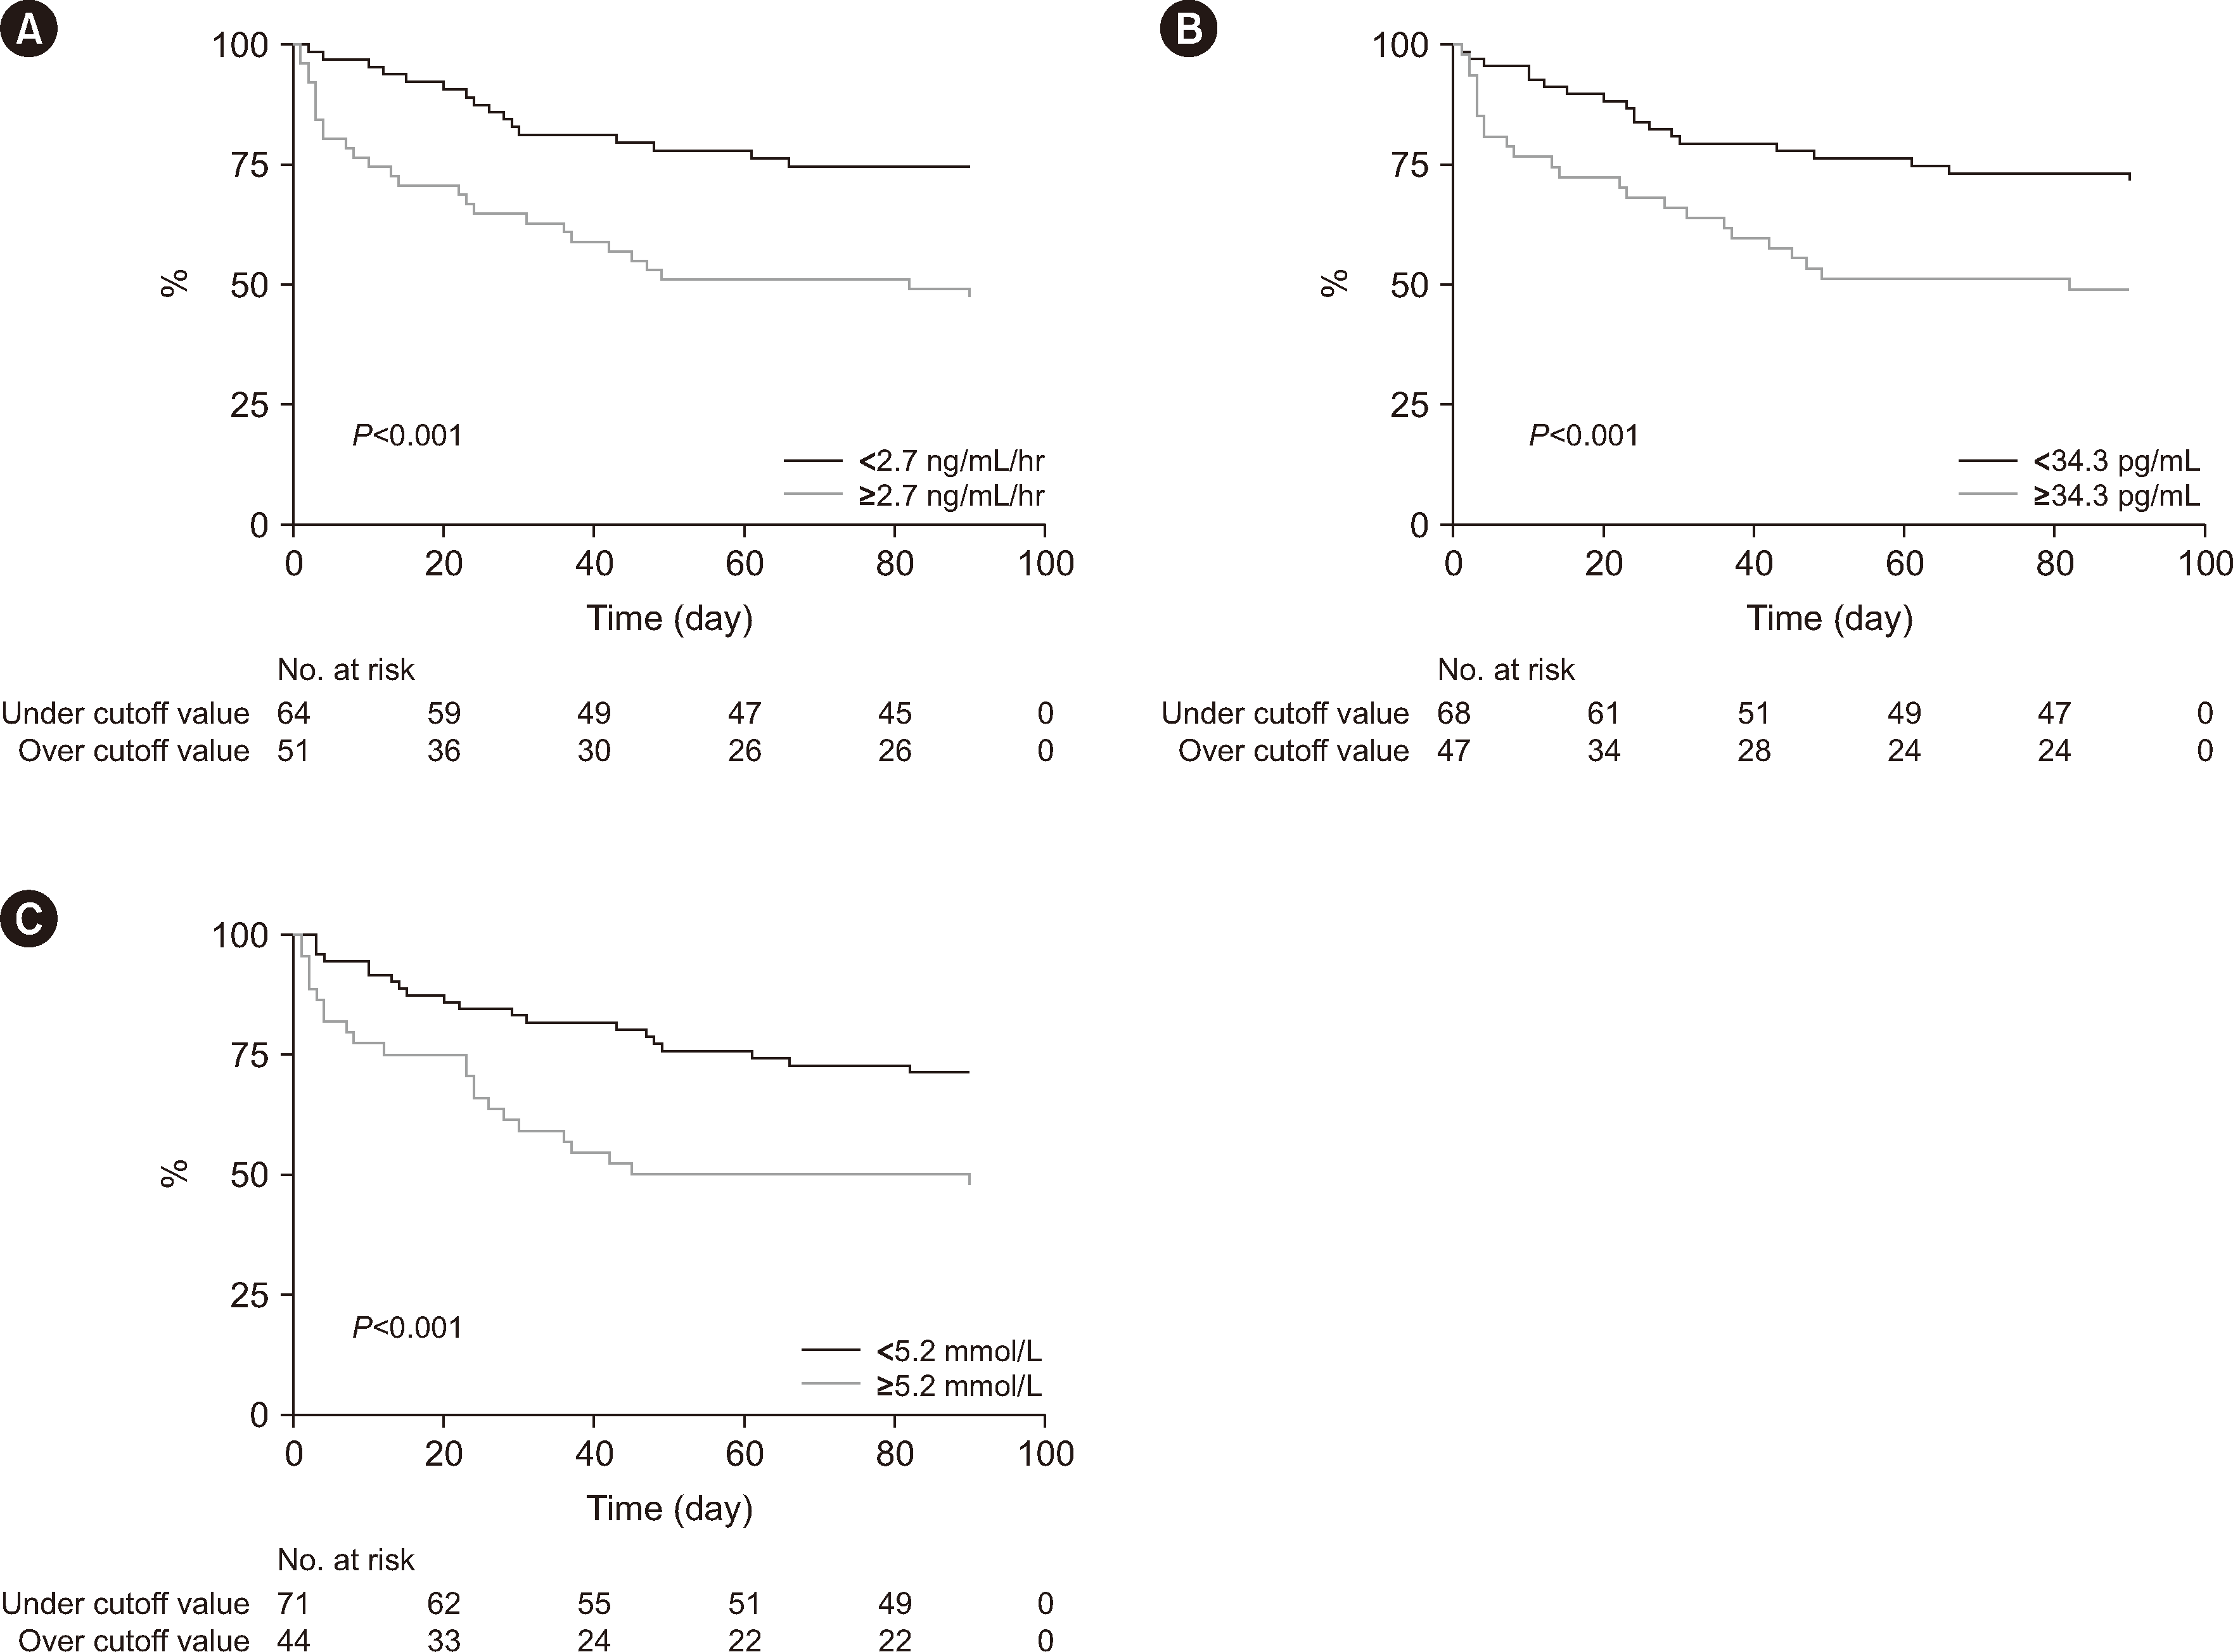
The optimal cutoff values of renin activity, concentration, and lactate concentrations for predicting 28-day mortality were 2.7 ng/mL/hr, 34.3 pg/mL, and 5.2 mmol/L, respectively, at the time of enrollment, and 2.4 ng/mL/hr, 51.0 pg/mL, and 2.1 mmol/L, respectively, at 24 hrs (Table 3). At the time of study enrollment, the 28-day mortality rate was 30.8% when renin concentration was above and lactate concentration below the cutoff point, whereas it was 31.8% when renin concentration was below and lactate concentration above the cutoff point. At 24 hrs, the 28-day mortality rate was 30.0% when renin concentration was above and lactate concentration below the cutoff point, whereas it was 16.1% when renin concentration was below and lactate concentration above the cutoff point (Supplemental Data Table S1). Kaplan–Meier survival curves based on the cutoff values of all biomarkers are shown in Fig. 2A–2C. We observed a notable disparity in mortality for all biomarkers when comparing cases above and below the cutoff points.
Within 14 days of study enrollment, 58 of 117 patients attained a KDIGO score of 2 or 3. RRT was required in 22 of 117 patients. The prognostic accuracy of lactate, renin concentration, and renin activity for AKI is shown in Fig. 1C. Compared to lactate concentration, renin concentration and renin activity were more accurate in predicting the likelihood of AKI within 14 days of study enrollment (renin concentration vs. lactate concentrations, 0.71, 95% CI, 0.61–0.80, vs. 0.57, 95% CI, 0.46–0.67, P=0.030) (renin activity vs. lactate concentrations, 0.70, 95% CI, 0.60–0.80, vs. 0.57, 95% CI, 0.46–0.67, P=0.044). There was no significant difference in the ability of the three biomarkers to predict RRT (Fig. 1D). The optimal cutoff values of renin activity, renin concentration, and lactate concentrations for predicting AKI are shown in Supplemental Data Table S2.
There was no correlation between mean arterial pressure measured at study enrollment and ICU LOS, and all three biomarkers were correlated with maximum SOFA score and vasopressor dose within 24 hrs. Renin concentration and renin activity were associated with the interval to shock reversal, whereas lactate concentration was not (Table 4).
Renin concentrations and renin activity were comparable to lactate concentrations for predicting 28-day mortality in patients with septic shock but outperformed lactate concentrations in predicting AKI. Renin concentrations and renin activity were correlated with maximum SOFA score within 24 hrs, maximum vasopressor dose within 24 hrs, and the interval to shock reversal. These findings support previous findings of renin concentrations being comparable to lactate concentrations as a biomarker of tissue hypoperfusion in critically ill patients and indicate that it is associated with poor kidney outcomes and shock severity [17, 19, 21, 22]. Jeyaraju, et al. [30] reported no significant difference between renin and lactate concentrations in predicting mortality in critically ill patients; however, renin concentrations have potential advantages over lactate levels owing to their kinetic properties. Doerschug, et al. [31] evaluated the microvascular regulation of Ras activation and organ dysfunction in patients with sepsis. In their study, PRA remained elevated even after macrovascular resuscitation reached the clinical endpoint in severe sepsis, and Ras activation was associated with microvascular dysfunction and organ failure. These associations suggest that sepsis stimulates the contribution of Ras to microvascular perfusion heterogeneity and that perfusion heterogeneity may contribute to organ failure. The diminished response to endogenous angiotensin II in sepsis-induced vasoplegia may be related to abnormal Ras activation, which promotes a beneficial proinflammatory antibacterial response [31]. In a study that measured plasma renin concentrations in patients in a randomized clinical trial that evaluated the effect of angiotensin II on patients with vasodilatory shock who did not respond to vasopressor treatment, plasma renin concentrations were significantly lower in patients who received angiotensin II therapy than in those who received a placebo. Additionally, angiotensin II therapy substantially decreased mortality in patients with high renin concentrations [18, 32]. This suggests that renin concentrations can serve as a biomarker for individual vasopressor therapy in septic shock.
The predictive accuracy of a biomarker is influenced by the timing of its assessment or the patient’s response to treatment. In the present study, the optimal value for the initial lactate concentration was 5.4 mmol/L, whereas, at 24 hrs, it decreased to 2.1 mmol/L. This supports the results of a previous study that reported normalization of lactate within 24 hrs to be a stronger predictor of survival than lactate clearance [33]. In contrast, the optimal cutoff points of renin concentration and renin activity showed no substantial change or a slight increase over time. Renin concentration and renin activity cutoff falls within the reference interval. This might be attributed to the comparatively high negative predictive value (NPV) of the cutoff point and the relatively low positive predictive value (PPV). Furthermore, this implies that other reference intervals might need to be taken consideration when using the renin test as a prognostic indicator for sepsis patients, rather than for its overall purpose. Further research is required to ascertain whether alterations in renin concentration over time may be a useful prognostic factor.
Our results suggest that renin not only exhibits prognostic performance comparable to that of lactate, a widely used biomarker, but also has advantages over lactate and can serve as an early indicator of AKI. Our results are informative because we compared the effectiveness of both existing renin measurement methods to the currently used biomarker lactate in patients with septic shock. The majority of previous studies evaluating renin as a biomarker were conducted in critically ill patients [18, 19, 22, 30]. A previous study evaluating renin as a biomarker for septic shock had a small sample size [19].
Thirteen (13.4%) of our patients had chronic liver disease, which can hinder accurate interpretation of lactate concentrations. Lactate concentrations in patients with liver failure are affected by several factors, including hyperammonemia. This condition can hinder the activity of crucial metabolic enzymes such as alpha-ketoglutarate dehydrogenase, leading to a metabolic shift toward anaerobic glycolysis. Additionally, it can affect the Cori cycle in the liver [11-13]. However, in an observational study targeting patients with septic shock and hepatic dysfunction, lactate concentrations were significantly associated with in-hospital mortality, even in cases with hepatic dysfunction [34]. In another study, lactate clearance in the first 6 or 24 hrs was significantly associated with hospital mortality in patients with hepatic dysfunction [35]. Given the consistent importance of lactate as a biomarker, even in cases of chronic liver disease, we did not exclude these patients from our study.
Neutrophil gelatinase-associated lipocalin is a notable biomarker of AKI and is related to the expression of endothelial cell adhesion molecules during sepsis, AKI development, and the concentrations of inflammatory indicators such as interleukin (IL)-6 and IL-10 [36, 37]. Nevertheless, its limited ability to predict clinical outcomes such as death has hindered its widespread use in clinical practice [38-40]. In addition, various inflammatory biomarkers, including procalcitonin and C-reactive protein, can be used to evaluate sepsis and have been used as tissue perfusion markers during initial resuscitation. Therefore, renin may be an alternative biomarker for tissue perfusion in septic shock. Additionally, it may offer potential advantages in predicting AKI.
Renin concentrations and renin activity performed equally well. When predicting the prognosis of patients with sepsis and the likelihood of AKI, plasma renin concentrations may be measured in addition to lactate concentrations. Our findings indicate that serial evaluation is more important for performance improvement than a single measurement. As an ED-based study, this study stands apart from previous studies. According to our findings, it may be possible to use renin starting in EDs.
This study had certain limitations. First, the sample size was limited. Second, we excluded patients with end-stage kidney disease and sepsis in the study patients was relatively severe; therefore, our findings cannot be generalized to all patients with sepsis. Third, specimens at 24 hrs were not collected from all patients. Fourth, we did not assess the performance of renin concentrations in guiding targeted vasopressor use. Fifth, we did not consider the use of medications such as angiotensin-converting enzyme inhibitors (ACEIs) or angiotensin receptor blockers (ARBs), which may have affected renin concentrations. However, considering previous research findings suggesting that renin concentrations are not significantly affected by medications such as ACEIs and ARBs, the administration of such medications may not substantially affect the diagnostic precision of renin concentrations and renin activity [19]. Further studies focusing on patients taking such medications and with a sufficient sample size are needed.
Despite these limitations, our findings suggest that renin concentrations and renin activity show comparable performance to lactate concentrations in predicting 28-day mortality in patients with septic shock but superior performance in predicting AKI. Renin is a potential biomarker for predicting mortality and AKI in patients with septic shock.
ACKNOWLEDGEMENTS
We would like to acknowledge and thank the following investigators from the Korean Shock Society for their advice: Gil Joon Suh (Seoul National University Hospital), Sung-Hyuk Choi (Korea University Guro Hospital), and Sung Phil Chung (Gangnam Severance Hospital).
Notes
AUTHOR CONTRIBUTIONS
Kim WY and Shin TG contributed to the study conception. Kim DS, Kim M, Park JE, and Hwang SY contributed to the study methodology. Jeong D, Chung CR, Kang H, and Oh J were involved in data curation and investigation. Lee GT, Ko BS, Chae B, and Lim TH contributed to the formal analysis. Lee GT and Ko BS wrote the original manuscript draft. Lee GT, Ko BS, Kim WY, and Shin TG reviewed and edited the manuscript. All authors have read and approved the final manuscript.
Appendix
SUPPLEMENTARY MATERIALS
Supplementary materials can be found via https://doi.org/10.3343/alm.2023.0425
References
1. Elbers PW, Ince C. 2006; Mechanisms of critical illness-classifying microcirculatory flow abnormalities in distributive shock. Crit Care. 10:221. DOI: 10.1186/cc4969. PMID: 16879732. PMCID: PMC1750971.
2. Fleischmann C, Scherag A, Adhikari NK, Hartog CS, Tsaganos T, Schlattmann P, et al. 2016; Assessment of global incidence and mortality of hospital-treated sepsis. Current estimates and limitations. Am J Respir Crit Care Med. 193:259–72. DOI: 10.1164/rccm.201504-0781OC. PMID: 26414292.
3. Moore JX, Donnelly JP, Griffin R, Howard G, Safford MM, Wang HE. 2016; Defining sepsis mortality clusters in the United States. Crit Care Med. 44:1380–7. DOI: 10.1097/CCM.0000000000001665. PMID: 27105174. PMCID: PMC4911271.
4. Namgung M, Ahn C, Park Y, Kwak IY, Lee J, Won M. 2023; Mortality among adult patients with sepsis and septic shock in Korea: a systematic review and meta-analysis. Clin Exp Emerg Med. 10:157–71. DOI: 10.15441/ceem.23.005. PMID: 36882054. PMCID: PMC10350360. PMID: 419bda7536834d6eb6551c66ec5dab10.
5. Suh GJ, Shin TG, Kwon WY, Kim K, Jo YH, Choi SH, et al. 2023; Hemodynamic management of septic shock: beyond the Surviving Sepsis Campaign guidelines. Clin Exp Emerg Med. 10:255–64. DOI: 10.15441/ceem.23.065. PMID: 37439141. PMCID: PMC10579730. PMID: cfdb2d2475f247518a1673ed7afb15f3.
6. Evans L, Rhodes A, Alhazzani W, Antonelli M, Coopersmith CM, French C, et al. 2021; Surviving sepsis campaign: international guidelines for management of sepsis and septic shock 2021. Crit Care Med. 49:e1063–143. DOI: 10.1097/CCM.0000000000005337. PMID: 34605781.
7. Singer M, Deutschman CS, Seymour CW, Shankar-Hari M, Annane D, Bauer M, et al. 2016; The third international consensus definitions for sepsis and septic shock (Sepsis-3). JAMA. 315:801–10. DOI: 10.1001/jama.2016.0287. PMID: 26903338. PMCID: PMC4968574.
8. Gu WJ, Zhang Z, Bakker J. 2015; Early lactate clearance-guided therapy in patients with sepsis: a meta-analysis with trial sequential analysis of randomized controlled trials. Intensive Care Med. 41:1862–3. DOI: 10.1007/s00134-015-3955-2. PMID: 26154408.
9. Simpson SQ, Gaines M, Hussein Y, Badgett RG. 2016; Early goal-directed therapy for severe sepsis and septic shock: a living systematic review. J Crit Care. 36:43–8. DOI: 10.1016/j.jcrc.2016.06.017. PMID: 27546746.
10. Gómez-Ramos JJ, Marín-Medina A, Prieto-Miranda SE, Dávalos-Rodríguez IP, Alatorre-Jiménez MA, Esteban-Zubero E. 2018; Determination of plasma lactate in the emergency department for the early detection of tissue hypoperfusion in septic patients. Am J Emerg Med. 36:1418–22. DOI: 10.1016/j.ajem.2017.12.068. PMID: 29291989.
11. Kraut JA, Madias NE. 2014; Lactic acidosis. N Engl J Med. 371:2309–19. DOI: 10.1056/NEJMra1309483. PMID: 25494270.
12. Casserly B, Phillips GS, Schorr C, Dellinger RP, Townsend SR, Osborn TM, et al. 2015; Lactate measurements in sepsis-induced tissue hypoperfusion: results from the Surviving Sepsis Campaign database. Crit Care Med. 43:567–73. DOI: 10.1097/CCM.0000000000000742. PMID: 25479113.
13. Bakker J, Nijsten MW, Jansen TC. 2013; Clinical use of lactate monitoring in critically ill patients. Ann Intensive Care. 3:12. DOI: 10.1186/2110-5820-3-12. PMID: 23663301. PMCID: PMC3654944.
14. Paul M, Poyan Mehr A, Kreutz R. 2006; Physiology of local renin-angiotensin systems. Physiol Rev. 86:747–803. DOI: 10.1152/physrev.00036.2005. PMID: 16816138.
15. Harrison-Bernard LM. 2009; The renal renin-angiotensin system. Adv Physiol Educ. 33:270–4. DOI: 10.1152/advan.00049.2009. PMID: 19948673.
16. Fyhrquist F, Saijonmaa O. 2008; Renin-angiotensin system revisited. J Intern Med. 264:224–36. DOI: 10.1111/j.1365-2796.2008.01981.x. PMID: 18793332. PMCID: PMC7166930.
17. Chung KS, Song JH, Jung WJ, Kim YS, Kim SK, Chang J, et al. 2017; Implications of plasma renin activity and plasma aldosterone concentration in critically ill patients with septic shock. Korean J Crit Care Med. 32:142–53. DOI: 10.4266/kjccm.2017.00094. PMID: 31723628. PMCID: PMC6786707. PMID: 7cfb1c9a24dc4bde8233c8ccb3f28911.
18. Bellomo R, Forni LG, Busse LW, McCurdy MT, Ham KR, Boldt DW, et al. 2020; Renin and survival in patients given angiotensin II for catecholamine-resistant vasodilatory shock. A clinical trial. Am J Respir Crit Care Med. 202:1253–61. DOI: 10.1164/rccm.201911-2172OC. PMID: 32609011. PMCID: PMC7605187.
19. Gleeson PJ, Crippa IA, Mongkolpun W, Cavicchi FZ, Van Meerhaeghe T, Brimioulle S, et al. 2019; Renin as a marker of tissue-perfusion and prognosis in critically ill patients. Crit Care Med. 47:152–8. DOI: 10.1097/CCM.0000000000003544. PMID: 30653055.
20. Campbell DJ, Nussberger J, Stowasser M, Danser AH, Morganti A, Frandsen E, et al. 2009; Activity assays and immunoassays for plasma renin and prorenin: information provided and precautions necessary for accurate measurement. Clin Chem. 55:867–77. DOI: 10.1373/clinchem.2008.118000. PMID: 19264850.
21. Nguyen M, Denimal D, Dargent A, Guinot PG, Duvillard L, Quenot JP, et al. 2019; Plasma renin concentration is associated with hemodynamic deficiency and adverse renal outcome in septic shock. Shock. 52:e22–30. DOI: 10.1097/SHK.0000000000001285. PMID: 30407370.
22. Leśnik P, Łysenko L, Krzystek-Korpacka M, Woźnica-Niesobska E, Mierzchała-Pasierb M, Janc J. 2022; Renin as a marker of tissue perfusion, septic shock and mortality in septic patients: a prospective observational study. Int J Mol Sci. 23:9133. DOI: 10.3390/ijms23169133. PMID: 36012398. PMCID: PMC9409106. PMID: 8b3457675e054b0bb7b2f171c75b4b87.
23. Park H, Shin TG, Kim WY, Jo YH, Hwang YJ, Choi SH, et al. 2022; A quick Sequential Organ Failure Assessment-negative result at triage is associated with low compliance with sepsis bundles: a retrospective analysis of a multicenter prospective registry. Clin Exp Emerg Med. 9:84–92. DOI: 10.15441/ceem.22.230. PMID: 35843608. PMCID: PMC9288871. PMID: fce8323a50a3480abd838598d0ee6a85.
24. GC labs. Renin activity [LC/MS-MS]. https://gclabs.co.kr/test/item/view?code=N883.
25. DRG Instruments GmbH. DRG Renin (active) ELISA (EIA-5125). https://www.drg-diagnostics.de/49-1-DRG+Renin+active+ELISA.html.
26. Khwaja A. 2012; KDIGO clinical practice guidelines for acute kidney injury. Nephron Clin Pract. 120:c179–84. DOI: 10.1159/000339789. PMID: 22890468.
27. Závada J, Hoste E, Cartin-Ceba R, Calzavacca P, Gajic O, Clermont G, et al. 2010; A comparison of three methods to estimate baseline creatinine for RIFLE classification. Nephrol Dial Transplant. 25:3911–8. DOI: 10.1093/ndt/gfp766. PMID: 20100732.
28. Jentzer JC, Vallabhajosyula S, Khanna AK, Chawla LS, Busse LW, Kashani KB. 2018; Management of refractory vasodilatory shock. Chest. 154:416–26. DOI: 10.1016/j.chest.2017.12.021. PMID: 29329694.
29. Lee GT, Hwang SY, Park JE, Jo IJ, Kim WY, Chung SP, et al. 2021; Diagnostic accuracy of lactate levels after initial fluid resuscitation as a predictor for 28 day mortality in septic shock. Am J Emerg Med. 46:392–7. DOI: 10.1016/j.ajem.2020.10.020. PMID: 33092937.
30. Jeyaraju M, McCurdy MT, Levine AR, Devarajan P, Mazzeffi MA, Mullins KE, et al. 2022; Renin kinetics are superior to lactate kinetics for predicting in-hospital mortality in hypotensive critically ill patients. Crit Care Med. 50:50–60. DOI: 10.1097/CCM.0000000000005143. PMID: 34166293.
31. Doerschug KC, Delsing AS, Schmidt GA, Ashare A. 2010; Renin-angiotensin system activation correlates with microvascular dysfunction in a prospective cohort study of clinical sepsis. Crit Care. 14:R24. DOI: 10.1186/cc8887. PMID: 20175923. PMCID: PMC2875539.
32. Khanna A, English SW, Wang XS, Ham K, Tumlin J, Szerlip H, et al. 2017; Angiotensin II for the Treatment of Vasodilatory Shock. N Engl J Med. 377:419–30. DOI: 10.1056/NEJMoa1704154. PMID: 28528561.
33. Puskarich MA, Trzeciak S, Shapiro NI, Albers AB, Heffner AC, Kline JA, et al. 2013; Whole blood lactate kinetics in patients undergoing quantitative resuscitation for severe sepsis and septic shock. Chest. 143:1548–53. DOI: 10.1378/chest.12-0878. PMID: 23740148. PMCID: PMC3673659.
34. Kang YR, Um SW, Koh WJ, Suh GY, Chung MP, Kim H, et al. 2011; Initial lactate level and mortality in septic shock patients with hepatic dysfunction. Anaesth Intensive Care. 39:862–7. DOI: 10.1177/0310057X1103900510. PMID: 21970130.
35. Ha TS, Shin TG, Jo IJ, Hwang SY, Chung CR, Suh GY, et al. 2016; Lactate clearance and mortality in septic patients with hepatic dysfunction. Am J Emerg Med. 34:1011–5. DOI: 10.1016/j.ajem.2016.02.053. PMID: 26976769.
36. Romejko K, Markowska M, Niemczyk S. 2023; The review of current knowledge on neutrophil gelatinase-associated lipocalin (NGAL). Int J Mol Sci. 24:10470. DOI: 10.3390/ijms241310470. PMID: 37445650. PMCID: PMC10341718. PMID: 9faf4d8310e2460aa7c6b3fd0e3c7470.
37. Pan HC, Yang SY, Chiou TT, Shiao CC, Wu CH, Huang CT, et al. 2022; Comparative accuracy of biomarkers for the prediction of hospital-acquired acute kidney injury: a systematic review and meta-analysis. Crit Care. 26:349. DOI: 10.1186/s13054-022-04223-6. PMID: 36371256. PMCID: PMC9652605. PMID: 4500d9b124fc471a870bcfc365d2b2f5.
38. Macdonald SPJ, Stone SF, Neil CL, van Eeden PE, Fatovich DM, Arendts G, et al. 2014; Sustained elevation of resistin, NGAL and IL-8 are associated with severe sepsis/septic shock in the emergency department. PLoS One. 9:e110678. DOI: 10.1371/journal.pone.0110678. PMID: 25343379. PMCID: PMC4208806. PMID: f0a67426bc2c49529a4e3927be22b38c.
39. Macdonald SPJ, Bosio E, Neil C, Arendts G, Burrows S, Smart L, et al. 2017; Resistin and NGAL are associated with inflammatory response, endothelial activation and clinical outcomes in sepsis. Inflamm Res. 66:611–9. DOI: 10.1007/s00011-017-1043-5. PMID: 28424824.
40. Zhang A, Cai Y, Wang PF, Qu JN, Luo ZC, Chen XD, et al. 2016; Diagnosis and prognosis of neutrophil gelatinase-associated lipocalin for acute kidney injury with sepsis: a systematic review and meta-analysis. Crit Care. 20:41. DOI: 10.1186/s13054-016-1212-x. PMID: 26880194. PMCID: PMC4754917.
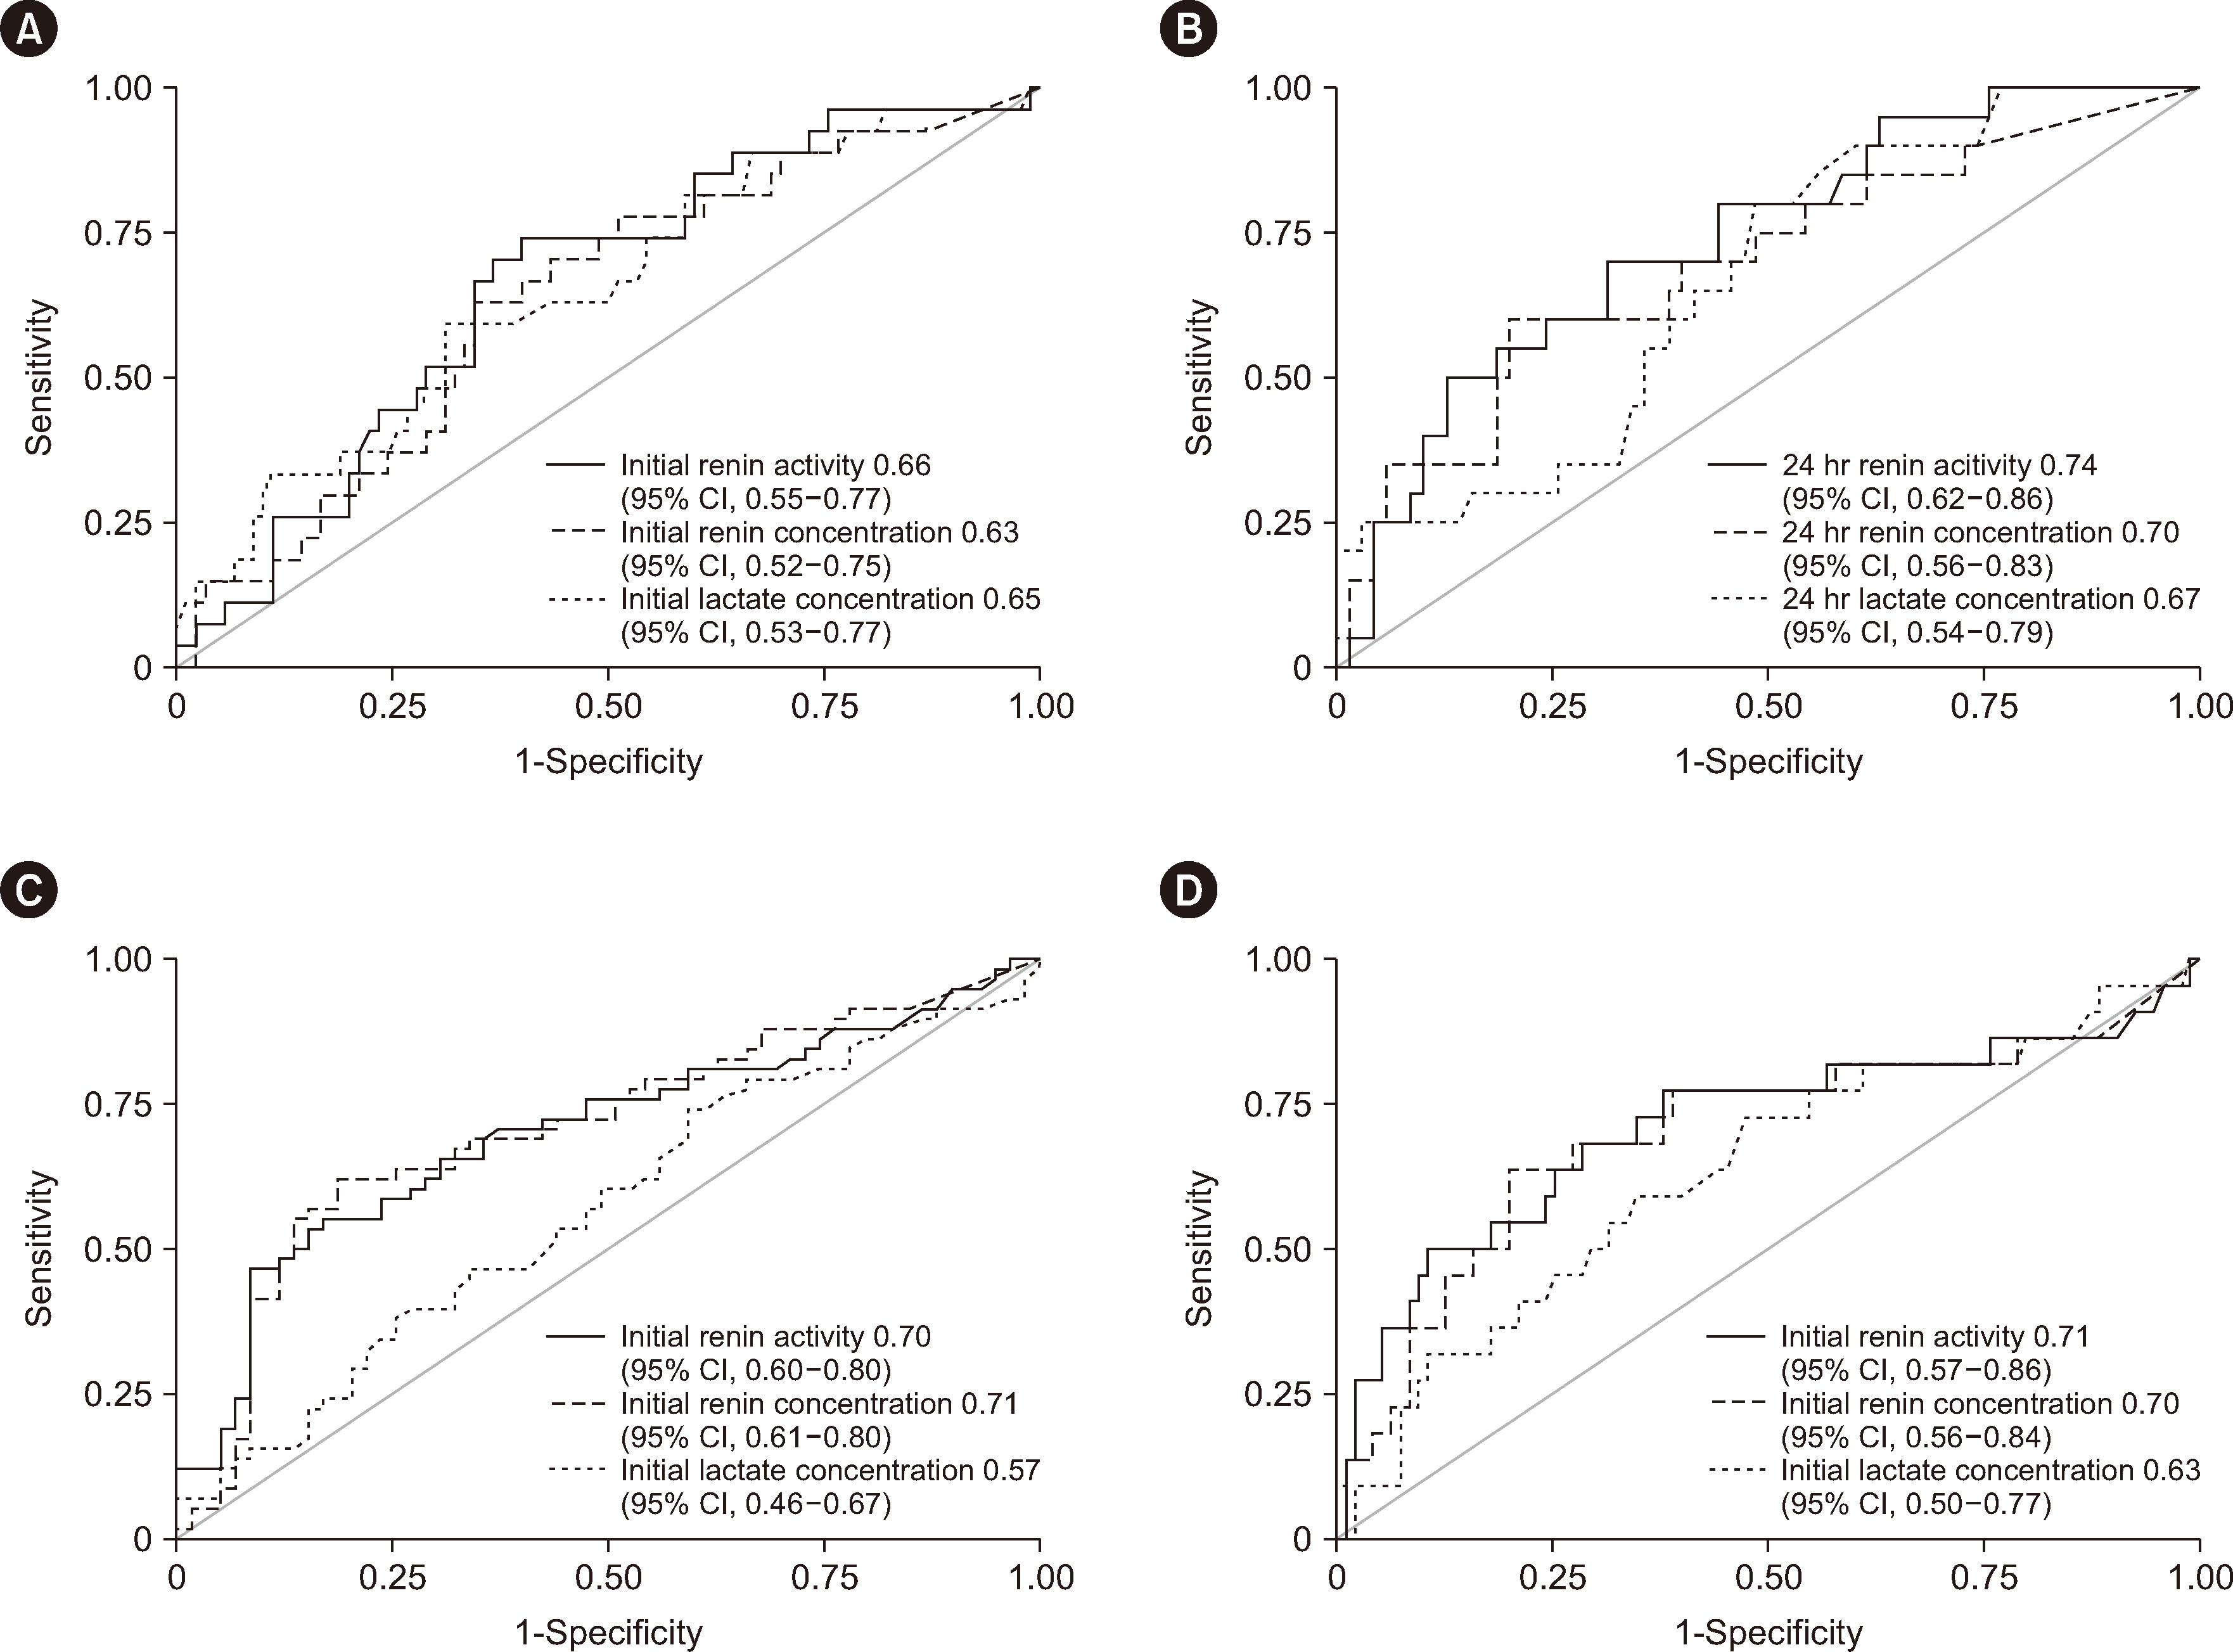
Table 1
Characteristics | Total (N=117) | Survivors (N=90) | Non-survivors (N=27) | P |
---|---|---|---|---|
Age, yrs | 67.5 (59.9–75.4) | 66.7 (59.6–74.9) | 68.8 (61.0–80.1) | 0.201 |
Male, N (%) | 74 (63.3) | 53 (58.9) | 21 (77.8) | 0.074 |
Preexisting conditions, N (%) | ||||
Hypertension | 44 (40.7) | 35 (42.2) | 9 (36.0) | 0.582 |
Diabetes | 41 (39.8) | 28 (35.0) | 13 (56.5) | 0.063 |
Chronic heart disease | 16 (16.3) | 12 (15.6) | 4 (19.1) | 0.703 |
Chronic lung disease | 5 (5.2) | 2 (2.7) | 3 (14.3) | 0.034 |
CVA | 11 (11.1) | 9 (11.5) | 2 (9.5) | 0.794 |
Chronic kidney disease | 6 (6.1) | 5 (6.5) | 1 (4.8) | 0.769 |
Chronic liver disease | 13 (13.4) | 9 (11.8) | 4 (19.1) | 0.391 |
Metastatic cancer | 49 (50.0) | 39 (51.3) | 10 (45.5) | 0.628 |
Infection source, N (%) | ||||
Lungs | 28 (36.4) | 15 (25.4) | 13 (72.2) | <0.001 |
Urinary tract | 26 (35.1) | 21 (37.5) | 5 (27.8) | 0.452 |
Gastrointestinal | 29 (38.2) | 22 (36.7) | 7 (43.8) | 0.604 |
Hepatobiliary | 19 (25.7) | 18 (31.0) | 1 (6.3) | 0.045 |
Others | 21 (18.0) | 17 (18.9) | 4 (14.8) | 0.629 |
Blood culture-positive, N (%) | 60 (51.3) | 44 (48.9) | 16 (59.3) | 0.344 |
Vasoactive drug, N (%) | 111 (94.9) | 85 (94.4) | 26 (96.3) | 0.702 |
RRT, N (%) | 22 (18.8) | 14 (15.6) | 8 (29.6) | 0.101 |
APACHE II score† | 25 (19–29) | 24 (18–28) | 32 (24–37) | <0.001 |
Maximal SOFA at 24 hrs | 9 (6–12) | 8 (6–11) | 12 (9–15) | <0.001 |
Table 2
Variables | 28-day mortality | AKI development | ||||||
---|---|---|---|---|---|---|---|---|
Total (N=117) | Survivors (N=90) | Non-survivors (N=27) | P | No AKI (N=59) | AKI (N=58) | P | ||
Renin activity, ng/mL/hr* | ||||||||
Initial (N=117) | 2.4 (0.8–8.2) | 2.1 (0.6–6.0) | 5.3 (1.7–13.5) | 0.012 | 1.7 (0.5–3.6) | 5.7 (1.8–12.0) | <0.001 | |
At 24 hrs (N=94) | 1.5 (0.4–5.9) | 1.1 (0.3–4.0) | 6.5 (1.4–16.0) | 0.001 | 1.0 (0.3–2.6) | 3.3 (0.8–9.6) | 0.006 | |
Renin concentration, pg/mL* | ||||||||
Initial (N=117) | 25.6 (8.2–101.7) | 19.7 (7.6–90.6) | 50.5 (19.6–146.5) | 0.034 | 16.4 (6.9–32.2) | 73.8 (15.8–154.5) | <0.001 | |
At 24 hrs (N=101) | 14.2 (4.5–68.1) | 12.0 (4.0–38.9) | 63.7 (11.0–273.8) | 0.006 | 7.9 (4.0–28.2) | 27.7 (7.6–107.3) | 0.001 | |
Lactate concentration, mmol/L* | ||||||||
Initial (N=117) | 4.5 (2.6–6.8) | 4.3 (2.5–6.4) | 5.5 (3.4–9.8) | 0.019 | 4.1 (2.5–6.1) | 4.6 (3.0–7.2) | 0.213 | |
At 24 hrs (N=95) | 2.2 (1.5–3.8) | 2.1 (1.4–3.3) | 2.5 (2.1–8.6) | 0.009 | 1.8 (1.3–2.6) | 2.3 (1.8–5.2) | 0.002 |