Abstract
BACKGROUND/OBJECTIVES
The high consumption of purine-rich meat is associated with hyperuricemia. However, there is limited evidence linking the consumption of red and processed meat to the genetic risk of hyperuricemia. We investigated the relationship between various combinations of red and processed meat consumption and the polygenic risk scores (PRSs) and the incidence of hyperuricemia in middle-aged Koreans.
SUBJECTS/METHODS
We analyzed the data from 44,053 participants aged ≥40 years sourced from the Health Examinees (HEXA) cohort of the Korean Genome and Epidemiology Study (KoGES). Information regarding red and processed meat intake was obtained using a semiquantitative food frequency questionnaire (SQ-FFQ). We identified 69 independent single-nucleotide polymorphisms (SNPs) at uric acid-related loci using genome-wide association studies (GWASs) and clumping analyses. The individual PRS, which is the weighted sum of the effect size of each allele at the SNP, was calculated. We used multivariable Cox proportional hazards models adjusted for covariates to determine the relationship between red and processed meat intake and the PRS in the incidence of hyperuricemia.
RESULTS
During an average follow-up period of 5 years, 2,556 patients with hyperuricemia were identified. For both men and women, the group with the highest red and processed meat intake and the highest PRS was positively associated with the development of hyperuricemia when compared with the group with the lowest red and processed meat intake and the lowest PRS (hazard ratio [HR], 2.72; 95% confidence interval [CI], 2.10–3.53; P < 0.0001; HR, 3.28; 95% CI, 2.45–4.40; P < 0.0001).
Hyperuricemia, characterized by elevated serum uric acid levels [1], is an independent risk factor for chronic kidney disease [2], hypertension [3], diabetes [4], cardiovascular disease (CVD) [5], and all-cause mortality [6]. With a steady increase in the worldwide incidence of hyperuricemia, the condition has emerged as a public health concern [78]. It is now understood that endogenous overproduction due to elevated levels of purine breakdown, decreased urate excretion, or a combination of both, may raise the risk of hyperuricemia [9].
The prevalence of hyperuricemia in the United States and South Australia was 14.6% in 2015–2016 [10] and 16.6% in 2008–2010 [11], respectively. The prevalence of hyperuricemia in China has been on the rise and was reported to be 11.1% in 2015–2016 and 14.0% in 2018–2019 [12]. The prevalence of hyperuricemia in Korea between 2019 and 2020 was 14.6% [13]. In addition, the prevalence of gout in Korea has increased 4.4-fold (0.17% in 2001 to 0.76% in 2015) over 15 yrs [1415]. These rising numbers clearly suggest that the prevention and management of hyperuricemia are crucial for managing comorbid conditions.
Serum uric acid levels reflect current dietary habits [16]. Several food groups, including red and processed meats, can affect uric acid levels. These meats are high in purines, which are metabolized into uric acid in the human body [171819], and their excessive consumption can lead to overproduction and an overall increase in uric acid levels [1820]. Epidemiological evidence has suggested a positive correlation between serum uric acid levels and meat intake in Chinese [21], and American adults, with the latter data obtained from the National Health and Nutrition Examination Survey (NHANES) III [18].
In addition to lifestyle factors, important genetic factors associated with uric acid production and excretion have been identified in previous genome-wide association studies (GWAS) [22232425]. In GWAS involving over 143,160 participants of European ancestry [26] and 457,690 participants of trans-ancestry [27], the solute carrier family 2 member 9 (SLC2A9) and ATP binding cassette subfamily G member 2 (ABCG2) genes were identified as being associated with hyperuricemia. Notably, there exists a Eurocentric bias in global GWAS, as a result of which the non-European populations are being disproportionately overlooked [2829]. Although more than 180 loci related to serum uric acid have been identified in previous ancestral GWAS [2730], identifying additional genetic variants in the Korean population and exploring unrevealed heritability through a structured assessment of the differential effects of common and rare variants are crucial.
In polygenic diseases, the presence of single variants may not be sufficient to assess the actual disease risk. This requires the identification of a sufficiently informative measure of the genetic load using a combined set of multiple risk variants. The polygenic risk score (PRS) is a useful tool wherein the data across multiple loci is combined to evaluate the genetic risk, which is the weighted sum of the number of risk alleles in an individual [31]. The PRS, which is calculated based on genotype profiles and associated GWAS data, is the estimated quantified value of an individual's alleles for a trait or disease [32]. Stratifying individuals at high polygenic risk can help in the selection of a diagnosis or treatment early in the course of the disease and the prediction of subsequent disease states, thus providing clinical utility [29333435]. Despite methodological concerns regarding PRS development and the validity of its criteria [36], PRS is a good predictor of disease status [333435]. However, data regarding the relationship between hyperuricemia and PRS are lacking.
Several studies have shown a link between hyperuricemia and the consumption of red and processed meat [182021] and between hyperuricemia and specific genes [22232425262730]. However, few studies have investigated the association between the intake of red and processed meat, PRS, and hyperuricemia. Moreover, no study has used a prospective cohort design to clarify this relationship among Korean adults. Therefore, we hypothesized that different combinations of red and processed meat intakes and PRS could influence the development of hyperuricemia in middle-aged Koreans. To confirm this, we performed a GWAS of uric acid levels in middle-aged Korean adults and assessed the genetic influences by calculating the individual PRS using identified single nucleotide polymorphisms (SNPs).
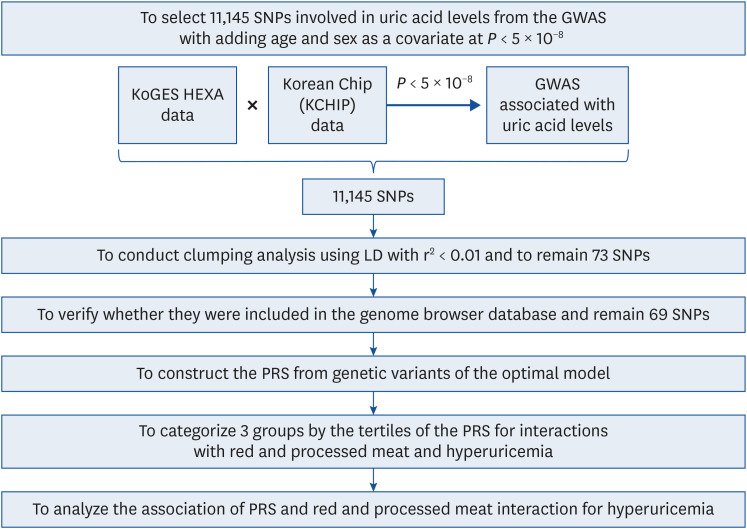
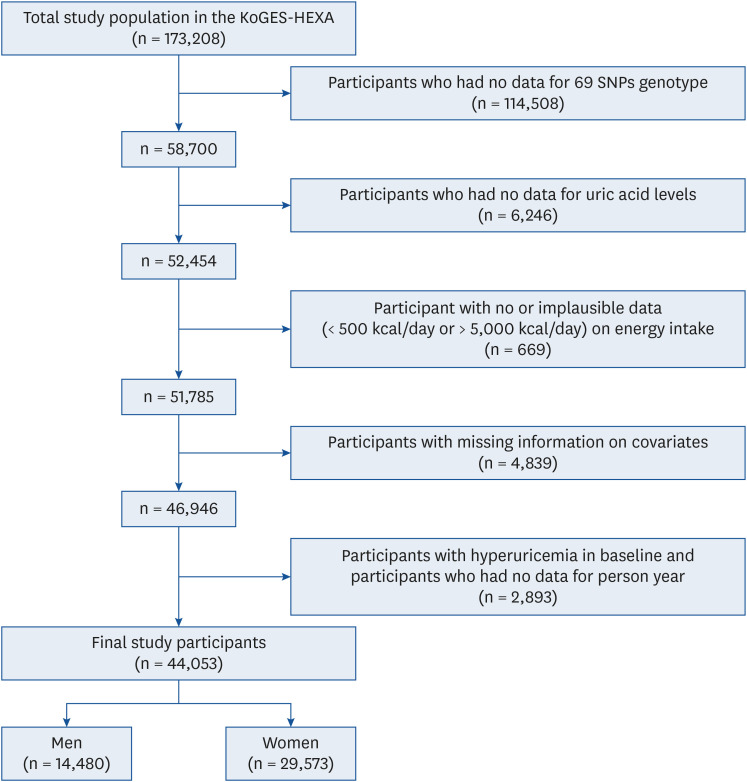
This study was performed using data from the Korean Genome and Epidemiology Study (KoGES), which is a large population-based study that investigates the association of genetic and environmental factors with various chronic diseases [37]. From the available data, we selected data from the KoGES Health Examinees (HEXA) cohort, which included urban-dwelling participants aged 40 yrs or older. Baseline data were gathered from 2004 to 2013, and follow-up data were gathered from 2012 to 2016. Of the total 173,208 participants, those without the genotype data of the 69 identified SNPs (n = 114,508), without data on uric acid levels (n = 6,246), with no or implausible data (less than 500 kcal/day or greater than 5,000 kcal/day) on energy intake (n = 669), without data on covariates (n = 4,839), with hyperuricemia (serum uric acid level exceeding 7.0 mg/dL in men and exceeding 6.0 mg/dL in women) at baseline, or with missing data on the number of person-yrs of follow-up (n = 2,893) were excluded. The study finally included 44,053 participants (14,480 men and 29,573 women) (Fig. 1). At the end of follow-up, participants with hyperuricemia were defined as the study group, and participants without hyperuricemia were defined as the control group. The Institutional Review Board (IRB) of Inha University approved the use of these data on February 18, 2022 (IRB number: 220215-1A). This study was conducted using bioresources from the National Biobank of Korea, the Korea Disease Control and Prevention Agency, Republic of Korea (KBN-2020-016).
The dietary intake of the participants was examined using a semiquantitative food frequency questionnaire (SQ-FFQ) that included 106 food items [38]. The SQ-FFQ was administered at baseline and comprised nine frequency items ranging from “never/rarely” to “three or more times a day” and three intake items: 0.5, 1.0, and 2 standard portion sizes. The usual intake of the 106 foods and beverages was converted to daily intake (g) by multiplying the intake frequency by the standard portion size [39]. The daily intake of foods included in each food group was added and analyzed to obtain the daily intake by food group (g/day). Of the 106 food items included in the SQ-FFQ, red meat comprised roasted beef, roasted pork, stewed pork, pork belly, and edible viscera; processed meat included sausage and ham; and white meat included chicken and chicken stew [40]. The classification of food groups, including fish, shellfish, vegetables, fruits, and legumes, was based on the guidelines from the KoGES database [41]. An individual’s total energy and nutrient intake was determined by multiplying the intake frequency of each food by the corresponding calories and nutrients and then summing up the results for all the foods [42].
Genomic DNA was obtained from peripheral whole-blood samples. For the imputed genotype, data were generated from the Korea Biobank Array (Korean Chip, KCHIP, Seoul, Korea), which was previously used to study the genetic drivers of diseases in the Korean population [43]. The exclusion criteria were as follows: high rates of missed genotype calls (> 4%), genotype reading accuracy < 98%, heterozygosity > 30%, and sex mismatch [4445]. Following genotyping and sample quality control, the GWAS was executed after normalizing for age and sex to select the SNPs significantly related to the participants’ uric acid levels (P-value < 5 × 10⁻⁸). Clumping analysis in PLINK version 1.9 was used to identify independent SNPs using the following criteria: genomic distance (< 1,000 kb), linkage disequilibrium (LD, r2 < 0.01), and P-value (< 5 × 10⁻⁸) [46].
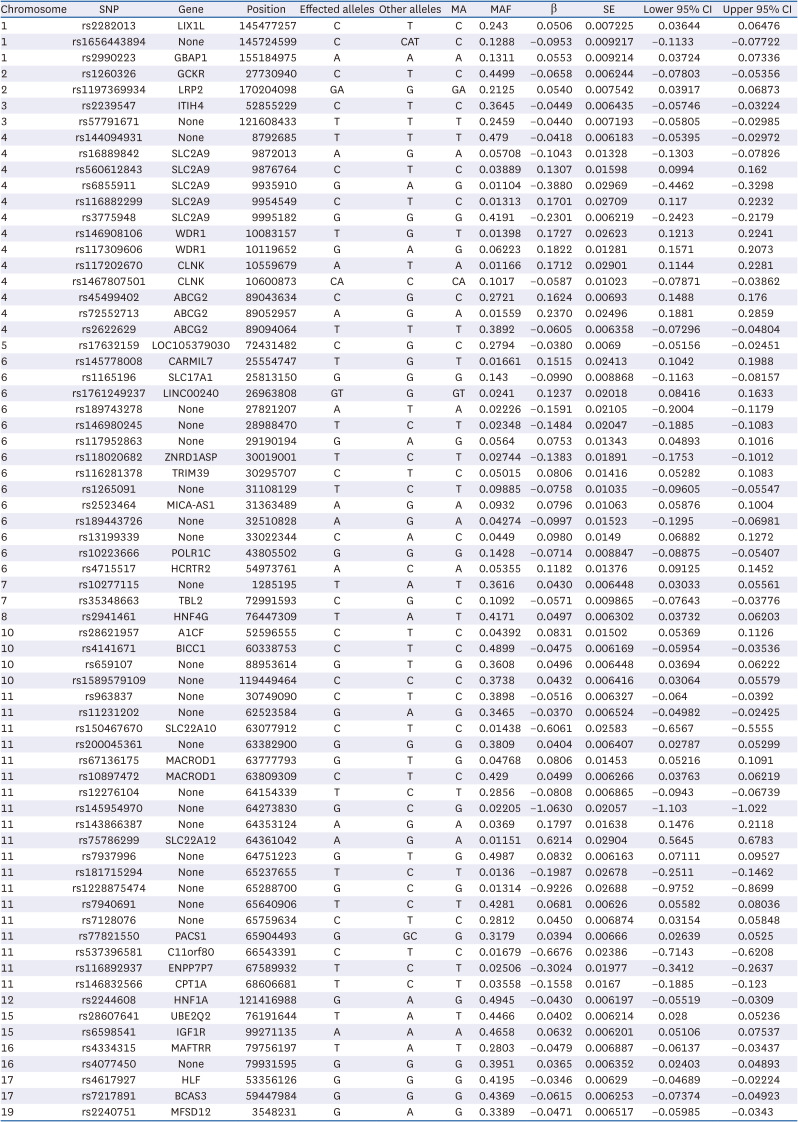
A total of 73 independent SNPs were identified using clumping analysis. The locations of the 73 SNPs were confirmed using the Genome Reference Consortium Human Genome Build 37, National Center for Biotechnology Information [47]. After excluding SNPs whose exact location was unknown, 69 SNPs were ultimately selected for the PRS analysis (Fig. 2). In this study, the SNPs identified in the GWAS were weighted by multiplying by the effect size corresponding to each allele. Thereafter, individual weighted PRSs were calculated by summing all weighted risk alleles, Ni, by the effect size βi, as shown in Equation 1 [4849].
The PRS was classified into low, middle, and high tertiles for men and women. The mean values and ranges for each tertile group were as follows: for men, low was −0.92 (range, −6.51 to −0.37), middle −0.18 (range, −0.37 to 0.01), and high 0.29 (range, 0.01 to 1.47); for women, low was −0.85 (range, −5.11 to −0.34), middle −0.15 (range, −0.34 to 0.03), and high 0.31 (range, 0.03 to 1.77).
The definition of hyperuricemia was set as follows: serum uric acid level exceeding 7.0 mg/dL in men and 6.0 mg/dL in women [50515253].
Blood samples were collected after overnight fasting. Serum uric acid concentrations were measured using enzymatic colorimetric methods with an automatic analyzer (ADVIA 1650 and 1800; Siemens, Tarrytown, NY, USA) [54]. Baseline measurements were conducted from 2004 to 2013, and follow-up measurements were completed from 2012 to 2016 [55]. The analysis ended on the date of follow-up [42].
Self-administered questionnaires were used to collect sociodemographic and health-related lifestyle data. Education was categorized into four groups: less than elementary school, middle school, high school, and college or beyond. Drinking status was divided into three groups: “current drinker” (consuming alcohol at the time of the survey), “past drinker” (had been drinking but quit), and “non-drinker” (had never consumed alcohol). Smoking status was divided into three groups: “current smoker” (≥ 100 cigarettes over the lifetime and were smoking at the time of the survey), “past smoker” (≥ 100 cigarettes over the lifetime but were currently quitting at the time of the survey), or “non-smoker” (< 100 cigarettes over the lifetime) [56]. Physical activity was categorized as: “active” (performed physical activity for at least 30 min daily for at least 5 days a week) or “inactive” [57]. Regarding the presence of hypertension, diabetes, or hyperlipidemia, participants answered yes or no to whether they had previously been diagnosed [51].
The health examination included anthropometric measurements and serum laboratory tests. All anthropometric measurements were obtained by trained and skilled examiners using a consistent and standardized methodology. Body mass index (BMI) was calculated by dividing the weight in kilograms by the square of the height in meters (kg/m2). Systolic and diastolic blood pressures were measured twice on the right arm using a standardized mercury or automatic sphygmomanometer, and the mean of the 2 blood pressures was recorded [58]. All blood samples were obtained after the participants had fasted overnight. Blood concentrations of glucose, total cholesterol, high-density lipoprotein (HDL) cholesterol, triglycerides, albumin, creatinine were measured by enzymatic colorimetric methods using an automated analyzer (ADVIA 1650 and 1800; Siemens) [5859].
The demographics of the participants were compared by categorizing them according to their hyperuricemia status and PRS. Continuous variables were expressed as the mean ± SD using the t-test and general linear model, and post-hoc comparisons were performed using the Bonferroni correction. Categorical variables were expressed as frequencies (%) using the χ2 test. Genetic analysis was performed using the PLINK version 1.9 software (https://www.cog-genomics.org/plink/1.9, accessed on June 19, 2023).
To analyze the relationship between the consumption of red and processed meat and hyperuricemia and the relationship between the combination of red and processed meat intake and the PRS and hyperuricemia, the quantum of red and processed meat intake was classified into tertiles for men and women. The independent variables were red and processed meat intake and the PRS, whereas the dependent variable was set as hyperuricemia.
A multivariable Cox proportional hazards model was used to ascertain the hazard ratios (HRs) and 95% confidence intervals (CIs) for the following outcomes: consumption of red and processed meats and hyperuricemia, PRS and hyperuricemia, and various combinations of red and processed meat intake and PRS and hyperuricemia. P-values for the linear trend and interaction were also calculated. This analysis was performed after adjusting for age, income, education, drinking/smoking status, regular exercise, BMI, total energy intake, protein intake, intake of white meat, fish, shellfish, fruit, vegetables, and legumes, hypertension, diabetes mellitus, and hyperlipidemia. All models were evaluated to confirm the assumption of proportional hazards and were considered consistent with the models that included time-dependent covariates. SAS version 9.4 (SAS Institute, Cary, NC, USA) was used for all statistical analyses except for the genetic analyses. The criterion for statistical significance was set at P < 0.05.
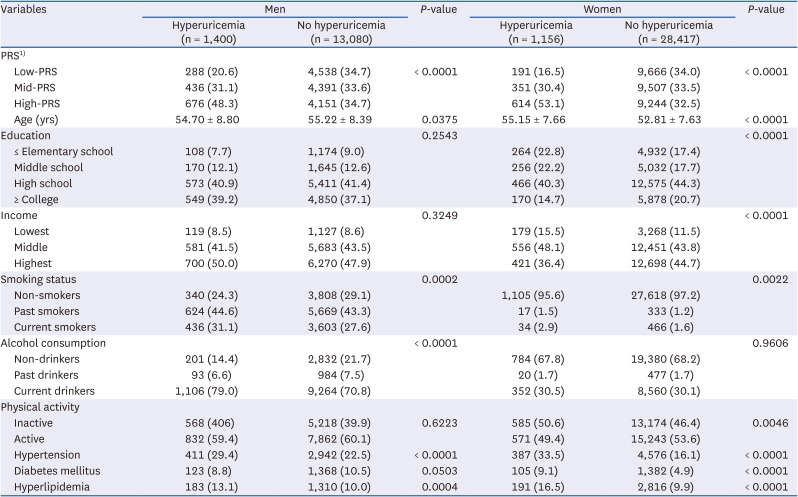
Table 1 presents the demographic characteristics of the participants included in the study based on their hyperuricemia status. The average follow-up period was 5 yrs, and 2,556 cases of hyperuricemia were recorded. The participants were divided into groups with hyperuricemia (n = 2,556) and without hyperuricemia (n = 41,497) at the end of the average 5 yrs follow-up. The percentage of PRS differed significantly between men and women (P < 0.05). The group without hyperuricemia had a higher proportion of low- and mid-PRS subjects, whereas the proportion of high-PRS subjects was higher in the hyperuricemia group. Both men and women in the hyperuricemia group were older than those in the group without hyperuricemia (P < 0.05). Significant differences in education and income levels were identified only among the women. The number of participants who attended high school in both the groups with and without hyperuricemia was significantly higher than that of participants in the other education categories (elementary, middle school, and ≥ college). The rate of the lowest-income group was much lower than that of the middle- or highest-income groups. There were significant differences in the smoking status between men and women. Among men, the percentage of past-smokers was significantly higher than that of non/current smokers in both the groups with and without hyperuricemia (all P < 0.05). Among women, the percentage of non-smokers was significantly higher than that of past/current smokers in both the groups with and without hyperuricemia (all P < 0.05). Furthermore, significant differences in the drinking status were only observed in men, and the percentage of current drinkers was significantly higher than the non/past drinkers in both the groups with and without hyperuricemia (all P < 0.05). Significant differences in physical activity were observed only among women. The hyperuricemia group had a higher proportion of women who did not exercise regularly compared to the group without hyperuricemia (P < 0.05). The diagnoses of hypertension and dyslipidemia also significantly differed between men and women. The rates of hypertension and dyslipidemia were higher in the hyperuricemia group versus group without hyperuricemia in both men and women (all P < 0.05). In women, a significant contrast was observed in the diagnosis of diabetes, which was observed more in the hyperuricemia group than in the group without hyperuricemia (P < 0.05).
Categorical variables are presented as numbers (%), and continuous variables are presented as mean ± SD. P-values were determined using the t-test for continuous variables and the χ2 test for categorical variables.
PRS, polygenic risk score.
1)The PRS distribution was categorized into low, middle, and high tertiles, with mean values as follows: low −0.92 (range −6.51 to −0.37), middle −0.18 (−0.37 to 0.01), and high 0.29 (0.01 to 1.47) in men; low −0.85 (range −5.11 to −0.34), middle −0.15 (−0.34 to 0.03), and high 0.31 (0.03 to 1.77) in women.
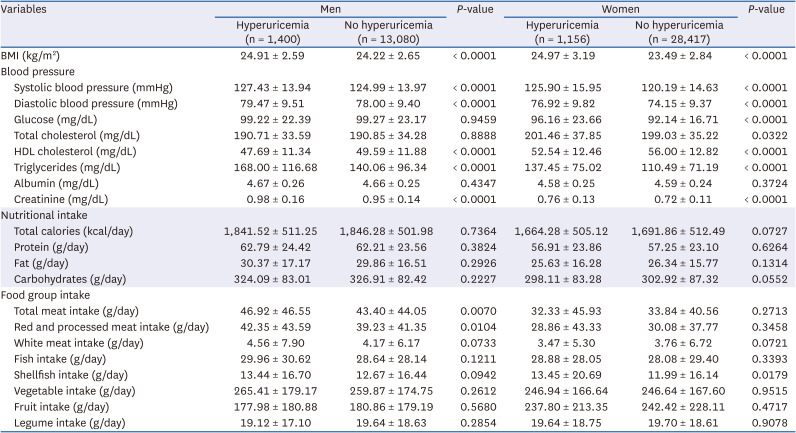
The anthropometric, biochemical, and dietary data of the participants included in the study based on their hyperuricemia status are presented in Table 2. The BMI, systolic and diastolic blood pressure, triglyceride levels, HDL cholesterol levels, and creatinine levels were significantly higher in the hyperuricemia group than in the group without hyperuricemia for both men and women (all P < 0.05). Women with hyperuricemia had higher fasting blood glucose and total cholesterol levels (all P < 0.05). The differences in food group intake according to the presence or absence of hyperuricemia in men and women were as follows: in men, significant differences were observed in total meat intake and red and processed meat intake, with the hyperuricemia group having a higher intake of these foods than the group without hyperuricemia (P < 0.05); in women, a significant difference was found only in shellfish intake, with the hyperuricemia group consuming more shellfish than the group without hyperuricemia.
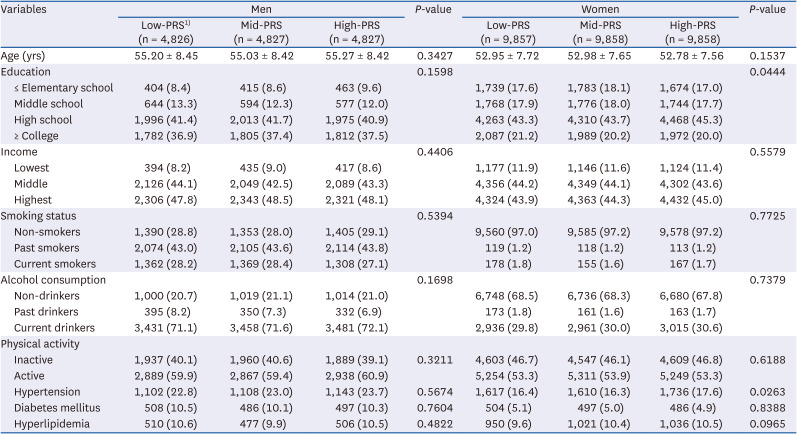
The demographic characteristics of the participants included in the study based on the tertiles of the PRS are presented in Table 3. A significant difference in educational levels was only observed among women, with the highest proportion of women educated up to high school level among all the PRS groups (P < 0.05). Furthermore, a significant difference in the incidence of hypertension was observed among women, with a higher incidence of hypertension observed in the high-PRS group than in the low- and mid-PRS groups (P < 0.05). No meaningful associations with the PRS were observed for the other variables in either men or women.
Categorical variables are presented as numbers (%), and continuous variables are presented as the mean ± SD. P-values were determined using analysis of variance for continuous variables and the χ2 test for categorical variables.
PRS, polygenic risk score.
1)The PRS distribution was categorized into low, middle, and high tertiles, with mean values as follows: low −0.92 (range −6.51 to −0.37), middle −0.18 (−0.37 to 0.01), and high 0.29 (0.01 to 1.47) in men; low −0.85 (range −5.11 to −0.34), middle −0.15 (−0.34 to 0.03), and high 0.31 (0.03 to 1.77) in women.
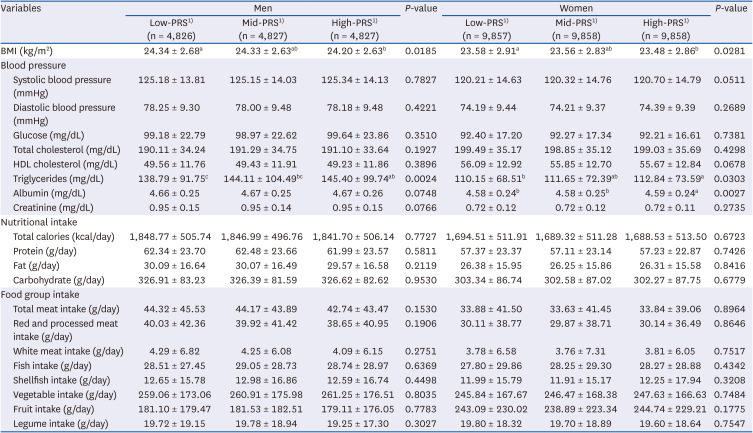
Table 4 presents the anthropometric, biochemical, and dietary data of the participants included in the study based on the tertiles of the PRS. The BMI differed significantly for both men and women and was higher in the low-PRS group than in the high-PRS group (P < 0.05). The triglyceride levels differed significantly between the men and women. In men, the triglyceride levels were lower in the low-PRS group than in the mid- and high-PRS groups, whereas in women, the triglyceride levels were lower in the low-PRS group than in the high-PRS group (P < 0.05). Albumin levels differed significantly only among women. The albumin levels were higher in the high-PRS group than in the low- or mid-PRS groups (P < 0.05). No meaningful associations with the PRS were observed for the other variables in either men or women.
Categorical variables are presented as numbers (%), and continuous variables are presented as the mean ± SD. P-values were determined using analysis of variance for continuous variables and the χ2 test for categorical variables.
PRS, polygenic risk score; BMI, body mass index; HDL, high-density lipoprotein.
1)The PRS distribution was categorized into low, middle, and high tertiles, with mean values as follows: low -0.92 (range −6.51 to −0.37), middle -0.18 (−0.37 to 0.01), and high 0.29 (0.01 to 1.47) in men; low -0.85 (range −5.11 to −0.34), middle -0.15 (−0.34 to 0.03), and high 0.31 (0.03 to 1.77) in women.
a-cDifferent superscript letters indicate significant differences among groups according to Bonferroni’s test at P < 0.05.
To explore the potential attrition bias, the baseline characteristics of the non-included participants were compared with those of the 44,053 included participants (Supplementary Tables 1 and 2). The non-included participants group had a smaller proportion of women and the mean age was slightly lower than that of the included participants (all P < 0.05). Both included and non-included participants had the highest percentage of participants with high school education and the highest income level category (all P < 0.05). The proportion of non-smokers was significantly higher, and the proportion of past drinkers was significantly lower in both included and non-included participants compared to other categories of drinkers (all P < 0.05). In terms of physical activity, both the included and non-included participants had a higher proportion of active participants (P < 0.05). The non-included participants group had a slightly higher proportion of participants diagnosed with hypertension and the included participants group had a slightly higher proportion of participants diagnosed with hyperlipidemia (all P < 0.05). The BMI, systolic and diastolic blood pressure, blood glucose, total cholesterol, HDL cholesterol, triglycerides, albumin, and creatinine levels were higher in the non-included participants (all P < 0.05). Regarding nutritional intake, total energy, protein, fat, and carbohydrate intakes were all slightly higher in the non-included participants compared to the included participants (all P < 0.05). The intake of total meat, red and processed meat, white meat, fish, shellfish, and vegetables was slightly higher in the non-included participants, and fruit intake was higher in the included participants (all P < 0.05). All the analyses were adjusted for these factors.
Table 5 shows 69 SNPs with a LD value of < 0.01 among the 11,145 SNPs identified in the GWAS.
SNP, single-nucleotide polymorphism; MA, minor allele; MAF, minor allele frequency; LIX1L, limb and CNS expressed 1 like; GBAP1, glucosylceramidase beta 1; GCKR, glucokinase regulator; LRP2, LDL receptor related protein 2; ITIH4, inter-alpha-trypsin inhibitor heavy chain 4; SLC2A9, solute carrier family 2 member 9; WDR1, WD repeat domain 1; CLNK, cytokine dependent hematopoietic cell linker; ABCG2, ATP binding cassette subfamily G member 2; CARMIL, capping protein regulator and myosin 1 linker; SLC17A1, solute carrier family 17 member 1; LINC00240, long intergenic non-protein coding RNA 240; ZNRD1ASP, POLR1H antisense, pseudogene; TRIM39, tripartite motif containing 39; MICA-AS1, MICA antisense RNA 1; POLR1C, RNA Polymerase I And III Subunit C; HCRTR2, hypocretin receptor 2; TBL2, transducin (beta)-like 2; HNF4G, hepatocyte nuclear factor 4 gamma; A1CF, APOBEC1 complementation factor; BICC1, BicC family RNA binding protein 1; SLC22A10, solute carrier family 22 member 10; MACROD1, mono-ADP Ribosylhydrolase 1; SLC22A12, solute carrier family 22 member 12; PACS1, phosphofurin acidic cluster sorting protein 1; C11orf80, chromosome 11 open reading frame 80; ENPP7P7, ectonucleotide pyrophosphatase/phosphodiesterase 7 pseudogene 7; CPT1A, carnitine palmitoyltransferase 1A; HNF1A, hepatocyte nuclear factor 1 alpha; UBE2Q2, ubiquitin conjugating enzyme E2 Q2; IGF1R, insulin-like growth factor-1 receptor; MAFTRR, MAF transcriptional regulator RNA; HLF, hepatic leukemia factor; BCAS3, breast carcinoma-amplified sequence 3; MFSD12, major facilitator superfamily domain containing 12.
The incidence of hyperuricemia according to the consumption of red and processed meat is shown in Table 6. In both men and women, there was no statistically significant difference in the incidence of hyperuricemia between the red and processed meat consumption tertiles.
Adjusted for age, education, income, alcohol consumption, regular exercise, BMI, smoking, total energy, protein intake, white meat intake, fish intake, shellfish intake, fruit intake, vegetable intake, legume intake, hypertension, diabetes mellitus, and hyperlipidemia.
HR, hazard ratio; CI, confidence interval; BMI, body mass index.
Table 7 shows the hyperuricemia incidence based on the tertiles of the PRS. In men, the mid- and high-PRS groups showed a higher incidence of hyperuricemia. In the multivariable Cox proportional hazards model, men with mid- and high-PRS exhibited a 1.53- and 2.46-fold higher incidence of hyperuricemia, respectively, when adjusted for confounders, compared with men with low PRS (HR, 1.53; 95% CI, 1.32–1.78 and HR, 2.46; 95% CI, 2.14–2.82, respectively). Similarly, women with mid- and high-PRS exhibited a higher incidence of hyperuricemia. Furthermore, the incidence of hyperuricemia in the adjusted model was 1.79- and 3.24-fold higher in women with mid- and high-PRS when compared with women with low-PRS (HR, 1.79; 95% CI, 1.50–2.14 and HR, 3.24; 95% CI, 2.75–3.81, respectively).
Adjusted for age, education, income, alcohol consumption, regular exercise, BMI, smoking, total energy, protein intake, white meat intake, fish intake, shellfish intake, fruit intake, vegetable intake, legume intake, hypertension, diabetes mellitus, and hyperlipidemia.
PRS, polygenic risk score; HR, hazard ratio; CI, confidence interval; BMI, body mass index.
Table 8 shows the relationship between the combination of red and processed meat intake, PRS, and the incidence of hyperuricemia. In both men and women, the incidence of hyperuricemia varied depending on the combination of red and processed meat intake and PRS. In particular, the higher the PRS, the higher the incidence of hyperuricemia, even within the same red and processed meat intake tertiles.
Adjusted for age, education, income, alcohol consumption, regular exercise, BMI, smoking, total energy, protein intake, white meat intake, fish intake, shellfish intake, fruit intake, vegetable intake, legume intake, hypertension, diabetes mellitus, and hyperlipidemia. P-values for linear trends were calculated by treating the median value of each tertile as a continuous variable.
PRS, polygenic risk score; HR, hazard ratio; CI, confidence interval; BMI, body mass index.
For men, compared with the low-PRS group and tertile 1 of red and processed meat intake, the groups with mid- and high-PRS and in the tertile 1 of red and processed meat intake exhibited a 1.44- and 2.24-fold increase in the incidence of hyperuricemia, respectively (HR, 1.44; 95% CI, 1.11–1.88; HR, 2.24; 95% CI, 1.76–2.87, respectively, P for trend < 0.0001). Furthermore, men with mid- and high-PRS and in the tertile 2 of red and processed meat intake had a 1.60- and 2.40-fold higher risk of hyperuricemia, respectively, than those with a low-PRS and in tertile 1 of red and processed meat intake (HR, 1.60; 95% CI, 1.23–2.08; HR, 2.40; 95% CI, 1.89–3.06, respectively, P for trend < 0.0001). The same trend was observed among those who consumed the most red and processed meat. Men in the tertile 3 of red and processed meat intake and with mid- and high-PRS had a linearly increased risk of 1.55- and 2.72-fold, respectively, compared to those with a low-PRS and in tertile 1 of red and processed meat intake (HR, 1.55; 95% CI, 1.18–2.04; HR, 2.72; 95% CI, 2.10–3.53, respectively, P for trend < 0.0001). However, no interaction was observed between red and processed meat intake and PRS in the development of hyperuricemia in men.
For women, compared with the low-PRS group and tertile 1 of red and processed meat intake, the groups with mid- and high-PRS and in the tertile 1 of red and processed meat intake exhibited a 1.80- and 3.24-fold increase in hyperuricemia incidence, respectively (HR, 1.80; 95% CI, 1.34–2.41; HR, 3.24; 95% CI, 2.47–4.26, respectively, P for trend < 0.0001). Furthermore, women with mid- and high-PRS and in tertile 2 of red and processed meat intake had a 1.98- and 3.40-fold higher risk of hyperuricemia than those with a low-PRS and tertile 1 of red and processed meat intake (HR, 1.98; 95% CI, 1.47–2.66; HR, 3.40; 95% CI, 2.58–4.48, respectively, P for trend < 0.0001). The same trend was observed among those who consumed the most red and processed meat. Women in the tertile 3 of red and processed meat intake and with mid- and high-PRS had a linearly increased risk of 1.72- and 3.28-fold, respectively, compared to those with a low-PRS and in tertile 1 of red and processed meat intake (HR, 1.72; 95% CI, 1.24–2.37; HR, 3.28; 95% CI, 2.45–4.40, respectively, P for trend < 0.0001). However, even in women, there was no interaction between red and processed meat consumption and the PRS in the development of hyperuricemia.
We further investigated how the combination of the PRS and total meat intake, including red, processed, and white meat, affected hyperuricemia incidence (Supplementary Tables 3 and 4). Men who consumed the highest amount of total meat had a significantly higher incidence of hyperuricemia than those who consumed the lowest amount of total meat (P < 0.05). However, the combination of total meat and PRS showed a trend similar to that of the combination of red and processed meat consumption and PRS for both men and women.
This study explored the effects of different combinations of individual polygenic influences and red and processed meat consumption on hyperuricemia in middle-aged Korean adults. In this study, the link between the PRS and the consumption of red and processed meat in the association with hyperuricemia development was verified using data from the KoGES HEXA. In both men and women, the PRS was positively correlated with the development of hyperuricemia, and the incidence of hyperuricemia increased with an increasing PRS, even within the same red and processed meat intake tertiles. Men and women with a high PRS and high red and processed meat intake had 2.72- and 3.28-times higher incidences of hyperuricemia, respectively, than those with a low PRS and low red and processed meat intake.
Uric acid metabolism is a complex process that includes a variety of factors that control its production by the liver, as well as its excretion by the kidneys and intestines. Uric acid is the final product of exogenous and endogenous purine metabolism, which substantially varies depending on the diet. Animal proteins have a noticeable effect on the purine pool [60]. Increased reabsorption or decreased secretion of uric acid in the proximal tubules decreases the rate of uric acid excretion. Multiple proteins involved in uric acid transport play an important role in the treatment of hyperuricemia [61].
Hyperuricemia is thought to be caused by a combination of environmental and genetic factors [62]. We identified 69 SNPs in uric acid-related loci using GWAS and clumping analysis, of which the most prominent were SLC2A9, ABCG2, WD repeat domain 1 (WDR1), cytokine dependent hematopoietic cell linker (CLNK), and mono-ADP Ribosylhydrolase 1 (MACROD1). The influence of genes on the development of complex diseases such as hyperuricemia is widely known. Among the genetic variants associated with uric acid levels selected for our study, the SLC2A9 expression was the most prominent and has been associated with hyperuricemia and gout. SLC2A9, previously discovered as a glucose transporter, was later identified as a major uric acid transporter and this function has been revealed in human genetic studies [6364]. In a previous GWAS, SLC2A9 emerged as the main gene associated with uric acid levels in human cohorts, and the minor allele of SLC2A9 reduced uric acid levels by 0.30–0.35 mg/dL on average [65]. Previous studies examining the molecular mechanisms of renal uric acid transport in humans and rodents have shown that SLC2A9 contributes significantly to urate uptake in the proximal tubule [66]. Other GWAS and candidate gene association studies have also discovered a powerful relationship between SLC2A9 SNPs and serum uric acid levels [656768697071]. Among the SLC2A9 SNPs in our study, rs_6855911 and rs_3775948 have been previously shown to be associated with hyperuricemia and uric acid levels [7273747576]. ABCG2 has also been associated with hyperuricemia in many studies [67777879]. ABCG2, a multifunctional heterotrimeric endogenous transporter protein, is primarily expressed in the kidney, liver, and gastrointestinal tract and plays a substantial role in removing uric acid from the circulation [77]. Variations in ABCG2 may cause the destabilization of its nucleotide-binding structural domain, which may result in reduced expression and dysfunction, leading to inadequate renal urate excretion [78]. Several GWASs have reported the major influence of ABCG2 on hyperuricemia and gout. rs_45499402 and rs_72552713 in ABCG2 notably increased the risk of gout in Asians [7980], and these SNPs were also identified in our study. Additionally, many genes, including glucosylceramidase beta 1 (GBAP1) [81], glucokinase regulator (GCKR) [268283848586], low-density lipoprotein receptor related protein 2 (LRP2) [273087888990], WDR1 [919293], CLNK [9495], solute carrier family 17 member 1 (SLC17A1) [96979899], hypocretin receptor 2 (HCRTR2) [77100], hepatocyte nuclear factor 4 gamma (HNF4G) [77101102103], APOBEC1 complementation factor (A1CF) [26104], BicC family RNA binding protein 1 (BICC1) [105], solute carrier 22 family member 10 (SLC22A10) [106107], solute carrier family 22 member 12 (SLC22A12) [2377108109], phosphofurin acidic cluster sorting protein 1 (PACS1) [110], carnitine palmitoyltransferase 1A (CPT1A) [111112], hepatocyte nuclear factor 1 alpha (HNF1A) [113], ubiquitin conjugating enzyme E2 Q2 (UBE2Q2) [114115], insulin-like growth factor-1 receptor (IGF1R) [100116], MAF transcriptional regulator RNA (MAFTRR) [77100117], hepatic leukemia factor (HLF) [118119], breast carcinoma-amplified sequence 3 (BCAS3) [120121], and major facilitator superfamily domain containing 12 (MFSD12) [100], identified in our study, have previously been reported to contribute to the regulation of uric acid levels and have been related to gout or hyperuricemia in several populations. To the best of our knowledge, the association of limb and CNS expressed 1 like (LIX1L), inter-alpha-trypsin inhibitor heavy chain 4 (ITIH4), LOC105379030, capping protein regulator and myosin 1 linker 7 (CARMIL7), long intergenic non-protein coding RNA 240 (LINC00240), POLR1H antisense, pseudogene (ZNRD1ASP), tripartite motif containing 39 (TRIM39), MICA antisense RNA 1 (MICA-AS1), RNA Polymerase I And III Subunit C (POLR1C), transducin (beta)-like 2 (TBL2), chromosome 11 open reading frame 80 (C11orf80), ectonucleotide pyrophosphatase/phosphodiesterase 7 pseudogene 7 (ENPP7P7), and MACROD1 with uric acid levels has been identified for the first time in this study.
This study calculated the weighted PRS from the uric acid level-related SNPs selected by GWAS and clumping analysis. Individuals in the high-PRS group had a roughly two- to three-fold elevated risk of hyperuricemia compared to those in the low-PRS group. Recently, PRS, which aggregates multiple risk alleles, has been used to quantitatively measure genetic susceptibility to several polygenic diseases, including dementia, CVD, diabetes, breast cancer, and colorectal cancer [122123124125126127]. Similar to our study, a recent study on hyperuricemia and PRS showed that a lower PRS was associated with a significantly lower risk of hyperuricemia, with participants at low genetic risk having a 0.60-fold reduced risk of hyperuricemia compared with those at high genetic risk [128]. Our findings showed that women in the high PRS group had a higher risk of hyperuricemia than men. This may be due to differences in the estrogen levels between the sexes, as the BCAS3 gene included in PRS can activate estrogen receptor alpha [121]. Postmenopausal women may have increased uric acid levels owing to decreases in estradiol levels, as estrogen stimulates the kidneys to remove urate [129]. However, because our dataset did not include information on the hormonal changes in the participants, further research is needed to resolve and minimize this potential bias that may contribute to the observed differences between women and men.
Previous studies have demonstrated a link between the intake of red and processed meat and the risk of hyperuricemia. As mentioned earlier, in the results of NHANES III which evaluated the association between dietary factors and serum uric acid levels in American adults, the uric acid levels were observed to increase concomitantly with increased total meat intake in both men and women [18]. In a cross-sectional study of older Chinese women, meat intake was related to an increased prevalence of hyperuricemia [130]. In a meta-analysis of observational studies, the risk of hyperuricemia was positively associated with red meat intake [131]. Individuals with dietary patterns involving the consumption of large amounts of processed meat are at a higher risk of increased serum uric acid [132133134], and higher scores for diets high in animal organs and processed meat are related to a higher prevalence of newly diagnosed hyperuricemia [135]. Although this study did not show a connection between hyperuricemia and the intake of red and processed meat, there were differences in the effects of different combinations of red and processed meat consumption and PRS on hyperuricemia development. Although there was no clear interaction between PRS and red and processed meat intake in the incidence of hyperuricemia in our study, a higher incidence of hyperuricemia was found when red and processed meat intakes were combined with high PRS than when PRS was applied alone as an independent variable. Moreover, our results showed that the risk of developing hyperuricemia significantly increased with increasing PRS, even when the intake of red and processed meat was the same. This suggests that red and processed meat intake should be modified according to an individual’s PRS to prevent the development of hyperuricemia and may serve as a basis for a tailored dietary control approach for the prevention of the disease. Genetic variation does not occur due to a single genetic variant, but rather due to the accumulation of risk alleles from multiple loci that exert their effect on the relevant trait. Recent studies have identified a link between genetic risk, lifestyle, dietary patterns, and uric acid levels. In a population-based cohort study, an individuals’ low genetic risk and adherence to a healthy lifestyle significantly reduced their risk of hyperuricemia [128]. In a cohort study of women, a strong connection between diet and gout risk was observed in women with a higher genetic risk [136]. Data on the effectiveness of specific diets in the management of hyperuricemia and gout are limited. Future studies examining the role of gene-diet interactions and patient counseling on the role of a healthy diet in optimally controlling hyperuricemia, gout, and other comorbidities should also be conducted [137].
This study yielded meaningful results and had several strengths. First, this was the first study to confirm the relationship between the PRS and consumption of red and processed meat and hyperuricemia in the Korean population. Second, as we adjusted for multiple confounding variables in the analysis, we identified an independent association of the PRS and the intake of red and processed meat with hyperuricemia. Despite these strengths, this study had several limitations. First, as this was a prospective cohort study, it was not possible to investigate the mechanisms by which the relationship between red and processed meat intake and PRS affects hyperuricemia. Second, as we only used baseline dietary survey data, the diet may have changed during the follow-up period. Third, because this study targeted middle-aged Koreans, the generalizability of the findings to other age groups or races/ethnicities may be limited.
This prospective cohort study in Korean adults showed no clear interaction between red and processed meats in the development of hyperuricemia. However, the risk of hyperuricemia was linearly amplified in individuals with a high genetic risk of high uric acid levels despite the consumption of the same amounts of red and processed meat as those with a low genetic risk. In particular, the risk of hyperuricemia is higher when genetic risk is combined with a high intake of red and processed meats than genetic risk alone. Our results illustrate the important synergy between the combination of genetic predisposition and specific dietary factors, suggesting that controlling red and processed meat intake is important for preventing hyperuricemia, especially in individuals with a higher genetic risk.
ACKNOWLEDGMENTS
This study was conducted using bioresources from the National Biobank of Korea, the Korea Disease Control and Prevention Agency (KDCA), Republic of Korea (KBN-2020-016).
References
1. Neogi T. Clinical practice. Gout. N Engl J Med. 2011; 364:443–452. PMID: 21288096.
2. Li L, Yang C, Zhao Y, Zeng X, Liu F, Fu P. Is hyperuricemia an independent risk factor for new-onset chronic kidney disease?: a systematic review and meta-analysis based on observational cohort studies. BMC Nephrol. 2014; 15:122. PMID: 25064611.
3. Kuwabara M, Niwa K, Nishi Y, Mizuno A, Asano T, Masuda K, Komatsu I, Yamazoe M, Takahashi O, Hisatome I. Relationship between serum uric acid levels and hypertension among Japanese individuals not treated for hyperuricemia and hypertension. Hypertens Res. 2014; 37:785–789. PMID: 24671018.
4. Dehghan A, van Hoek M, Sijbrands EJ, Hofman A, Witteman JC. High serum uric acid as a novel risk factor for type 2 diabetes. Diabetes Care. 2008; 31:361–362. PMID: 17977935.
5. Zheng L, Zhu Y, Ma Y, Zhang H, Zhao H, Zhang Y, Yang Z, Liu Y. Relationship between hyperuricemia and the risk of cardiovascular events and chronic kidney disease in both the general population and hypertensive patients: a systematic review and meta-analysis. Int J Cardiol. 2024; 399:131779. PMID: 38218247.
6. Chen JH, Chuang SY, Chen HJ, Yeh WT, Pan WH. Serum uric acid level as an independent risk factor for all-cause, cardiovascular, and ischemic stroke mortality: a Chinese cohort study. Arthritis Rheum. 2009; 61:225–232. PMID: 19177541.
7. Trifirò G, Morabito P, Cavagna L, Ferrajolo C, Pecchioli S, Simonetti M, Bianchini E, Medea G, Cricelli C, Caputi AP, et al. Epidemiology of gout and hyperuricaemia in Italy during the years 2005-2009: a nationwide population-based study. Ann Rheum Dis. 2013; 72:694–700. PMID: 22736095.
8. Zhu Y, Pandya BJ, Choi HK. Prevalence of gout and hyperuricemia in the US general population: the National Health and Nutrition Examination Survey 2007-2008. Arthritis Rheum. 2011; 63:3136–3141. PMID: 21800283.
9. Esche J, Krupp D, Mensink GB, Remer T. Dietary potential renal acid load is positively associated with serum uric acid and odds of hyperuricemia in the German adult population. J Nutr. 2018; 148:49–55. PMID: 29378039.
10. Singh G, Lingala B, Mithal A. Gout and hyperuricaemia in the USA: prevalence and trends. Rheumatology (Oxford). 2019; 58:2177–2180. PMID: 31168609.
11. Ting K, Gill TK, Keen H, Tucker GR, Hill CL. Prevalence and associations of gout and hyperuricaemia: results from an Australian population-based study. Intern Med J. 2016; 46:566–573. PMID: 26765205.
12. Zhang M, Zhu X, Wu J, Huang Z, Zhao Z, Zhang X, Xue Y, Wan W, Li C, Zhang W, et al. Prevalence of hyperuricemia among Chinese adults: findings from two nationally representative cross-sectional surveys in 2015–16 and 2018–19. Front Immunol. 2022; 12:791983. PMID: 35197964.
13. Jeong H, Chang YS, Jeon CH. Association between hyperuricemia and hearing impairment: results from the Korean National Health and Nutrition Examination Survey. Medicina (Kaunas). 2023; 59:1273. PMID: 37512084.
14. Lee CH, Sung NY. The prevalence and features of Korean gout patients using the National Health Insurance Corporation database. J Rheum Dis. 2011; 18:94–100.
15. Kim JW, Kwak SG, Lee H, Kim SK, Choe JY, Park SH. Prevalence and incidence of gout in Korea: data from the national health claims database 2007-2015. Rheumatol Int. 2017; 37:1499–1506. PMID: 28676911.
16. Williams PT. Effects of diet, physical activity and performance, and body weight on incident gout in ostensibly healthy, vigorously active men. Am J Clin Nutr. 2008; 87:1480–1487. PMID: 18469274.
17. Kaneko K, Aoyagi Y, Fukuuchi T, Inazawa K, Yamaoka N. Total purine and purine base content of common foodstuffs for facilitating nutritional therapy for gout and hyperuricemia. Biol Pharm Bull. 2014; 37:709–721. PMID: 24553148.
18. Choi HK, Liu S, Curhan G. Intake of purine-rich foods, protein, and dairy products and relationship to serum levels of uric acid: the Third National Health and Nutrition Examination Survey. Arthritis Rheum. 2005; 52:283–289. PMID: 15641075.
19. Emmerson BT. The management of gout. N Engl J Med. 1996; 334:445–451. PMID: 8552148.
20. Schmidt JA, Crowe FL, Appleby PN, Key TJ, Travis RC. Serum uric acid concentrations in meat eaters, fish eaters, vegetarians and vegans: a cross-sectional analysis in the EPIC-Oxford cohort. PLoS One. 2013; 8:e56339. PMID: 23418557.
21. Miao Z, Li C, Chen Y, Zhao S, Wang Y, Wang Z, Chen X, Xu F, Wang F, Sun R, et al. Dietary and lifestyle changes associated with high prevalence of hyperuricemia and gout in the Shandong coastal cities of Eastern China. J Rheumatol. 2008; 35:1859–1864. PMID: 18634142.
22. Cho SK, Kim S, Chung JY, Jee SH. Discovery of URAT1 SNPs and association between serum uric acid levels and URAT1. BMJ Open. 2015; 5:e009360.
23. Jang WC, Nam YH, Park SM, Ahn YC, Park SH, Choe JY, Shin IH, Kim SK. T6092C polymorphism of SLC22A12 gene is associated with serum uric acid concentrations in Korean male subjects. Clin Chim Acta. 2008; 398:140–144. PMID: 18824160.
24. Kolz M, Johnson T, Sanna S, Teumer A, Vitart V, Perola M, Mangino M, Albrecht E, Wallace C, Farrall M, et al. Meta-analysis of 28,141 individuals identifies common variants within five new loci that influence uric acid concentrations. PLoS Genet. 2009; 5:e1000504. PMID: 19503597.
25. Woodward OM, Köttgen A, Coresh J, Boerwinkle E, Guggino WB, Köttgen M. Identification of a urate transporter, ABCG2, with a common functional polymorphism causing gout. Proc Natl Acad Sci U S A. 2009; 106:10338–10342. PMID: 19506252.
26. Köttgen A, Albrecht E, Teumer A, Vitart V, Krumsiek J, Hundertmark C, Pistis G, Ruggiero D, O’Seaghdha CM, Haller T, et al. Genome-wide association analyses identify 18 new loci associated with serum urate concentrations. Nat Genet. 2013; 45:145–154. PMID: 23263486.
27. Tin A, Marten J, Halperin Kuhns VL, Li Y, Wuttke M, Kirsten H, Sieber KB, Qiu C, Gorski M, Yu Z, et al. Target genes, variants, tissues and transcriptional pathways influencing human serum urate levels. Nat Genet. 2019; 51:1459–1474. PMID: 31578528.
28. Martin AR, Kanai M, Kamatani Y, Okada Y, Neale BM, Daly MJ. Clinical use of current polygenic risk scores may exacerbate health disparities. Nat Genet. 2019; 51:584–591. PMID: 30926966.
29. Lambert SA, Abraham G, Inouye M. Towards clinical utility of polygenic risk scores. Hum Mol Genet. 2019; 28:R133–R142. PMID: 31363735.
30. Nakatochi M, Kanai M, Nakayama A, Hishida A, Kawamura Y, Ichihara S, Akiyama M, Ikezaki H, Furusyo N, Shimizu S, et al. Genome-wide meta-analysis identifies multiple novel loci associated with serum uric acid levels in Japanese individuals. Commun Biol. 2019; 2:115. PMID: 30993211.
31. Lewis CM, Vassos E. Polygenic risk scores: from research tools to clinical instruments. Genome Med. 2020; 12:44. PMID: 32423490.
32. Choi SW, Mak TS, O’Reilly PF. Tutorial: a guide to performing polygenic risk score analyses. Nat Protoc. 2020; 15:2759–2772. PMID: 32709988.
33. Khera AV, Chaffin M, Aragam KG, Haas ME, Roselli C, Choi SH, Natarajan P, Lander ES, Lubitz SA, Ellinor PT, et al. Genome-wide polygenic scores for common diseases identify individuals with risk equivalent to monogenic mutations. Nat Genet. 2018; 50:1219–1224. PMID: 30104762.
34. Mavaddat N, Michailidou K, Dennis J, Lush M, Fachal L, Lee A, Tyrer JP, Chen TH, Wang Q, Bolla MK, et al. Polygenic risk scores for prediction of breast cancer and breast cancer subtypes. Am J Hum Genet. 2019; 104:21–34. PMID: 30554720.
35. Wray NR, Ripke S, Mattheisen M, Trzaskowski M, Byrne EM, Abdellaoui A, Adams MJ, Agerbo E, Air TM, Andlauer TMF, et al. Genome-wide association analyses identify 44 risk variants and refine the genetic architecture of major depression. Nat Genet. 2018; 50:668–681. PMID: 29700475.
36. Janssens AC. Validity of polygenic risk scores: are we measuring what we think we are? Hum Mol Genet. 2019; 28:R143–R150. PMID: 31504522.
37. Kim Y, Han BG. KoGES group. Cohort profile: the Korean Genome and Epidemiology Study (KoGES) consortium. Int J Epidemiol. 2017; 46:e20. PMID: 27085081.
38. Ahn Y, Kwon E, Shim JE, Park MK, Joo Y, Kimm K, Park C, Kim DH. Validation and reproducibility of food frequency questionnaire for Korean Genome Epidemiologic Study. Eur J Clin Nutr. 2007; 61:1435–1441. PMID: 17299477.
39. Lee KW, Woo HD, Cho MJ, Park JK, Kim SS. Identification of dietary patterns associated with incidence of hyperglycemia in middle-aged and older Korean adults. Nutrients. 2019; 11:1801. PMID: 31382699.
40. Jeong J, Lim K, Shin S. The association between meat intake and the risk of coronary heart disease in Korean men using the Framingham risk score: a prospective cohort study. Nutr Metab Cardiovasc Dis. 2023; 33:1158–1166. PMID: 36849318.
41. Korea Disease Control and Prevention Agency. Korean Genome and Epidemiology Study. Manual of Korean Genome and Epidemiology Study-Food Frequency Questionnaire [Internet]. Cheongju: Korea Disease Control and Prevention Agency;2019. cited 2024 July 24. Available from: https://nih.go.kr/ko/main/contents.do?menuNo=300583.
42. Shin D, Lee KW. Dietary acid load is positively associated with the incidence of hyperuricemia in middle-aged and older Korean adults: findings from the Korean Genome and epidemiology study. Int J Environ Res Public Health. 2021; 18:10260. PMID: 34639563.
43. Moon S, Kim YJ, Han S, Hwang MY, Shin DM, Park MY, Lu Y, Yoon K, Jang HM, Kim YK, et al. The Korea Biobank Array: design and identification of coding variants associated with blood biochemical traits. Sci Rep. 2019; 9:1382. PMID: 30718733.
44. Ko B, Jin HS.
MACROD2 polymorphisms are associated with hypertension in Korean population. Korean J Clin Lab Sci. 2019; 51:57–63.
45. Park HJ, Kim SS, Jin HS. Genetic polymorphisms of SLC8A1 are associated with hypertension and left ventricular hypertrophy in the Korean population. Korean J Clin Lab Sci. 2019; 51:286–293.
46. Wu Y, Byrne EM, Zheng Z, Kemper KE, Yengo L, Mallett AJ, Yang J, Visscher PM, Wray NR. Genome-wide association study of medication-use and associated disease in the UK Biobank. Nat Commun. 2019; 10:1891. PMID: 31015401.
47. Kim HR, Jin HS, Eom YB. Association between MANBA gene variants and chronic kidney disease in a Korean population. J Clin Med. 2021; 10:2255. PMID: 34070965.
48. Tyrrell J, Wood AR, Ames RM, Yaghootkar H, Beaumont RN, Jones SE, Tuke MA, Ruth KS, Freathy RM, Davey Smith G, et al. Gene-obesogenic environment interactions in the UK Biobank study. Int J Epidemiol. 2017; 46:559–575. PMID: 28073954.
49. Lee WJ, Lim JE, Jung HU, Kang JO, Park T, Won S, Rhee SY, Kim MK, Kim YJ, Oh B. Analysis of the interaction between polygenic risk score and calorie intake in obesity in the Korean population. Lifestyle Genom. 2021; 14:20–29. PMID: 33302275.
50. Lin KC, Lin HY, Chou P. Community based epidemiological study on hyperuricemia and gout in Kin-Hu, Kinmen. J Rheumatol. 2000; 27:1045–1050. PMID: 10782835.
51. Byun SH, Yoo DM, Lee JW, Choi HG. Analyzing the association between hyperuricemia and periodontitis: a cross-sectional study using KoGES HEXA data. Int J Environ Res Public Health. 2020; 17:4777. PMID: 32630802.
52. Becker MA, Schumacher HR Jr, Wortmann RL, MacDonald PA, Eustace D, Palo WA, Streit J, Joseph-Ridge N. Febuxostat compared with allopurinol in patients with hyperuricemia and gout. N Engl J Med. 2005; 353:2450–2461. PMID: 16339094.
53. Nagahama K, Inoue T, Iseki K, Touma T, Kinjo K, Ohya Y, Takishita S. Hyperuricemia as a predictor of hypertension in a screened cohort in Okinawa, Japan. Hypertens Res. 2004; 27:835–841. PMID: 15824465.
54. Lee KW, Shin D. Concurrent presence of high serum uric acid and inflammation is associated with increased incidence of type 2 diabetes mellitus in Korean adult population. Sci Rep. 2022; 12:11000. PMID: 35768559.
55. Fu J, Shin S. The association of dietary patterns with incident chronic kidney disease and kidney function decline among middle-aged Korean adults: a cohort study. Epidemiol Health. 2023; 45:e2023037. PMID: 37311642.
56. Moon ME, Jung DH, Heo SJ, Park B, Lee YJ. Oxidative balance score and new-onset type 2 diabetes mellitus in Korean adults without non-alcoholic fatty liver disease: Korean Genome and Epidemiology Study-Health Examinees (KoGES-HEXA) cohort. Antioxidants. 2024; 13:107. PMID: 38247531.
57. Azadbakht L, Esmaillzadeh A. Red meat intake is associated with metabolic syndrome and the plasma C-reactive protein concentration in women. J Nutr. 2009; 139:335–339. PMID: 19074209.
58. Lee SA, Kwon SO, Song M, Choi JY, Shin A, Shu XO, Zheng W, Lee JK, Kang D. The association of serum high-sensitivity C-reactive protein level with the risk of site-specific cancer mortality: the Health Examinees (HEXA) study cohort. Am J Epidemiol. 2022; 191:2002–2013. PMID: 35916370.
59. Cho GJ, Kim J, Kim JY, Han SW, Lee SB, Oh MJ, Kim SJ, Shin JE. Adverse pregnancy outcomes and maternal chronic diseases in the future: a cross-sectional study using KoGES-HEXA data. J Clin Med. 2022; 11:1457. PMID: 35268548.
60. Maiuolo J, Oppedisano F, Gratteri S, Muscoli C, Mollace V. Regulation of uric acid metabolism and excretion. Int J Cardiol. 2016; 213:8–14. PMID: 26316329.
61. Mandal AK, Mount DB. The molecular physiology of uric acid homeostasis. Annu Rev Physiol. 2015; 77:323–345. PMID: 25422986.
62. Rivera-Paredez B, Macías-Kauffer L, Fernandez-Lopez JC, Villalobos-Comparán M, Martinez-Aguilar MM, de la Cruz-Montoya A, Ramírez-Salazar EG, Villamil-Ramírez H, Quiterio M, Ramírez-Palacios P, et al. Influence of genetic and non-genetic risk factors for serum uric acid levels and hyperuricemia in Mexicans. Nutrients. 2019; 11:1336. PMID: 31207883.
63. Abreu E, Fonseca MJ, Santos AC. Association between hyperuricemia and insulin resistance. Acta Med Port. 2011; 24(Suppl 2):565–574.
64. Rule AD, de Andrade M, Matsumoto M, Mosley TH, Kardia S, Turner ST. Association between SLC2A9 transporter gene variants and uric acid phenotypes in African American and white families. Rheumatology (Oxford). 2011; 50:871–878. PMID: 21186168.
65. Brandstätter A, Kiechl S, Kollerits B, Hunt SC, Heid IM, Coassin S, Willeit J, Adams TD, Illig T, Hopkins PN, et al. Sex-specific association of the putative fructose transporter SLC2A9 variants with uric acid levels is modified by BMI. Diabetes Care. 2008; 31:1662–1667. PMID: 18487473.
66. So A, Thorens B. Uric acid transport and disease. J Clin Invest. 2010; 120:1791–1799. PMID: 20516647.
67. Dehghan A, Köttgen A, Yang Q, Hwang SJ, Kao WL, Rivadeneira F, Boerwinkle E, Levy D, Hofman A, Astor BC, et al. Association of three genetic loci with uric acid concentration and risk of gout: a genome-wide association study. Lancet. 2008; 372:1953–1961. PMID: 18834626.
68. Wallace C, Newhouse SJ, Braund P, Zhang F, Tobin M, Falchi M, Ahmadi K, Dobson RJ, Marçano AC, Hajat C, et al. Genome-wide association study identifies genes for biomarkers of cardiovascular disease: serum urate and dyslipidemia. Am J Hum Genet. 2008; 82:139–149. PMID: 18179892.
69. Vitart V, Rudan I, Hayward C, Gray NK, Floyd J, Palmer CN, Knott SA, Kolcic I, Polasek O, Graessler J, et al. SLC2A9 is a newly identified urate transporter influencing serum urate concentration, urate excretion and gout. Nat Genet. 2008; 40:437–442. PMID: 18327257.
70. Döring A, Gieger C, Mehta D, Gohlke H, Prokisch H, Coassin S, Fischer G, Henke K, Klopp N, Kronenberg F, et al. SLC2A9 influences uric acid concentrations with pronounced sex-specific effects. Nat Genet. 2008; 40:430–436. PMID: 18327256.
71. McArdle PF, Parsa A, Chang YP, Weir MR, O’Connell JR, Mitchell BD, Shuldiner AR. Association of a common nonsynonymous variant in GLUT9 with serum uric acid levels in old order amish. Arthritis Rheum. 2008; 58:2874–2881. PMID: 18759275.
72. Guan M, Zhou D, Ma W, Chen Y, Zhang J, Zou H. Association of an intronic SNP of SLC2A9 gene with serum uric acid levels in the Chinese male Han population by high-resolution melting method. Clin Rheumatol. 2011; 30:29–35. PMID: 20972595.
73. Lyngdoh T, Bochud M, Glaus J, Castelao E, Waeber G, Vollenweider P, Preisig M. Associations of serum uric acid and SLC2A9 variant with depressive and anxiety disorders: a population-based study. PLoS One. 2013; 8:e76336. PMID: 24204615.
74. Sun X, Jiang F, Zhang R, Tang SS, Chen M, Peng DF, Yan J, Wang T, Wang SY, Bao YQ, et al. Serum uric acid levels are associated with polymorphisms in the SLC2A9, SF1, and GCKR genes in a Chinese population. Acta Pharmacol Sin. 2014; 35:1421–1427. PMID: 25283508.
75. Hu X, Rong S, Wang Q, Sun T, Bao W, Chen L, Liu L. Association between plasma uric acid and insulin resistance in type 2 diabetes: a Mendelian randomization analysis. Diabetes Res Clin Pract. 2021; 171:108542. PMID: 33227361.
76. Sun X, Zhang R, Jiang F, Tang S, Chen M, Peng D, Yan J, Wang T, Wang S, Bao Y, et al. Common variants related to serum uric acid concentrations are associated with glucose metabolism and insulin secretion in a Chinese population. PLoS One. 2015; 10:e0116714. PMID: 25617895.
77. Zhao J, Guo S, Schrodi SJ, He D. Trends in the contribution of genetic susceptibility loci to hyperuricemia and gout and associated novel mechanisms. Front Cell Dev Biol. 2022; 10:937855. PMID: 35813212.
78. Wong K, Briddon SJ, Holliday ND, Kerr ID. Plasma membrane dynamics and tetrameric organisation of ABCG2 transporters in mammalian cells revealed by single particle imaging techniques. Biochim Biophys Acta. 2016; 1863:19–29. PMID: 26453803.
79. Li R, Miao L, Qin L, Xiang Y, Zhang X, Peng H, Mailamuguli , Sun Y, Yao H. A meta-analysis of the associations between the Q141K and Q126X ABCG2 gene variants and gout risk. Int J Clin Exp Pathol. 2015; 8:9812–9823. PMID: 26617691.
80. Yu KH, Chang PY, Chang SC, Wu-Chou YH, Wu LA, Chen DP, Lo FS, Lu JJ. A comprehensive analysis of the association of common variants of ABCG2 with gout. Sci Rep. 2017; 7:9988. PMID: 28855613.
81. Lee S, Yang HK, Lee HJ, Park DJ, Kong SH, Park SK. Cross-phenotype association analysis of gastric cancer: in-silico functional annotation based on the disease-gene network. Gastric Cancer. 2023; 26:517–527. PMID: 36995485.
82. Wang J, Liu S, Wang B, Miao Z, Han L, Chu N, Zhang K, Meng D, Li C, Ma X. Association between gout and polymorphisms in GCKR in male Han Chinese. Hum Genet. 2012; 131:1261–1265. PMID: 22395765.
83. Urano W, Taniguchi A, Inoue E, Sekita C, Ichikawa N, Koseki Y, Kamatani N, Yamanaka H. Effect of genetic polymorphisms on development of gout. J Rheumatol. 2013; 40:1374–1378. PMID: 23729800.
84. Wang L, Ma Q, Yao H, He LJ, Fang BB, Cai W, Zhang B, Wang ZQ, Su YX, Du GL, et al. Association of GCKR rs780094 polymorphism with circulating lipid levels in type 2 diabetes and hyperuricemia in Uygur Chinese. Int J Clin Exp Pathol. 2018; 11:4684–4694. PMID: 31949869.
85. Ho LJ, Lu CH, Su RY, Lin FH, Su SC, Kuo FC, Chu NF, Hung YJ, Liu JS, Hsieh CH. Association between glucokinase regulator gene polymorphisms and serum uric acid levels in Taiwanese adolescents. Sci Rep. 2022; 12:5519. PMID: 35365700.
86. Rasheed H, Stamp LK, Dalbeth N, Merriman TR. Interaction of the GCKR and A1CF loci with alcohol consumption to influence the risk of gout. Arthritis Res Ther. 2017; 19:161. PMID: 28679452.
87. Christensen EI, Birn H. Megalin and cubilin: multifunctional endocytic receptors. Nat Rev Mol Cell Biol. 2002; 3:256–266. PMID: 11994745.
88. Kamatani Y, Matsuda K, Okada Y, Kubo M, Hosono N, Daigo Y, Nakamura Y, Kamatani N. Genome-wide association study of hematological and biochemical traits in a Japanese population. Nat Genet. 2010; 42:210–215. PMID: 20139978.
89. Kanai M, Akiyama M, Takahashi A, Matoba N, Momozawa Y, Ikeda M, Iwata N, Ikegawa S, Hirata M, Matsuda K, et al. Genetic analysis of quantitative traits in the Japanese population links cell types to complex human diseases. Nat Genet. 2018; 50:390–400. PMID: 29403010.
90. Rasheed H, Phipps-Green A, Topless R, Hollis-Moffatt JE, Hindmarsh JH, Franklin C, Dalbeth N, Jones PB, White DH, Stamp LK, et al. Association of the lipoprotein receptor-related protein 2 gene with gout and non-additive interaction with alcohol consumption. Arthritis Res Ther. 2013; 15:R177. PMID: 24286387.
91. Lan B, Chen P, Jiri M, He N, Feng T, Liu K, Jin T, Kang L.
WDR1 and CLNK gene polymorphisms correlate with serum glucose and high-density lipoprotein levels in Tibetan gout patients. Rheumatol Int. 2016; 36:405–412. PMID: 26438387.
92. Cervero P, Himmel M, Krüger M, Linder S. Proteomic analysis of podosome fractions from macrophages reveals similarities to spreading initiation centres. Eur J Cell Biol. 2012; 91:908–922. PMID: 22721921.
93. Kile BT, Panopoulos AD, Stirzaker RA, Hacking DF, Tahtamouni LH, Willson TA, Mielke LA, Henley KJ, Zhang JG, Wicks IP, et al. Mutations in the cofilin partner Aip1/Wdr1 cause autoinflammatory disease and macrothrombocytopenia. Blood. 2007; 110:2371–2380. PMID: 17515402.
94. Wu JN, Koretzky GA. The SLP-76 family of adapter proteins. Semin Immunol. 2004; 16:379–393. PMID: 15541653.
95. Yu J, Riou C, Davidson D, Minhas R, Robson JD, Julius M, Arnold R, Kiefer F, Veillette A. Synergistic regulation of immunoreceptor signaling by SLP-76-related adaptor Clnk and serine/threonine protein kinase HPK-1. Mol Cell Biol. 2001; 21:6102–6112. PMID: 11509653.
96. Yang Q, Köttgen A, Dehghan A, Smith AV, Glazer NL, Chen MH, Chasman DI, Aspelund T, Eiriksdottir G, Harris TB, et al. Multiple genetic loci influence serum urate levels and their relationship with gout and cardiovascular disease risk factors. Circ Cardiovasc Genet. 2010; 3:523–530. PMID: 20884846.
97. Hong M, Park JW, Yang PS, Hwang I, Kim TH, Yu HT, Uhm JS, Joung B, Lee MH, Jee SH, et al. A Mendelian randomization analysis: the causal association between serum uric acid and atrial fibrillation. Eur J Clin Invest. 2020; 50:e13300. PMID: 32474920.
98. Chiba T, Matsuo H, Kawamura Y, Nagamori S, Nishiyama T, Wei L, Nakayama A, Nakamura T, Sakiyama M, Takada T, et al. NPT1/SLC17A1 is a renal urate exporter in humans and its common gain-of-function variant decreases the risk of renal underexcretion gout. Arthritis Rheumatol. 2015; 67:281–287. PMID: 25252215.
99. Torres RJ, de Miguel E, Bailén R, Banegas JR, Puig JG. Tubular urate transporter gene polymorphisms differentiate patients with gout who have normal and decreased urinary uric acid excretion. J Rheumatol. 2014; 41:1863–1870. PMID: 25128519.
100. Park JS, Kim Y, Kang J. Genome-wide meta-analysis revealed several genetic loci associated with serum uric acid levels in Korean population: an analysis of Korea Biobank data. J Hum Genet. 2022; 67:231–237. PMID: 34719683.
101. Dong Z, Zhou J, Jiang S, Li Y, Zhao D, Yang C, Ma Y, Wang Y, He H, Ji H, et al. Effects of multiple genetic loci on the pathogenesis from serum urate to gout. Sci Rep. 2017; 7:43614. PMID: 28252667.
102. Chen BD, Chen XC, Pan S, Yang YN, He CH, Liu F, Ma X, Gai MT, Ma YT. TT genotype of rs2941484 in the human HNF4G gene is associated with hyperuricemia in Chinese Han men. Oncotarget. 2017; 8:26918–26926. PMID: 28460474.
103. Wisely GB, Miller AB, Davis RG, Thornquest AD Jr, Johnson R, Spitzer T, Sefler A, Shearer B, Moore JT, Miller AB, et al. Hepatocyte nuclear factor 4 is a transcription factor that constitutively binds fatty acids. Structure. 2002; 10:1225–1234. PMID: 12220494.
104. Kawaguchi M, Nakayama A, Aoyagi Y, Nakamura T, Shimizu S, Kawamura Y, Takao M, Tamura T, Hishida A, Nagayoshi M, et al. Both variants of A1CF and BAZ1B genes are associated with gout susceptibility: a replication study and meta-analysis in a Japanese population. Hum Cell. 2021; 34:293–299. PMID: 33517564.
105. Leask MP, Merriman TR. The genetic basis of urate control and gout: insights into molecular pathogenesis from follow-up study of genome-wide association study loci. Best Pract Res Clin Rheumatol. 2021; 35:101721. PMID: 34732286.
106. Gottier Nwafor J, Nowik M, Anzai N, Endou H, Wagner CA. Metabolic acidosis alters expression of Slc22 transporters in mouse kidney. Kidney Blood Press Res. 2020; 45:263–274. PMID: 32062662.
107. Jamshidi N, Nigam KB, Nigam SK. Loss of the kidney urate transporter, Urat1, leads to disrupted redox homeostasis in mice. Antioxidants. 2023; 12:780. PMID: 36979028.
108. Sugihara S, Hisatome I, Kuwabara M, Niwa K, Maharani N, Kato M, Ogino K, Hamada T, Ninomiya H, Higashi Y, et al. Depletion of uric acid due to SLC22A12 (URAT1) loss-of-function mutation causes endothelial dysfunction in hypouricemia. Circ J. 2015; 79:1125–1132. PMID: 25739858.
109. Shima Y, Teruya K, Ohta H. Association between intronic SNP in urate-anion exchanger gene, SLC22A12, and serum uric acid levels in Japanese. Life Sci. 2006; 79:2234–2237. PMID: 16920156.
110. Matsuo H, Yamamoto K, Nakaoka H, Nakayama A, Sakiyama M, Chiba T, Takahashi A, Nakamura T, Nakashima H, Takada Y, et al. Genome-wide association study of clinically defined gout identifies multiple risk loci and its association with clinical subtypes. Ann Rheum Dis. 2016; 75:652–659. PMID: 25646370.
111. Yang Y, Lin C, Zheng Q, Zhang L, Li Y, Huang Q, Wu T, Zhao Z, Li L, Luo J, et al. L-carnitine attenuated hyperuricemia-associated left ventricular remodeling through ameliorating cardiomyocytic lipid deposition. Front Pharmacol. 2023; 14:1016633. PMID: 36817129.
112. Cuevas-Delgado P, Miguel V, Rupérez FJ, Lamas S, Barbas C. Impact of renal tubular Cpt1a overexpression on the kidney metabolome in the folic acid-induced fibrosis mouse model. Front Mol Biosci. 2023; 10:1161036. PMID: 37377862.
113. Estiverne C, Mandal AK, Mount DB. Molecular pathophysiology of uric acid homeostasis. Semin Nephrol. 2020; 40:535–549. PMID: 33678309.
114. Narang RK, Vincent Z, Phipps-Green A, Stamp LK, Merriman TR, Dalbeth N. Population-specific factors associated with fractional excretion of uric acid. Arthritis Res Ther. 2019; 21:234. PMID: 31718705.
115. Merriman TR. An update on the genetic architecture of hyperuricemia and gout. Arthritis Res Ther. 2015; 17:98. PMID: 25889045.
116. Ames BN, Cathcart R, Schwiers E, Hochstein P. Uric acid provides an antioxidant defense in humans against oxidant- and radical-caused aging and cancer: a hypothesis. Proc Natl Acad Sci U S A. 1981; 78:6858–6862. PMID: 6947260.
117. Leask M, Dowdle A, Salvesen H, Topless R, Fadason T, Wei W, Schierding W, Marsman J, Antony J, O’Sullivan JM, et al. Functional urate-associated genetic variants influence expression of lincRNAs LINC01229 and MAFTRR
. Front Genet. 2019; 9:733. PMID: 30719032.
118. Merriman T, Phipps-Green A, Topless R, Merriman M, Franklin C, Jones G, van Rij A, Montgomery G, Chapman B, White D, et al. Association analysis of 18 recently discovered serum urate loci with gout. Ann Rheum Dis. 2014; 73:353.
119. Phipps-Green AJ, Merriman ME, Topless R, Altaf S, Montgomery GW, Franklin C, Jones GT, van Rij AM, White D, Stamp LK, et al. Twenty-eight loci that influence serum urate levels: analysis of association with gout. Ann Rheum Dis. 2016; 75:124–130. PMID: 25187157.
120. Li C, Li Z, Liu S, Wang C, Han L, Cui L, Zhou J, Zou H, Liu Z, Chen J, et al. Genome-wide association analysis identifies three new risk loci for gout arthritis in Han Chinese. Nat Commun. 2015; 6:7041. PMID: 25967671.
121. Sakiyama M, Matsuo H, Nakaoka H, Kawamura Y, Kawaguchi M, Higashino T, Nakayama A, Akashi A, Ueyama J, Kondo T, et al. Common variant of BCAS3 is associated with gout risk in Japanese population: the first replication study after gout GWAS in Han Chinese. BMC Med Genet. 2018; 19:96. PMID: 29879923.
122. Lourida I, Hannon E, Littlejohns TJ, Langa KM, Hyppönen E, Kuzma E, Llewellyn DJ. Association of lifestyle and genetic risk with incidence of dementia. JAMA. 2019; 322:430–437. PMID: 31302669.
123. Rutten-Jacobs LC, Larsson SC, Malik R, Rannikmäe K; MEGASTROKE Consortium; International Stroke Genetics Consortium, Sudlow CL, Dichgans M, Markus HS, Traylor M. Genetic risk, incident stroke, and the benefits of adhering to a healthy lifestyle: cohort study of 306 473 UK Biobank participants. BMJ. 2018; 363:k4168. PMID: 30355576.
124. Patel AP, Wang M, Ruan Y, Koyama S, Clarke SL, Yang X, Tcheandjieu C, Agrawal S, Fahed AC, Ellinor PT, et al. A multi-ancestry polygenic risk score improves risk prediction for coronary artery disease. Nat Med. 2023; 29:1793–1803. PMID: 37414900.
125. Said MA, Verweij N, van der Harst P. Associations of combined genetic and lifestyle risks with incident cardiovascular disease and diabetes in the UK Biobank study. JAMA Cardiol. 2018; 3:693–702. PMID: 29955826.
126. Arthur RS, Wang T, Xue X, Kamensky V, Rohan TE. Genetic factors, adherence to healthy lifestyle behavior, and risk of invasive breast cancer among women in the UK Biobank. J Natl Cancer Inst. 2020; 112:893–901. PMID: 31899501.
127. Xin J, Du M, Gu D, Jiang K, Wang M, Jin M, Hu Y, Ben S, Chen S, Shao W, et al. Risk assessment for colorectal cancer via polygenic risk score and lifestyle exposure: a large-scale association study of East Asian and European populations. Genome Med. 2023; 15:4. PMID: 36694225.
128. Zhang T, Gu Y, Meng G, Zhang Q, Liu L, Wu H, Zhang S, Wang X, Zhang J, Sun S, et al. Genetic risk, adherence to a healthy lifestyle, and hyperuricemia: the TCLSIH cohort study. Am J Med. 2023; 136:476–483.e5. PMID: 36708795.
129. Hak AE, Choi HK. Menopause, postmenopausal hormone use and serum uric acid levels in US women--the Third National Health and Nutrition Examination Survey. Arthritis Res Ther. 2008; 10:R116. PMID: 18822120.
130. Xiong Z, Zhu C, Qian X, Zhu J, Wu Z, Chen L. Serum uric acid is associated with dietary and lifestyle factors in elderly women in suburban Guangzhou in Guangdong province of south China. J Nutr Health Aging. 2013; 17:30–34. PMID: 23299375.
131. Li R, Yu K, Li C. Dietary factors and risk of gout and hyperuricemia: a meta-analysis and systematic review. Asia Pac J Clin Nutr. 2018; 27:1344–1356. PMID: 30485934.
132. Zhang T, Gan S, Ye M, Meng G, Zhang Q, Liu L, Wu H, Gu Y, Zhang S, Wang Y, et al. Association between consumption of ultra-processed foods and hyperuricemia: TCLSIH prospective cohort study. Nutr Metab Cardiovasc Dis. 2021; 31:1993–2003. PMID: 34119375.
133. Rai SK, Fung TT, Lu N, Keller SF, Curhan GC, Choi HK. The Dietary Approaches to Stop Hypertension (DASH) diet, Western diet, and risk of gout in men: prospective cohort study. BMJ. 2017; 357:j1794. PMID: 28487277.
134. Zhang M, Chang H, Gao Y, Wang X, Xu W, Liu D, Li G, Huang G. Major dietary patterns and risk of asymptomatic hyperuricemia in Chinese adults. J Nutr Sci Vitaminol (Tokyo). 2012; 58:339–345. PMID: 23327969.
135. Xia Y, Xiang Q, Gu Y, Jia S, Zhang Q, Liu L, Meng G, Wu H, Bao X, Yu B, et al. A dietary pattern rich in animal organ, seafood and processed meat products is associated with newly diagnosed hyperuricaemia in Chinese adults: a propensity score-matched case-control study. Br J Nutr. 2018; 119:1177–1184. PMID: 29759111.
136. Lin K, McCormick N, Yokose C, Joshi AD, Lu N, Curhan GC, Merriman TR, Saag KG, Ridker PM, Buring JE, et al. Interactions between genetic risk and diet influencing risk of incident female gout: discovery and replication analysis of four prospective cohorts. Arthritis Rheumatol. 2023; 75:1028–1038. PMID: 36512683.
137. Roman YM. Moving the needle in gout management: the role of culture, diet, genetics, and personalized patient are practices. Nutrients. 2022; 14:3590. PMID: 36079846.