Journal List > Nutr Res Pract > v.18(5) > 1516088436

Kim, Kwon, Hong, Koo, and Lee: Development and application of an evaluation tool for school food culture in elementary, middle, and high schools in Gyeonggi Province, South Korea

Abstract

BACKGROUND/OBJECTIVES

To encourage schools to transform school meal programs to be more educational, it is necessary to evaluate the related environment using a whole school approach. We developed a school food culture evaluation tool to quantitatively evaluate school food culture in Gyeonggi Province, Korea.

SUBJECTS/METHODS

Based on a literature review, a school food culture evaluation system consisting of areas, subareas, indicators, and questions (scored on a 5-point scale) was constructed. The validity of the tool was reviewed using focus group interviews, the Delphi technique, and a preliminary survey. Subsequently, evaluation tool was applied to elementary, middle, and high schools in Gyeonggi Province. Data from 115 schools were used for the final analysis. This included 64 elementary schools, 29 middle schools, and 22 high schools. At least one respondent from each group—school administrators, teachers, and nutrition teachers (or dietitians)—participated. The results were compared at the school level.

RESULTS

The evaluation tool consisted of 66 questions in 5 areas (institutional environment, physical environment, educational environment, educational governance, and school meal quality). The total average score for school food culture was 3.83 points (elementary school 3.89 points, middle school 3.76 points, and high school 3.76 points) and did not differ significantly among school levels. Among the 5 evaluation areas, scores were highest for institutional environment (4.43 points) and lowest for physical environment (3.07 points). Scores for educational environment, educational governance, and school meal quality were 3.86, 3.85, and 3.97 points, respectively.

CONCLUSION

It is necessary to improve the physical environment to create a desirable school food culture in Gyeonggi Province. To effectively promote healthy eating, ongoing investment and interventions by local authorities at improving school food culture are needed, with an emphasis on particular factors, such as the eating environment and staff training.

INTRODUCTION

A growing body of research indicates the importance of the whole school culture in individual and collective food knowledge, skills, disposition and behavior [1]. School meal programs play an important role in not only forming students’ eating habits but also in improving academic performance [23]. To improve the quality of school meals, the Korean Ministry of Education and the Metropolitan and Provincial Offices of Education conducts annual evaluations and hygiene inspections of school meal operations [4]. Additionally, since 2007, satisfaction with school meals has been surveyed among students, parents, and faculty members in elementary, middle, and high schools across the country [5].
Previous research on school meals in Korea has primarily focused on operations, hygiene [678], and satisfaction [910]. In other countries, attempts have been made to comprehensively evaluate the environment related to school meals following the “whole school approach,” which involves considering various factors, such as nutrition education, meal quality, and environmental conditions. In the UK, the “Food for Life Partnership” implements various projects, including school gardens, cooking classes, farm links, dietary education integrated with school meals, school meal quality improvement, and student and parent power. In addition, the “Food for Life Schools Awards” recognizes based on environmental standards related to school meals [11]. The US Department of Agriculture awards the Healthier US School Challenge (HUSSC) based on the quality of school meals, nutritional education, physical education, and physical activities [12].
In order for school meal programs to fulfill their original purpose of establishing a foundation for lifelong health by forming healthy eating habits and cultivating dietary management skills, school meals should not be approached simply from the perspective of providing nutritionally balanced meals or nutrition education. It is necessary to evaluate school food culture, which is the culture within a school formed by the environment related to school meal programs. School food culture has recently been used by researchers and organizations to arrange actions aimed at the establishment of healthy and sustainable meals. Roos [13] defined “school food culture” as “shared beliefs and priorities driving the thinking and actions related to food at school” and Hart and Page [1] defined it as “product of a school’s physical and social food environment, including food provision, food policies and practices (including extra-curricular activities), alongside the formal learning provided through the curriculum.” The American non-profit organization “Action for Healthy Kids” described school food culture as “the school’s philosophy and approach to school meals, snacks, beverages, rewards, celebrations, and the experience of eating, for staff and students” [14]. However, studies of school food culture have not been conducted in South Korea.
To encourage schools to transform school meal programs into healthier and more effective educational programs with a whole school approach, it is necessary to establish a system that can comprehensively diagnose school food culture. However, a tool to assess the school food culture in Korea has not yet been developed. We developed a school food culture evaluation tool and applied it to elementary, middle, and high schools in Gyeonggi Province to obtain basic data that can be utilized to establish policies to improve the integrated quality of school food culture.

SUBJECTS AND METHODS

Development of an evaluation tool for school food culture

Definition of school food culture

Based on a literature review and case studies [1141516], we derived the concept of school food culture and collected expert opinions. The expert advisory committee included 11 people, including a school commissioner from the Gyeonggido Office of Education, a university professor specializing in educational policy, a school administrator, and a school nutrition teacher. The opinions of the expert advisory committee were collected through focus group interviews and written consultations. The final concept of school food culture reflected the opinions of expert advisors. The purpose and scope of the evaluation tool were based on the established concept of school food culture.

Development of an evaluation tool

Based on a literature review and case studies [45121718192021], evaluation areas, subareas, and indicators were constructed and questions for each indicator were developed. The validity of the evaluation tool was reviewed through focus group interviews and written consultations with an expert advisory committee comprising 11 experts. A draft of the evaluation tool was prepared by revising the areas, subareas, indicators, and questions based on their feedback.
The Delphi technique was used to finalize the evaluation tool. The Delphi survey was conducted twice in October 2022 by targeting an expert advisory committee. The first Delphi survey was conducted to collect expert opinions on the appropriateness of the evaluation subareas and questions. Respondents were asked to rate the appropriateness of the subareas and questions on a 5-point scale (1 = not at all appropriate to 5 = very appropriate).
The purpose of the 2nd Delphi survey was to assess the appropriateness of the revised evaluation tool based on opinions from the 1st Delphi survey and ultimately reach a consensus among the expert group. The degree of agreement with the revision, derived from the results of the 1st Delphi survey, was also assessed on a 5-point scale. Additionally, open-ended questions were included to identify improvements in opinions regarding the revised questions.
A preliminary survey was conducted to review the field applicability of the revised evaluation tool with school administrators (principal or vice principal), curriculum managers (dean of students or director of research), and nutrition teachers from elementary, middle, and high schools in Gyeonggi Province. Opinions were collected regarding the appropriateness and level of understanding of the questions. The questions were revised based on preliminary survey results to confirm the final evaluation tool system.

Evaluation of school food culture in Gyeonggi Province

Subjects

The survey was administered to school administrators, teachers, and nutrition teachers (or dietitians) from 2,528 (as of 2022) elementary, middle, high schools, and special schools in Gyeonggi Province. A total of 595 school administrators, 599 teachers, and 522 nutrition teachers (or dietitians) responded to the survey. Data from 115 schools (64 elementary schools, 29 middle schools, and 22 high schools), where at least one respondent from each of the 3 groups—school administrators, teachers, and nutrition teachers (or dietitians)—participated, were used for the final analysis.
The evaluation tool was developed for school administrators (principal or vice principal), curriculum managers (dean of students or director of research), and nutrition teachers and dietitians. However, considering the limitations of recruitment, the survey of curriculum managers was expanded to include all teachers in this study.

Survey

A self-administered online survey was conducted using the developed evaluation tool. The study was approved by the Institutional Review Board (IRB) of Myonji University (IRB approval number: MJU-2022-10-002-01) and was conducted in November, 2022. All participants were asked to respond to 5 questions on their general characteristics. Additionally, separate sets of questions were prepared for school administrators (17), teachers (21), and nutrition teachers or dietitians (53).

Analysis

For the Delphi survey results, the mean, standard deviation, and content validity ratio (CVR) were calculated for each subarea and question. The CVR represents the ratio of the number of respondents who answered positively to the total number of respondents. The closer it is to 0, the more likely it is that the expert group failed to reach a consensus. In this study, CVR was calculated based on the formula described by Lawshe [22]. Since a 5-point scale was applied in this study, items with a score of 4 or more were interpreted as valid. The standard for determining whether the CVR was met depends on the number of respondents. In this study, the CVR standard value was 0.59 as the total number of respondents was 11 [22]. Therefore, items with a CVR of less than 0.59 were judged to have low validity.
The frequency, percentage, average, and standard deviation were calculated for each item. All results were compared at the school level using chi-square test, Fisher’s exact test, or analysis of variance and Duncan’s post hoc test. The significance level was determined as P < 0.05. All statistical analyses were performed using SPSS/WIN 27.0 (Statistical Package for Social Sciences, SPSS Inc., Chicago, IL, USA).

RESULTS

Development of an evaluation tool for school food culture

Definition of school food culture

Based on a literature review [15131416] and expert opinions, school food culture was defined as follows: the environment related to food consumption in schools and the values, beliefs, and behavior patterns shared by school members related to school meals and nutrition education.

Derivation of an evaluation tool

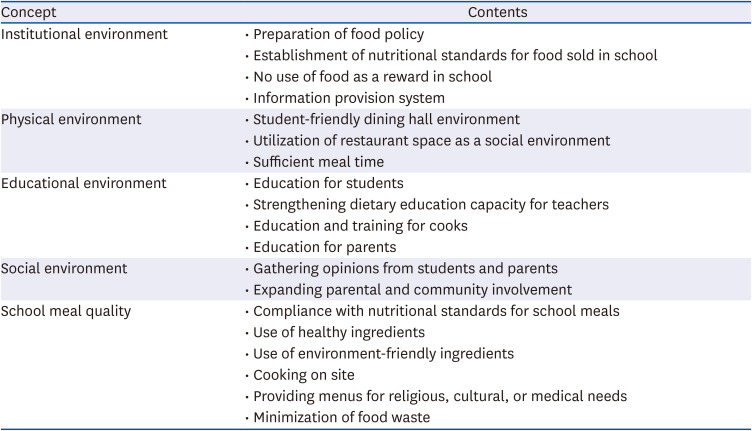
Table 1 shows the main concepts and corresponding contents included in the evaluation criteria for the evaluation tools for school food culture in previous studies [1217182021]. They were divided into 5 categories, institutional environment, physical environment, educational environment, social environment, and school meal quality, referring to the evaluation criteria included in the reviewed evaluation tools.
Table 1

Common concepts of evaluation tools for school food culture in other countries

nrp-18-746-i001
Concept Contents
Institutional environment • Preparation of food policy
• Establishment of nutritional standards for food sold in school
• No use of food as a reward in school
• Information provision system
Physical environment • Student-friendly dining hall environment
• Utilization of restaurant space as a social environment
• Sufficient meal time
Educational environment • Education for students
• Strengthening dietary education capacity for teachers
• Education and training for cooks
• Education for parents
Social environment • Gathering opinions from students and parents
• Expanding parental and community involvement
School meal quality • Compliance with nutritional standards for school meals
• Use of healthy ingredients
• Use of environment-friendly ingredients
• Cooking on site
• Providing menus for religious, cultural, or medical needs
• Minimization of food waste
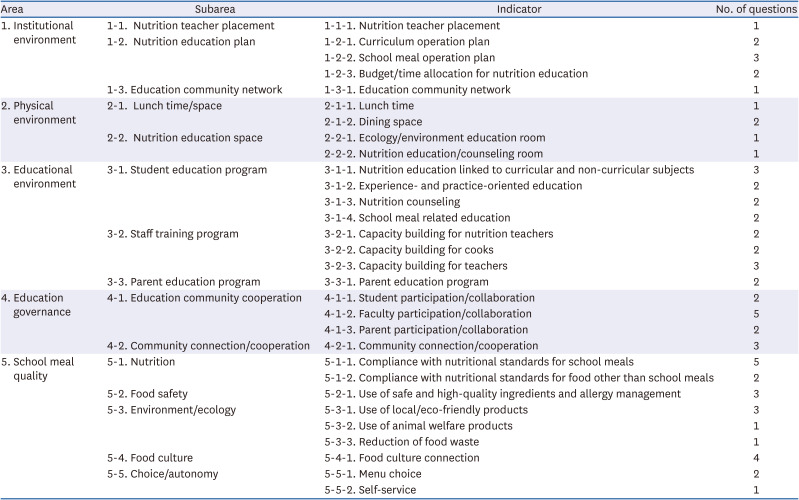
Subsystems of areas, subareas, and indicators were developed, and questions for each indicator were derived based on previous studies [45121718192021]. The questions were designed to be answered by the school principal, curriculum manager, and nutrition teachers (or dietitians).
As presented in Table 2, the final evaluation tool consisted of 5 areas, 15 subareas, and 30 indicators and ultimately included 66 questions. All questions were scored on a 5-point scale. Questions about perceptions were rated on a 5-point scale (1 = completely disagree to 5 = strongly agree), and questions asking about facts were converted to a 5-point scale depending on the response. In common questions, the average value was applied for evaluation.
Table 2

Design of a school food culture evaluation tool

nrp-18-746-i002
Area Subarea Indicator No. of questions
1. Institutional environment 1-1. Nutrition teacher placement 1-1-1. Nutrition teacher placement 1
1-2. Nutrition education plan 1-2-1. Curriculum operation plan 2
1-2-2. School meal operation plan 3
1-2-3. Budget/time allocation for nutrition education 2
1-3. Education community network 1-3-1. Education community network 1
2. Physical environment 2-1. Lunch time/space 2-1-1. Lunch time 1
2-1-2. Dining space 2
2-2. Nutrition education space 2-2-1. Ecology/environment education room 1
2-2-2. Nutrition education/counseling room 1
3. Educational environment 3-1. Student education program 3-1-1. Nutrition education linked to curricular and non-curricular subjects 3
3-1-2. Experience- and practice-oriented education 2
3-1-3. Nutrition counseling 2
3-1-4. School meal related education 2
3-2. Staff training program 3-2-1. Capacity building for nutrition teachers 2
3-2-2. Capacity building for cooks 2
3-2-3. Capacity building for teachers 3
3-3. Parent education program 3-3-1. Parent education program 2
4. Education governance 4-1. Education community cooperation 4-1-1. Student participation/collaboration 2
4-1-2. Faculty participation/collaboration 5
4-1-3. Parent participation/collaboration 2
4-2. Community connection/cooperation 4-2-1. Community connection/cooperation 3
5. School meal quality 5-1. Nutrition 5-1-1. Compliance with nutritional standards for school meals 5
5-1-2. Compliance with nutritional standards for food other than school meals 2
5-2. Food safety 5-2-1. Use of safe and high-quality ingredients and allergy management 3
5-3. Environment/ecology 5-3-1. Use of local/eco-friendly products 3
5-3-2. Use of animal welfare products 1
5-3-3. Reduction of food waste 1
5-4. Food culture 5-4-1. Food culture connection 4
5-5. Choice/autonomy 5-5-1. Menu choice 2
5-5-2. Self-service 1

Validity of the evaluation tool

The evaluation tool involved a 4-stage system of areas, subareas, indicators, and questions. The validity of the evaluation tool was reviewed through focus group interviews and written consultations with an expert advisory group.
As a result of the 1st Delphi survey to verify the validity of 15 subareas within 5 areas, the CVR for each subarea was 0.66–1.00. According to Lawshe [22], when the number of expert group is 11, the minimum acceptable CVR value is 0.59; thus, all subareas were valid. The CVR for questions in each subarea ranged from 0.27 to 1.00. Questions with a CVR of less than 0.59 included 3 questions in the physical environment area, such as “the cafeteria is actively used as a space for communication or nutrition education outside of meal times” (0.27), 4 questions in the educational environment area, such as “experiential ecology and environment education opportunities are provided to all students” (0.45), and 2 questions in the social environment area, such as “we are operating a nutrition education program linked with local community resources and facilities” (0.45). Nine questions that did not meet the judgment criteria were deleted or partially modified based on the opinions of the experts.
The 2nd Delphi survey was conducted using a revised evaluation tool that reflects the results of the 1st Delphi survey. All questions met the judgment criteria. However, there were some suggestions for revising the terminology; in particular, the meal time was modified to the lunch time allocated in the curriculum and the social environment area was changed to educational governance.

School food culture in Gyeonggi Province

General characteristics of the schools

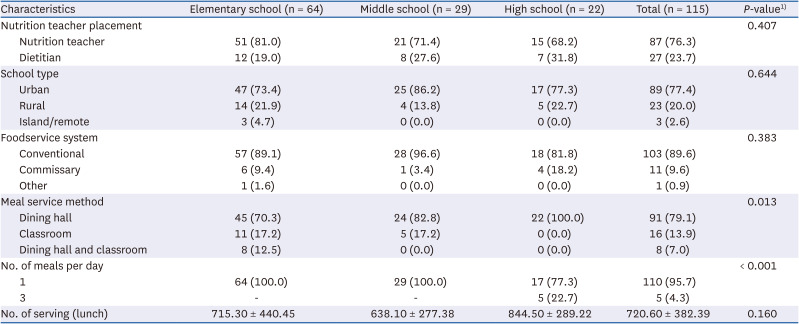
Table 3 shows the general characteristics of the schools investigated. In total, responses from school administrators, teachers, and nutrition teachers (or dietitians) were obtained from 115 schools, including 64 elementary schools (55.7%), 29 middle schools (25.2%), and 22 high schools (19.1%). Nutrition teachers were assigned to 76.3% of the schools surveyed, 77.4% were located in urban areas, and 89.6% operated a conventional foodservice system.
Table 3

General characteristic of schools surveyed

nrp-18-746-i003
Characteristics Elementary school (n = 64) Middle school (n = 29) High school (n = 22) Total (n = 115) P-value1)
Nutrition teacher placement 0.407
Nutrition teacher 51 (81.0) 21 (71.4) 15 (68.2) 87 (76.3)
Dietitian 12 (19.0) 8 (27.6) 7 (31.8) 27 (23.7)
School type 0.644
Urban 47 (73.4) 25 (86.2) 17 (77.3) 89 (77.4)
Rural 14 (21.9) 4 (13.8) 5 (22.7) 23 (20.0)
Island/remote 3 (4.7) 0 (0.0) 0 (0.0) 3 (2.6)
Foodservice system 0.383
Conventional 57 (89.1) 28 (96.6) 18 (81.8) 103 (89.6)
Commissary 6 (9.4) 1 (3.4) 4 (18.2) 11 (9.6)
Other 1 (1.6) 0 (0.0) 0 (0.0) 1 (0.9)
Meal service method 0.013
Dining hall 45 (70.3) 24 (82.8) 22 (100.0) 91 (79.1)
Classroom 11 (17.2) 5 (17.2) 0 (0.0) 16 (13.9)
Dining hall and classroom 8 (12.5) 0 (0.0) 0 (0.0) 8 (7.0)
No. of meals per day < 0.001
1 64 (100.0) 29 (100.0) 17 (77.3) 110 (95.7)
3 - - 5 (22.7) 5 (4.3)
No. of serving (lunch) 715.30 ± 440.45 638.10 ± 277.38 844.50 ± 289.22 720.60 ± 382.39 0.160
Values are presented as number (%) or mean ± SD.
1)P-value by χ2 test, Fisher's exact test, or analysis of variance.
There were no differences according to the school level in terms of nutrition teacher placement, school type, or foodservice system. All high schools provided meals at the cafeteria, compared with 70.3% of elementary schools (P = 0.013). One meal per day was provided in elementary and middle schools; however, 5 out of 22 high schools provided 3 meals per day (P < 0.001). The average number of students eating lunch was 720, with no difference between the school levels.

Evaluation by areas of school food culture

Table 4 presents the evaluation results for each of the 5 school food culture areas. The average total score was 3.83 points (elementary schools 3.89 points, middle schools 3.76 points, and high schools 3.76 points), and there was no significant difference along school levels.
Table 4

Evaluation of 5 areas of school food culture

nrp-18-746-i004
Area Elementary school (n = 64) Middle school (n = 29) High school (n = 22) Total (n = 115) P-value1)
1. Institutional environment 4.49 ± 0.382) 4.39 ± 0.41 4.31 ± 0.32 4.43 ± 0.38 0.122
2. Physical environment 3.17 ± 0.92 2.85 ± 0.97 3.08 ± 0.91 3.07 ± 0.93 0.310
3. Educational environment 3.96 ± 0.53b 3.76 ± 0.49ab 3.69 ± 0.35a 3.86 ± 0.50 0.045
4. Education governance 3.89 ± 0.56 3.81 ± 0.42 3.76 ± 0.39 3.85 ± 0.50 0.507
5. School meal quality 3.95 ± 0.50 3.98 ± 0.46 3.95 ± 0.42 3.97 ± 0.48 0.948
Total score 3.89 ± 0.37 3.76 ± 0.40 3.76 ± 0.27 3.83 ± 0.37 0.152
Values are presented as mean ± SD.
1)P-value by analysis of variance; 2)The 5-points scale (1= not at all appropriate to 5 = very appropriate).
a,bSignificant difference at P < 0.05 by Duncan’s post hoc test.
Among the 5 evaluation areas, the highest score was obtained for the institutional environment (overall average 4.43 points) and the lowest score was obtained for the physical environment (overall average 3.07 points). Scores for educational environment, educational governance, and school meal quality were 3.86, 3.85, and 3.97 points, respectively. Significant differences were observed among school levels in the educational environment (P = 0.045). The score for the elementary school educational environment was 3.96 points, which was significantly higher than that for the high school level (3.69 points) (P < 0.05).

Evaluation of institutional and physical environments

Table 5 shows the evaluation results for subareas and indicators of the institutional and physical environments. For subareas of the institutional environment, the average scores for nutrition teacher placement, nutrition education plan, and education community network, were 4.53, 4.38, and 4.38 points, respectively. There were no significant differences among school levels in all subareas; however, the scores for the nutrition education plan at elementary schools (4.46 points) tended to be higher than those for middle schools (4.32 points) and high schools (4.24 points) (P = 0.073). Among the indicators of the nutrition education plan, score for the budget/time allocation for nutrition education tended to be higher for elementary schools (4.56 points) than for middle schools (4.33 points) and high schools (4.46 points) (P = 0.057).
Table 5

Evaluation of institutional and physical environments of school food culture

nrp-18-746-i005
Subarea and indicator Elementary school (n = 64) Middle school (n = 29) High school (n = 22) Total (n = 115) P-value1)
1. Institutional environment
1-1. Nutrition teacher placement 4.63 ± 0.792) 4.45 ± 0.91 4.36 ± 0.95 4.53 ± 0.85 0.389
1-2. Nutrition education plan 4.46 ± 0.44 4.32 ± 0.44 4.24 ± 0.33 4.38 ± 0.43 0.073
1-2-1. Curriculum operation plan 4.52 ± 0.79 4.56 ± 0.51 4.25 ± 0.58 4.48 ± 0.70 0.227
1-2-2. School meal operation plan 4.31 ± 0.61 4.07 ± 0.67 4.12 ± 0.48 4.21 ± 0.61 0.146
1-2-3. Budget/time allocation for nutrition education 4.56 ± 0.41 4.33 ± 0.66 4.36 ± 0.39 4.46 ± 0.49 0.057
1-3. Education community network 4.39 ± 0.41 4.42 ± 0.51 4.31 ± 0.34 4.38 ± 0.42 0.669
2. Physical environment
2-1. Luch time/space 4.20 ± 0.64 4.24 ± 0.59 4.45 ± 0.35 4.25 ± 0.59 0.216
2-1-1. Lunch time 4.56 ± 0.83 4.72 ± 0.70 4.91 ± 0.43 4.67 ± 0.75 0.154
2-1-2. Dining space 3.83 ± 0.85 3.75 ± 0.70 3.99 ± 0.61 3.84 ± 0.77 0.541
2-2. Nutrition education space 2.15 ± 1.66 1.47 ± 1.83 1.70 ± 1.79 1.89 ± 1.74 0.184
2-2-1. Ecology/environment education room 3.44 ± 2.34b 1.90 ± 2.47a 2.27 ± 2.55ab 2.83 ± 2.49 0.010
2-2-2. Nutrition education/counseling room 0.86 ± 1.90 1.03 ± 2.06 1.14 ± 2.14 0.96 ± 1.98 0.828
Values are presented as mean ± SD.
1)P-value by analysis of variance; 2)The 5-points scale (1 = not at all appropriate to 5 = very appropriate).
a,bSignificant difference at P < 0.05 by Duncan’s post hoc test.
Regarding the physical environment, the score for lunch time/space was 4.25 points. However, the nutrition education space scored very low (i.e., 1.89 points). Among the indicators for lunch time/space, the score for dining space (3.84 points) was lower than that for lunch time (4.67 points), and there was no significant difference among school levels. Among the indicators for the nutrition education space, a significant difference was observed in the scores for the ecology/environment education room among school levels (P = 0.010). Middle schools averaged only 1.90 points, which was significantly lower than that for elementary schools (3.44 points) (P < 0.05). For nutrition education/counseling room, the average score was 0.96 points, which was the lowest score among all indicators, and there was no difference among school levels.

Evaluation of educational environment and governance

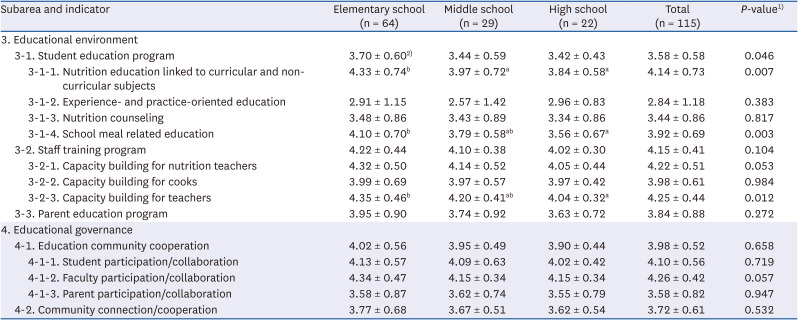
Table 6 presents the evaluation results for subareas and indicators of the educational environment and governance. For subareas of the educational environment, the overall averages for student education program, staff training program, and parent education program were relatively low (i.e., 3.58, 4.15, and 3.84 points, respectively). The scores for the student education program differed with respect to the school level (P = 0.046), with nutrition education linked to curricular and non-curricular subjects scoring the highest at 4.14 points and experience- and practice-oriented education scoring the lowest at 2.84 points. There was a significant difference in nutrition education linked to curricular and non-curricular subjects among school levels (P = 0.007); elementary schools scored 4.33 points, which was significantly higher than the scores for middle schools (3.97 points) and high schools (3.84 points) (P < 0.05). Differences were also detected among school levels in school-meal-related education (P = 0.003); elementary schools scored 4.10 points, which was significantly higher than score for high schools (3.56 points) (P < 0.05).
Table 6

Evaluation of educational environment and governance of school food culture

nrp-18-746-i006
Subarea and indicator Elementary school (n = 64) Middle school (n = 29) High school (n = 22) Total (n = 115) P-value1)
3. Educational environment
3-1. Student education program 3.70 ± 0.602) 3.44 ± 0.59 3.42 ± 0.43 3.58 ± 0.58 0.046
3-1-1. Nutrition education linked to curricular and non-curricular subjects 4.33 ± 0.74b 3.97 ± 0.72a 3.84 ± 0.58a 4.14 ± 0.73 0.007
3-1-2. Experience- and practice-oriented education 2.91 ± 1.15 2.57 ± 1.42 2.96 ± 0.83 2.84 ± 1.18 0.383
3-1-3. Nutrition counseling 3.48 ± 0.86 3.43 ± 0.89 3.34 ± 0.86 3.44 ± 0.86 0.817
3-1-4. School meal related education 4.10 ± 0.70b 3.79 ± 0.58ab 3.56 ± 0.67a 3.92 ± 0.69 0.003
3-2. Staff training program 4.22 ± 0.44 4.10 ± 0.38 4.02 ± 0.30 4.15 ± 0.41 0.104
3-2-1. Capacity building for nutrition teachers 4.32 ± 0.50 4.14 ± 0.52 4.05 ± 0.44 4.22 ± 0.51 0.053
3-2-2. Capacity building for cooks 3.99 ± 0.69 3.97 ± 0.57 3.97 ± 0.42 3.98 ± 0.61 0.984
3-2-3. Capacity building for teachers 4.35 ± 0.46b 4.20 ± 0.41ab 4.04 ± 0.32a 4.25 ± 0.44 0.012
3-3. Parent education program 3.95 ± 0.90 3.74 ± 0.92 3.63 ± 0.72 3.84 ± 0.88 0.272
4. Educational governance
4-1. Education community cooperation 4.02 ± 0.56 3.95 ± 0.49 3.90 ± 0.44 3.98 ± 0.52 0.658
4-1-1. Student participation/collaboration 4.13 ± 0.57 4.09 ± 0.63 4.02 ± 0.42 4.10 ± 0.56 0.719
4-1-2. Faculty participation/collaboration 4.34 ± 0.47 4.15 ± 0.34 4.15 ± 0.34 4.26 ± 0.42 0.057
4-1-3. Parent participation/collaboration 3.58 ± 0.87 3.62 ± 0.74 3.55 ± 0.79 3.58 ± 0.82 0.947
4-2. Community connection/cooperation 3.77 ± 0.68 3.67 ± 0.51 3.62 ± 0.54 3.72 ± 0.61 0.532
Values are presented as mean ± SD.
1)P-value by analysis of variance; 2)The 5-points scale (1 = not at all appropriate to 5 = very appropriate).
a,bSignificant difference at P < 0.05 by Duncan’s post hoc test.
Among the indicators of the staff training program, a significant difference was found among school levels in teacher capacity building (P = 0.012); elementary schools scored 4.35 points, which was significantly higher than the score for high schools of 4.04 points (P < 0.05). There was also a tendency for differences among school levels in nutrition teacher capacity building (P = 0.053).
With respect to subareas of educational governance, scores for educational community cooperation and community connection/cooperation were 3.98 and 3.72 points, respectively. Among the indicators of educational community cooperation, parent participation/collaboration had the lowest score (3.58 points); score for elementary schools (4.34 points) tended to be higher than those for high schools (4.15 points) in faculty participation/collaboration (P = 0.057).

Evaluation of school meal quality

Table 7 shows the evaluation results for subareas of the school meal quality. The scores for nutrition, food safety, ecology/environment, food culture, and choice/autonomy were 4.60, 4.45, 3.87, 4.14, and 2.75, respectively.
Table 7

Evaluation of school meal quality of school food culture

nrp-18-746-i007
Subarea and indicator Elementary school (n = 64) Middle school (n = 29) High school (n = 22) Total (n = 115) P-value1)
5-1. Nutrition 4.67 ± 0.462) 4.47 ± 0.50 4.54 ± 0.36 4.60 ± 0.46 0.106
5-1-1. Compliance with nutritional standards for school meals 4.62 ± 0.45b 4.37 ± 0.53a 4.20 ± 0.44a 4.48 ± 0.50 0.001
5-1-2. Compliance with nutritional standards for food other than school meals 4.73 ± 0.79 4.57 ± 0.96 4.89 ± 0.53 4.72 ± 0.80 0.369
5-2. Food safety 4.58 ± 0.66b 4.45 ± 0.68b 4.06 ± 0.71a 4.45 ± 0.70 0.010
5-3. Environment/ecology 4.01 ± 0.60b 3.90 ± 0.60b 3.40 ± 0.47a 3.87 ± 0.62 < 0.001
5-3-1. Use of local/eco-friendly products 3.72 ± 0.93b 3.59 ± 0.90b 2.62 ± 0.90a 3.48 ± 1.00 < 0.001
5-3-2. Use of animal welfare products 3.92 ± 1.15 3.72 ± 1.00 3.41 ± 1.05 3.77 ± 1.10 0.163
5-3-3. Reduction of food waste 4.39 ± 0.49 4.38 ± 0.68 4.18 ± 0.39 4.35 ± 0.53 0.265
5-4. Food culture 4.23 ± 0.65 4.07 ± 0.76 3.98 ± 0.50 4.14 ± 0.66 0.236
5-5. Choice/autonomy 2.26 ± 1.71a 3.04 ± 1.93ab 3.78 ± 1.72b 2.75 ± 1.86 0.002
5-5-1. Menu choice 3.03 ± 1.15a 3.50 ± 1.33ab 3.93 ± 1.18b 3.32 ± 1.24 0.008
5-5-2. Self-service 1.48 ± 2.30a 2.59 ± 2.54ab 3.64 ± 2.28b 2.17 ± 2.49 0.001
Values are presented as mean ± SD.
1)P-value by analysis of variance; 2)The 5-points scale (1 = not at all appropriate to 5 = very appropriate).
a,bSignificant difference at P < 0.05 by Duncan’s post hoc test.
Among 5 subareas, differences among school levels were found for food safety (P = 0.010), ecology/environment (P < 0.001), and choice/autonomy (P = 0.002). For food safety, scores for elementary schools (4.58 points) and middle schools (4.45 points) were significantly higher than those for high schools (4.06 points) (P < 0.05). Scores for ecology/environment were significantly higher in elementary schools (4.01 points) and middle schools (3.90 points) than in high schools (3.40 points) (P < 0.05). In terms of choice/autonomy, scores for high schools (3.78 points) were significantly higher than those for elementary schools (2.26 points) (P < 0.05).
Among the indicators of nutrition, significant differences were found at the school level in compliance with the nutritional standards for school meals (P = 0.001); scores for elementary schools (4.62 points) were significantly higher than those for middle schools (4.37 points) and high schools (4.20 points). In an analysis of ecology/environment indicator, scores for the use of local/eco-friendly products were significantly higher for elementary schools (3.72 points) and middle schools (3.59 points) than for high schools (2.62 points) (P < 0.05). An analysis of the choice/autonomy indicator revealed a significant difference among school levels for both menu choice (P = 0.008) and self-service (P = 0.001). In the case of menu choice, scores for high schools (3.93 points) were significantly higher than those for elementary schools (3.03 points) (P < 0.05). A similar difference was observed for self-service (P < 0.05), with a score of only 1.48 points for elementary schools.

DISCUSSION

The school meal program is an integral part of schools which adopt a holistic approach to promote health by recognizing the importance of the social environment of the school, where learning is put into practice [23]. A growing body of research indicates the importance of the whole school culture in influencing individual and collective food knowledge, skills, and behavior [1]. In this study, based on the concept of school food culture, we developed a tool to comprehensively evaluate the role of school meals, beyond simply providing meals, in forming correct eating habits and cultivating dietary management skills.
We defined school food culture as “the environment related to food consumption in schools and the values, beliefs, and behavior patterns shared by school members related to school meals and nutrition education,” consistent with previous definitions [114]. In various countries, the school environment related to school meals has been evaluated from an integrated perspective, including the evaluation areas considered in this study. For example, in the UK, the Food for Life Partnership program evaluates the overall environmental level related to school meals on indicators in 4 areas (food quality, leadership and food culture, food education, and partnership with the community) and awards “Food for Life Schools Awards” [21]. “Better Eating, Better Learning” in Scotland [17] and “HUSSC” in the USA [12] are also designed to evaluate the school food environment from an integrated perspective. These programs are based on the fact that school food policies, cultures, and environments influence students’ opportunities to put their learning into action [1].
In this study, improving the physical environment was identified as the most urgent requirement for creating a desirable school food culture in Gyeonggi Province. Among various subareas, the scores were high for lunch time/space (4.25 out of 5.0 points) and low for nutrition education space (1.89 points). In particular, the score for the nutrition education/counseling center indicator was the lowest among all evaluated indicators (0.96 points). Although the Enforcement Decree of the School Meal Act includes nutrition counseling as a duty of nutrition teachers [24], most schools are not properly equipped with rooms in which nutrition teachers can efficiently provide nutritional counseling. A previous study has also shown that while nutrition teachers recognize the importance of nutritional counseling, their performance level is insufficient. Among the reasons for not providing nutritional counseling, a lack of time was the most common (30.7%), followed by facility (14.7%) [25]. It is necessary to allocate rooms in which nutrition teachers can provide efficient education and counseling to school members. In addition, policy support is needed to create ecological and environmental education spaces in all levels of schools where experiential education, including cooking class, is possible. England serves as a good example, where cooking has been a statutory part of the new national curriculum since 2014, supported by the School Food Plan [26].
The score for lunch time was relatively high at 4.67 points, while that for the dining space was low at 3.84 points. However, in this evaluation tool, the question about lunch time was constructed by examining the time allocated to the school curriculum, which is not equivalent to the actual mealtime. The time may vary depending on the turnover, school size, and restaurant size. Even in other countries, time is a key resource limited to all schools studied [26]. The physical environment, including mealtime, is known to influence eating behavior [27]. Sahota et al. [28] identified the dining experience as a significant factor in shaping the experiences of students and attitudes towards school dining. Hart [26] revealed that the physical setting makes conversations difficult, and many pupils do not interact with others while eating. One of the barriers to building social cohesion during school lunches is the design of the commonly used long banquet-style tables. Modifying food provision and the dining environment can improve learning-related eating behaviors of students [22930]. A layout to support students’ opportunities for relaxation, social interaction with peers, and sufficient mealtime is needed. Further research on the association between the physical environment and eating outcomes of students is needed. Moore et al. [31] pointed out that without addressing a wide range of factors, including the physical eating environment and time available for eating, school nutritional policy may only play a limited role in influencing what children eat.
The institutional environment related to school food culture was relatively good, regardless of school level. However, the budget and time allocation for nutrition education tended to be insufficient in middle and high schools compared with elementary schools (P = 0.057); therefore, nutrition education should be strengthened in the curriculum of middle and high schools, in particular, and awareness of is importance among school members should be emphasized. Similar results were identified in the educational environment evaluation, where the curricular and non-curricular nutrition education for students (P = 0.007) and school-meal-related education (P = 0.003) were inadequate in middle and high schools compared with results for elementary schools. There is a need to establish a policy foundation to actively promote nutrition education in middle and high schools; in particular, a change in the perception of school staff seems necessary.
In addition, as experience- and practice-oriented education for students was insufficient at all school levels, it is necessary to develop corresponding programs. Experiential and practical learning, such as cooking, gardening, and taste testing, is a useful strategy for improving the knowledge, attitudes, and behaviors of children towards healthy eating [323334]. In England, the School Food Plan called for the introduction of cooking and learning about food as a statutory part of the new national curriculum from September 2014 [26], with long-term goals of enabling “children to leave school with an appreciation of good food, and the skills they need to feed themselves affordably and well” [33].
In terms of educational governance, regardless of the school level, the level of education community cooperation and community connection/cooperation was insufficient; therefore, it is necessary to improve awareness of the importance and necessity of school food culture for the community. In particular, the level of parent participation/collaboration was very low (3.58 points), suggesting the importance of workshops and educational programs for parents. Hart [26] explored the social context of food practices in schools in England and found that complex social processes, including school bonds with the community and parents, influenced the roles of food in schools. Parents can enhance or diminish the likelihood of pupils consuming balanced meals during school day.
The quality of school meals was generally excellent; however, there were shortcomings in terms of ecology/environment and choice/autonomy. It is necessary to improve systems to enable the provision of meals that realize ecological and environmental values, such as the use of local and eco-friendly products. In terms of choice/autonomy, the lower the school level, the more insufficient it was; therefore, it will be necessary to identify obstacles in the school setting and provide support for improvement. In the case of self-service, elementary schools had very low score of 1.48 points. The Gyeonggi Provincial Office of Education started a pilot project for voluntary choice meal service in 2022 and expanded its application in 2023; it had a positive effect on satisfaction and self-efficacy in healthy eating of students [35].
Meanwhile, some questions in the draft of the evaluation tool, such as “the cafeteria is actively utilized as a space for communication or nutrition education space outside of meal times” and “sufficient nutrition education programs are provided for community residents other than parents,” were removed from the Delphi survey. This decision was made considering the current realities of Korean schools. However, these areas are also important for ultimately creating a desirable school food culture, and therefore, continuous attention and proactive implementation are necessary.
Action for Healthy Kids, an American non-profit organization that supports the creation of a healthy eating environment in schools described “healthy school food culture” as follows: “school policies and practices consistently make the healthy choices the easy and desirable one. School staff role model healthy eating habits. Students and families receive consistent messages about healthy eating across all aspects of school” [14]. As children learn from their experiences throughout school [36], a whole school approach (i.e., holistic approach to learning to eat) to educate children and promote health should be applied. The positive effects of a desirable school food culture have been demonstrated. Fruit and vegetable consumption was higher for students in schools that participated in the Food for Life Partnership program than for schools that did not participate, not only at school but also at home, especially for students from schools that won the Food for Life School Award. Satisfaction with school meals was significantly higher as well [37].
In conclusion, this study highlighted specific confounders regarding the success of government policy initiatives targeting school meals as a means of improving eating behaviors. To fully exploit the potential of schools to promote healthy eating, ongoing investment and interventions by local authorities are recommended to improve school food culture, with an emphasis on particular factors, such as the eating environment and comprehensive staff training.
This study represents the first attempt to comprehensively evaluate school food culture in Korea. The newly developed evaluation tool can be used by schools to independently assess school food culture and promote voluntary development. By assessing the school food culture annually, schools can determine the progress made and gather essential data for future development plans. The data collected can also be used by education offices to provide professional consulting, ultimately improving student satisfaction with the meal program. However, since this study was limited to Gyeonggi Province, it is necessary to expand the scope of the work, including nationwide evaluations. More in-depth and extensive follow-up research on school food culture must be conducted.

Notes

Funding: This research was financially supported by grants from Gyeonggido Office of Education.

Conflict of Interest: The authors declare no potential conflicts of interests.

Author Contributions:

  • Conceptualization: Lee Y, Koo Y.

  • Formal analysis: Lee Y.

  • Investigation: Lee Y, Hong SK, Kim M, Kwon S.

  • Methodology: Lee Y, Kim M, Kwon S, Hong SK.

  • Writing - original draft: Lee Y, Kim M, Kwon S.

  • Writing - review & editing: Lee Y, Hong SK, Koo Y.

References

1. Hart CS, Page A. The capability approach and school food education and culture in England: ‘gingerbread men ain’t gonna get me very far’. Camb J Educ. 2020; 50:673–693.
2. Storey HC, Pearce J, Ashfield-Watt PA, Wood L, Baines E, Nelson M. A randomized controlled trial of the effect of school food and dining room modifications on classroom behaviour in secondary school children. Eur J Clin Nutr. 2011; 65:32–38. PMID: 20978529.
3. Faught EL, Gleddie D, Storey KE, Davison CM, Veugelers PJ. Healthy lifestyle behaviours are positively and independently associated with academic achievement: an analysis of self-reported data from a nationally representative sample of Canadian early adolescents. PLoS One. 2017; 12:e0181938. PMID: 28753617.
4. Ministry of Education (KR). The 5th School Meal Hygiene Management Guidelines. Sejong: Ministry of Education;2021.
5. The Korean Educational Development Institute. School Meal Satisfaction Survey. Jincheon: The Korean Educational Development Institute;2018.
6. Na HL, Kim MH, Choi MK. Evaluation of sanitary education and performance of sanitary management among school food service employees in Sejong. J Korean Diet Assoc. 2019; 25:17–29.
7. Seo YH, Moon KD. Monitoring and risk assessment of pesticides in school foodservice products in Seoul, Korea. Korean J Food Preserv. 2014; 21:69–74.
8. Kim YS, Kim BH, Kim KA, Kim DH, Yun HJ, Kwak SH, Kang KJ, Cho WH, Moh AR, Choi OK, et al. Safety assessment of biogenic amines in school-meal fishery products. J Food Hyg Saf. 2020; 35:125–135.
9. Kim JH, Kim HS. A survey on the satisfaction of middle school students with school meals and their food preferences. J Korea Contents Assoc. 2016; 16:488–496.
10. Lee KY, Bae YJ, Choi MK, Kim MH. Satisfaction on school meal service and food preference of elementary school students in Chungnam. Korean J Food Nutr. 2017; 30:129–138.
11. Soil Association. The Food for Life Schools Award [Internet]. Edinburgh: Soil Association;2024. cited 2024 March 11. Available from: https://www.foodforlife.org.uk/.
12. US Department of Agriculture. The HealthierUS School Challenge [Internet]. Washington, D.C.: US Department of Agriculture;2024. cited 2024 March 11. Available from: https://letsmove.obamawhitehouse.archives.gov/healthierus-school-challenge.
13. Roos G. One size fits all? – differences in school food cultures identified in iPOPY research. Mikkelsen BE, He C, Mikkola M, Nielsen T, Nymoen LL, editors. CORE Organic Project Series Report. Tjele: ICROFS;2009. p. 54–56.
14. Action For Healthy Kids. Action For Healthy Kids’ website [Internet]. Skokie (IL): Action For Healthy Kids;2024. cited 2024 March 11. Available from: https://www.actionforhealthykids.org/.
15. Great Schools Partnership. The glossary of education reform [Internet]. Portland: Great Schools Partnership;2014. cited 2024 March 11. Available from: https://www.edglossary.org/.
16. Kim MJ, Lee HM. Analysis of school culture research trends in Korea. J Yeolin Educ. 2015; 23:255–284.
17. The Scottish Government. Better Eating, Better Learning: Self-Evaluation Tool. Edinburgh: The Scottish Government;2014.
18. Department for Education (UK). Healthy Schools Rating Scheme: Guidance for Schools. London: Department for Education;2019.
19. Ministry of Education (KR). Status of school lunch program in Korea [Internet]. Sejong: Ministry of Education;2023. cited 2023 December 10. Available from: https://www.moe.go.kr.
20. Wellness School Assessment Tool. Wellness School Assessment Tool’s website [Internet]. Connecticut: Wellness School Assessment Tool;2021. cited 2024 March 11. Available from: https://www.wellsat.org/.
21. Food for Life. Food for Life Partnership [Internet]. Bristol: Food for Life;2024. cited 2024 March 11. Available from: https://www.foodforlife.org.uk/.
22. Lawshe CH. A quantitative approach to content validity. Person Psychol. 1975; 28:563–575.
23. Denman S. Health promoting schools in England--a way forward in development. J Public Health Med. 1999; 21:215–220. PMID: 10432253.
24. The Korean Law Information Center. Enforcement Decree of the School Meal Act, Duties of Nutrition Teachers. Sejong: The Korean Law Information Center;2021.
25. Lee KH, Choi BS, Lee IS. Job satisfaction and perception of importance-performance among nutrition counseling by nutrition teachers in Kyungbuk area. 2010; 20:1018–1028.
26. Hart CS. The School Food Plan and the social context of food in schools. Camb J Educ. 2016; 46:211–231.
27. Stroebele N, De Castro JM. Effect of ambience on food intake and food choice. Nutrition. 2004; 20:821–838. PMID: 15325695.
28. Sahota P, Woodward J, Molinari R, Pike J. Factors influencing take-up of free school meals in primary- and secondary-school children in England. Public Health Nutr. 2014; 17:1271–1279. PMID: 23578731.
29. Golley R, Baines E, Bassett P, Wood L, Pearce J, Nelson M. School lunch and learning behaviour in primary schools: an intervention study. Eur J Clin Nutr. 2010; 64:1280–1288. PMID: 20808337.
30. Marcano-Olivier MI, Horne PJ, Viktor S, Erjavec M. Using nudges to promote healthy food choices in the school dining room: a systematic review of previous investigations. J Sch Health. 2020; 90:143–157. PMID: 31852016.
31. Moore SN, Murphy S, Tapper K, Moore L. The social, physical and temporal characteristics of primary school dining halls and their implications for children’s eating behaviors. Health Educ. 2010; 110:399–411.
32. Varman SD, Cliff DP, Jones RA, Hammersley ML, Zhang Z, Charlton K, Kelly B. Experiential learning interventions and healthy eating outcomes in children: a systematic literature review. Int J Environ Res Public Health. 2021; 18:10824. PMID: 34682570.
33. Dimbleby H, Vincent J. The School Food Plan. London: Department for Education (UK);2013.
34. Parmer SM, Salisbury-Glennon J, Shannon D, Struempler B. School gardens: an experiential learning approach for a nutrition education program to increase fruit and vegetable knowledge, preference, and consumption among second-grade students. J Nutr Educ Behav. 2009; 41:212–217. PMID: 19411056.
35. Gyeonggido Office of Education. Autonomous Choice Meal Service Evaluation Report. Suwon: Gyeonggido Office of Education;2023.
36. Parsons C, Stears D, Thomas C. The health promoting school in Europe: conceptualising and evaluating the change. Health Educ J. 1996; 55:311–321.
37. Jones M, Pitt H, Oxford L, Bray I, Kimberlee R, Orme J. Pupil Survey in Local Commission Areas: Food for Life’s Impact on Primary School Children’s Consumption of Fruit and Vegetables. Full Report. Bristol: University of the West of England;2015.
TOOLS
Similar articles