Journal List > Nutr Res Pract > v.18(5) > 1516088435

Lee, Choi, Ahn, Park, Hwang, Yeo, and Oh: Food-related media use and eating behavior in different food-related lifestyle groups of Korean adolescents in metropolitan areas

Abstract

BACKGROUND/OBJECTIVES

This study investigated the relationship between adolescent food-related lifestyles and food-related media use and eating behavior in Korea.

SUBJECTS/METHODS

Participants were 392 Korean adolescents, ranging in age from 12 to 18, recruited via convenience sampling. They completed a self-report questionnaire survey consisting of questions about food-related lifestyle, food-related media use, food consumption behavior, food literacy, and nutrition quotient. Data analysis was conducted using SPSS 29.0. (IBM Co., Armonk, NY, USA).

RESULTS

The factor analysis of food-related lifestyles identified four factors. Based on the cluster analysis results, participants were classified into three clusters reflecting different levels of interest: high interest in food, moderate interest in food, and low interest in food. The analysis revealed significant differences between groups in food-related liestyle factors (P < 0.05). Notably, the high-interest group demonstrated proactive engagement with food-related content, a willingness to explore diverse culinary experiences, and a conscientious consideration of nutritional labeling during food purchases. In contrast, the low-interest group reported tendencies toward overeating or succumbing to stimulating food consumption post-exposure to food-related content, coupled with a disregard for nutritional labeling when making food choices. A stronger inclination toward a food-related lifestyle was positively correlated with higher levels of food literacy and nutrition quotient.

CONCLUSION

This study proposes that the implementation of a nutrition education program using media could effectively promote a healthy diet among adolescents with a high level of interest in their dietary habits. For adolescents with low interest in their dietary habits, it suggests that introducing an education program with a primary focus on enhancing food literacy could be beneficial in fostering a healthy diet. Our research findings provide insight for the development of tailored nutritional education programs and establishment of effective nutrition policies.

INTRODUCTION

In recent years, the proliferation of digital media platform services such as YouTube and Instagram has fueled rapid growth in user-generated media. Among various types of user-generated media content, food-related content such as “Mukbang” and “Cookbang” has gained worldwide popularity [1]. Mukbang, short for “eating broadcast,” is a genre of videos featuring everyday eating scenes without any special content or gimmicks. Consumers engage with Mukbang in various ways. “Cookbang,” a portmanteau of “Cook” and “Broadcast,” refers to a broadcasting format where hosts demonstrate cooking recipes by actually cooking and eating [2]. In its early days, Cookbang was considered a subset of Mukbang, often serving as the opening act and showcasing the main menu preparation stage [3]. Food content provides viewers with recipes and increases interest in food ingredients, serving as a positive means of information sharing. However, its critics claim it promotes unhealthy food consumption and showcases inappropriate eating behaviors that can contribute to overeating and obesity [4].
In 2000, the World Health Organization (WHO) classified obesity as a “chronic disease requiring long-term treatment” and a “global epidemic of the 21st century” [5]. A 2020 World Obesity Federation report estimated that 38% of the world’s population was overweight or obese and projected that this figure would increase to 51% by 2035. The report also highlighted a rapid increase in obesity among adolescents [6]. Korea is not immune from this trend; over the past decades, the obesity rate among Korean adolescents has significantly increased [7]. Among boys, the obesity rate rose from 6.8% in 2011 to 17.5% in 2021—a 2.6-fold increase. Similarly, girls showed a 2.2-fold increase, from 4.2% in 2011 to 9.1% in 2021 [7]. In response to these trends, the Ministry of Health and Welfare in South Korea issued a “Comprehensive National Obesity Management Plan (2018–2022).” This plan described Mukbang as “media promoting overeating” and emphasized the high correlation between the increased consumption of food-related content and the incidence of obesity [8].
As obesity in adolescence is a risk factor for chronic diseases in adulthood, this issue deserves particular attention [9]. During adolescence, young people experience physical and mental growth and maturity and develop the lifestyles that determine their health, well-being, and quality of life in adulthood [10]. Thus, to improve adult quality of life, it is important to establish healthy eating habits in adolescence [11]. Fortunately, unhealthy eating habits among adolescents can be corrected through education [12]. For this purpose, developing nutrition education programs that take into account young people’s utilization of food-related media and eating behaviors is crucial for promoting health and preventing disease [13].
One tool to evaluate dietary habits, “food literacy,” refers to one’s overall knowledge and skills related to the production, selection, preparation, consumption, and disposal of agricultural and food products, as well as one’s ability to understand, explain, and interact with them effectively [14]. A meta-analysis of previous food literacy research [15] found a positive correlation between food literacy and the dietary habits of adolescents. Food literacy can play an important role in shaping the dietary habits of adolescents, and greater food literacy has been found to help adolescents maintain healthy eating habits [1617].
Another food-related evaluation aid is “nutrition quotient” (NQ), which assesses three key factors essential for maintaining a healthy dietary lifestyle: balanced consumption of a variety of necessary foods (Balance), limited intake of unhealthy foods (Moderation), and practicing healthy and safe eating behaviors (Practice). By scoring dietary behaviors in these areas and assigning NQ grades, the tool enables the judgment of the adequacy of dietary habits [18]. This tool has been utilized in various studies related to adolescent nutrition [1920].
This study aimed to classify Korean adolescents in metropolitan areas into groups based on their food-related lifestyle scores and to examine differences in food-related media use, food consumption behavior, food literacy scores, and NQ scores among these groups. Additionally, we offer recommendations for the development of tailored nutrition education programs based on the differences observed among these groups. We expect that these findings will contribute to the formulation of effective nutrition policies.

SUBJECTS AND METHODS

Study participants

The participants in this study were adolescents aged 12–18 yr living in the Seoul and Gyeonggi metropolitan areas of the Republic of Korea. The survey was conducted using an online self-administered questionnaire (accessed via Google QR code), which was available for 3 mon, from October 14, 2022, to December 22, 2022. The survey was distributed to middle and high schools recruited through convenience sampling. Participants voluntarily responded to the questionnaire. Of the total 396 questionnaire responses, 4 were excluded because they were missing answers. A total of 392 responses (99% response rate) were used for analysis. The purpose, significance, and intended use of the research were explained to both the participants and their legal guardians prior to the survey, and they provided consent to participate in the study through online signatures. This study was conducted after obtaining approval from the Sangmyung University Institutional Review Board (IRB No. IRB-SMU-C-2023-1-0015).

Demographic survey

The demographic characteristics of interest included date of birth, sex, height, weight, grade level, type of residence, and household composition. Body mass index (BMI; kg/m2) was calculated using height and weight measurements [21].

Survey on food-related media use

The food-related media use measurement tool was constructed based on previous studies [2223]. The survey included questions about participants' experiences watching food-related content (such as Mukbang or Cookbang), the primary social media platforms they used for food-related content, the frequency with which they watched such content, their preferred types of content, their perception of the influence of food content on their eating habits, their reasons for watching, and their personal experiences with uploading food-related content.

Assessment of food consumption behavior

Questions on food consumption behavior investigated the participants’ experiences of late-night eating, food and snack acquisition (specifically, the locations where participants typically purchased their meals and snacks), and level of awareness of nutrition information presented on food products.

Investigation of food-related lifestyle

The items regarding food-related lifestyle were constructed based on previous research [24], comprising a total of 25 questions categorized into 5 items each related to health, safety, taste, trend, and economic aspects. Participants were asked to rate their agreement with statements on a 5-point Likert scale ranging from “Strongly Disagree” (1 point) to “Strongly Agree” (5 points).

Assessment of adolescents’ food literacy

For food literacy, the study used the Food Information Comprehension Scale, a tool for measuring food literacy at each stage of life [142526]. Specifically, it used the scale for children and adolescents, which consists of 19 items categorized into production (3 items), distribution (3 items), selection (7 items), cooking (3 items), and intake (3 items). Participants responded to each item using a 5-point Likert scale, ranging from “Strongly Disagree” (1 point) to “Strongly Agree” (5 points). The weights for each domain and item were calculated. The domain weights were as follows: production (0.175), distribution (0.25), selection (0.20), cooking (0.175), and intake (0.20). The item weights were as follows: production item 1 (9.09), production item 2 (6.82), production item 3 (9.09), distribution item 4 (7.99), distribution item 5 (8.68), distribution item 6 (8.33), selection item 7 (3.66), selection item 8 (3.72), selection item 9 (3.34), selection item 10 (3.61), selection item 11 (3.66), selection item 12 (3.56), selection item 13 (3.45), cooking item 14 (7.80), cooking item 15 (8.78), cooking item 16 (8.41), intake item 17 (7.91), intake item 18 (7.29), intake item 19 (9.80). Sums of weights of 62 or higher were evaluated as “High,” those between 51 and 61 were evaluated as “Medium-High,” those between 41 and 50 were evaluated as “Medium-Low,” and those below 41 were evaluated as “Low” [142526].

Assessment of adolescents’ NQ

For NQ, the study used the NQ-A 2021 scale, a nutritional assessment tool that comprehensively evaluates the quality of meals and eating behaviors in adolescents [18]. It consists of 20 items categorized into balance (8 items), moderation (9 items), and practice (3 items). Participants responded to each item using a 5-point Likert scale, ranging from “Almost never eat” (1 point) to “More than once a day” (5 points). The weights for each domain and item were calculated. The domain weights were as follows: balance (0.15), moderation (0.30), and practice (0.55). The item weights were as follows: balance item 1 (0.017), balance item 2 (0.027), balance item 3 (0.014), balance item 4 (0.025), balance item 5 (0.013), balance item 6 (0.025), balance item 7 (0.014), balance item 8 (0.015), moderation item 1 (0.038), moderation item 2 (0.041), moderation item 3 (0.035), moderation item 4 (0.028), moderation item 5 (0.019), moderation item 6 (0.036), moderation item 7 (0.041), moderation item 8 (0.035), moderation item 9 (0.027), practice item 1 (0.122), practice item 2 (0.238), and practice item 3 (0.190). Sums of weights of 58.6 or higher were evaluated as “High,” those between 44.0 and 58.5 were evaluated as “Medium,” and those below 44.0 were evaluated as “Low” [18].

Statistical analyses

Statistical analysis was conducted using SPSS 29.0 (IBM Co., Armonk, NY, USA), and statistical significance was defined as P < 0.05. To understand the demographic characteristics of the participants, frequency analysis and descriptive statistics were employed. Principal component analysis was used to examine the segmentation of food-related lifestyle factors. Varimax orthogonal rotation was employed as the factor rotation method in the factor analysis. Items with communalities below 0.4 (Item 1, Item 14), factor loadings below 0.5 (no items), inter-factor correlations indicating non-independence (Item 8, Item 13, Item 16), and only one factor (Item 15) were excluded from the analysis [2728]. Ultimately, the 19 items that met the criteria of communalities above 0.4, factor loadings above 0.5, and eigenvalues above 1 were selected for inclusion in the analysis. After assessing internal consistency using Cronbach’s α, each factor was subjected to K-means cluster analysis for clustering, and the between-cluster differences and significance levels were calculated using analysis of variance (ANOVA). To analyze the differences in media use and food consumption behavior characteristics according to the derived clusters, a chi-square test was conducted. To analyze the differences among clusters in terms of food literacy and NQ, ANOVA analysis was conducted, followed by Tukey’s post-hoc test.

RESULTS

Characteristics of the study participants

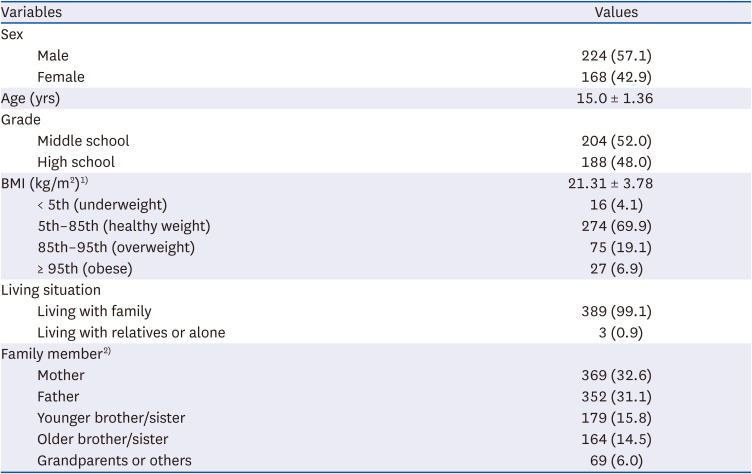
Table 1 presents the demographic characteristics of the 392 participants. Among them, 57.1% were male, and 42.9% were female. The mean age of the participants was 15.0 ± 1.36 yrs; 52.0% were middle school students, and 48.0% were high school students. The average BMI was 21.31 ± 3.78 kg/m2, which was within the normal weight range. Regarding current living arrangements, 99.1% of the participants reported living with their families.
Table 1

Characteristics of study participants (n = 392)

nrp-18-687-i001
Variables Values
Sex
Male 224 (57.1)
Female 168 (42.9)
Age (yrs) 15.0 ± 1.36
Grade
Middle school 204 (52.0)
High school 188 (48.0)
BMI (kg/m2)1) 21.31 ± 3.78
< 5th (underweight) 16 (4.1)
5th–85th (healthy weight) 274 (69.9)
85th–95th (overweight) 75 (19.1)
≥ 95th (obese) 27 (6.9)
Living situation
Living with family 389 (99.1)
Living with relatives or alone 3 (0.9)
Family member2)
Mother 369 (32.6)
Father 352 (31.1)
Younger brother/sister 179 (15.8)
Older brother/sister 164 (14.5)
Grandparents or others 69 (6.0)
Values are expressed as frequencies (%) or means ± SD.
BMI, body mass index.
1)BMI is based on the World Health Organization standards.
2)The “Family member” question was multiple-choice.

Food-related lifestyle variable factor analysis

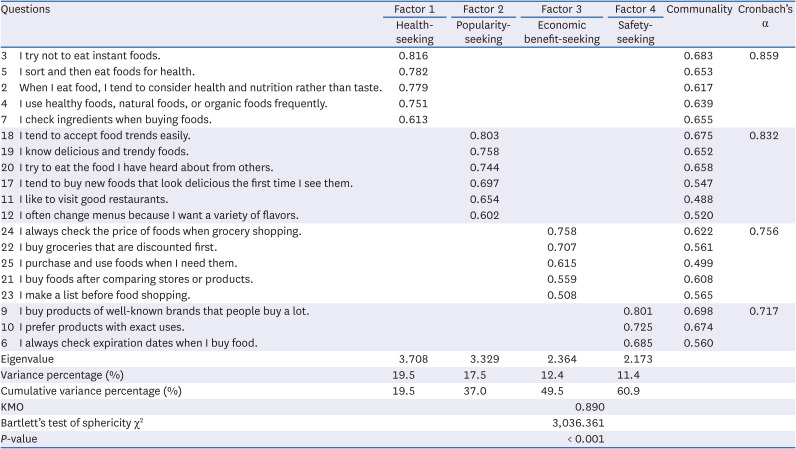
The food-related lifestyle variable factor analysis (Table 2) extracted four factors. The Kaiser-Meyer-Olkin (KMO) measure was found to be 0.890, indicating high explanatory power. Bartlett's test of sphericity yielded a significant result of 3,036.361 (P < 0.001), supporting the suitability of factor analysis [29]. The total variance explained by the factors was 60.9%. The four extracted factors were named based on previous research [24]. Factor 1 consisted of 5 items, including “I try not to eat instant foods” and “I sort and then eat foods for health” and was named the “Health-seeking.” It had an eigenvalue of 3.708 and a Cronbach’s α of 0.859 and explained 19.5% of the variance. Factor 2 consisted of 6 items, including “I tend to accept food trends easily” and “I know delicious and trendy food” and was named the “Popularity-seeking.” It had an eigenvalue of 3.329 and a Cronbach's α of 0.832 and explained 17.5% of the variance. Factor 3 consisted of 5 items, including “I always check the price of foods when grocery shopping” and “I buy groceries that are discounted first” and was named the “Economic benefit-seeking.” It had an eigenvalue of 2.364 and a Cronbach’s α of 0.756 and explained 12.4% of the variance. Factor 4 consisted of 3 items, including “I buy products of well-known brands that people buy a lot” and “I prefer products with exact uses” and was named the “Safety-seeking.” It had an eigenvalue of 2.173 and a Cronbach's α of 0.717 and explained 11.4% of the variance.
Table 2

Food-related lifestyle variable factor analysis

nrp-18-687-i002
Questions Factor 1 Factor 2 Factor 3 Factor 4 Communality Cronbach’s α
Health-seeking Popularity-seeking Economic benefit-seeking Safety-seeking
3 I try not to eat instant foods. 0.816 0.683 0.859
5 I sort and then eat foods for health. 0.782 0.653
2 When I eat food, I tend to consider health and nutrition rather than taste. 0.779 0.617
4 I use healthy foods, natural foods, or organic foods frequently. 0.751 0.639
7 I check ingredients when buying foods. 0.613 0.655
18 I tend to accept food trends easily. 0.803 0.675 0.832
19 I know delicious and trendy foods. 0.758 0.652
20 I try to eat the food I have heard about from others. 0.744 0.658
17 I tend to buy new foods that look delicious the first time I see them. 0.697 0.547
11 I like to visit good restaurants. 0.654 0.488
12 I often change menus because I want a variety of flavors. 0.602 0.520
24 I always check the price of foods when grocery shopping. 0.758 0.622 0.756
22 I buy groceries that are discounted first. 0.707 0.561
25 I purchase and use foods when I need them. 0.615 0.499
21 I buy foods after comparing stores or products. 0.559 0.608
23 I make a list before food shopping. 0.508 0.565
9 I buy products of well-known brands that people buy a lot. 0.801 0.698 0.717
10 I prefer products with exact uses. 0.725 0.674
6 I always check expiration dates when I buy food. 0.685 0.560
Eigenvalue 3.708 3.329 2.364 2.173
Variance percentage (%) 19.5 17.5 12.4 11.4
Cumulative variance percentage (%) 19.5 37.0 49.5 60.9
KMO 0.890
Bartlett’s test of sphericity χ2 3,036.361
P-value < 0.001
KMO, Kaiser-Meyer-Olkin.

Cluster analysis of food-related lifestyle variables

Table 3 presents the results of the K-means cluster analysis on the four food-related lifestyle factor scores of the participants. Adolescence is a crucial developmental period characterized by changes in dietary habits, attitudes, and voluntary food choices and consumption, marking the transition from childhood to adulthood in terms of dietary behaviors. Moreover, the lifestyles of adolescents often exhibit variations in the degree of interest in food, rather than distinct characteristics as seen in adults [30]. Therefore, drawing on previous research [3132], this study classified three clusters based on the distribution of factor scores, reflecting different levels of interest in food. Cluster 1 showed the highest scores in all food-related lifestyle factors. Therefore, it was named the “High-interest in food group.” Cluster 2 demonstrated scores similar to the mean across all food-related lifestyle factors. As a result, this cluster was named the “Moderate-interest in food group.” Cluster 3 had lower scores in all food-related lifestyle factors than the other clusters; therefore, it was named the “Low-interest in food group.”
Table 3

Cluster analysis of food-related lifestyle variables

nrp-18-687-i003
Variables Mean ± SD Cluster 1 (n = 103) Cluster 2 (n = 209) Cluster 3 (n = 80) P-value1)
Health-seeking 2.78 ± 0.86 3.69 ± 0.68a 2.67 ± 0.54b 1.87 ± 0.62c < 0.001
Popularity-seeking 3.04 ± 0.80 3.65 ± 0.77a 3.02 ± 0.57b 2.33 ± 0.71c < 0.001
Economic benefit-seeking 3.10 ± 0.77 3.84 ± 0.56a 3.06 ± 0.49b 2.27 ± 0.69c < 0.001
Safety-seeking 3.51 ± 0.86 4.36 ± 0.51a 3.49 ± 0.59b 2.61 ± 0.92c < 0.001
Cluster name High-interest in food group Moderate-interest in food group Low-interest in food group
a,b,cDifferent superscripts indicate significant differences (P < 0.001) by Tukey’s method.
1)Analysis of variance was used to test differences across groups for continuous variables.

Differences in media use characteristics among food-related lifestyle groups

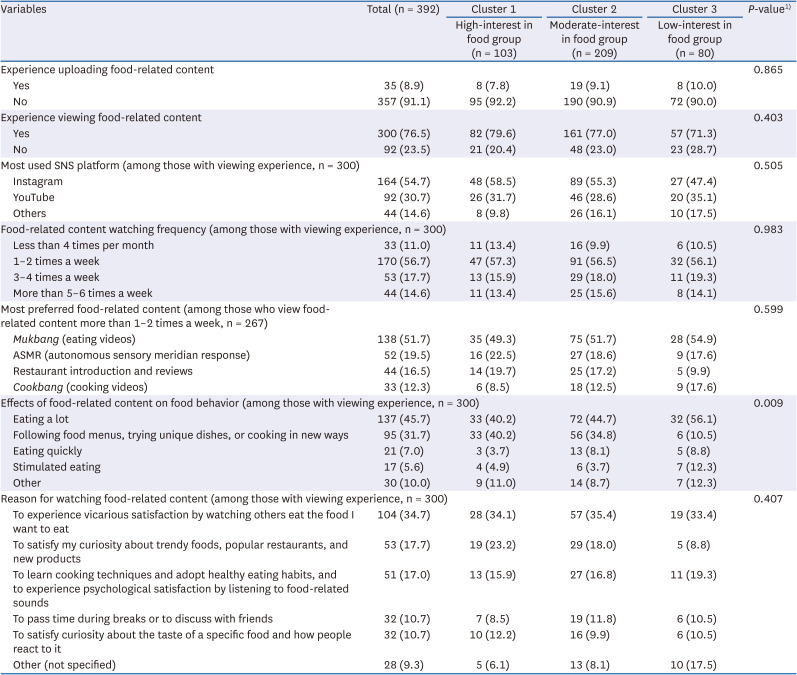
Table 4 presents the results of the cross-analysis in this study on cluster-based differences in media use. Concerning food-related content on social networking services (SNS), 91.1% of participants reported no uploading experience, while 76.5% reported viewing food-related content. A separate analysis was conducted on the responses from the 300 adolescents who had experience viewing food-related content, focusing on their most-used SNS platforms, the frequency of their viewing food-related content, the impact of SNS viewing on their eating habits, and their reasons for viewing. The most-used SNS platforms were Instagram (54.7%) and YouTube (30.7%). For frequency of viewing food-related content, 56.7% viewed “1–2 times a week,” followed by 17.7% “3–4 times a week,” and 14.6% “More than 5–6 times a week.” Among adolescents who viewed food-related content 1–2 times a week or more, preferences for content types were as follows: Mukbang 51.7%, ASMR (autonomous sensory meridian response—a relaxing sensation some people experience from certain sounds or visuals) 19.5%, restaurant introductions and reviews 16.5%, and Cookbang 12.3%. Regarding the impact of food-related content on their eating habits, 45.7% mentioned “Eating a lot,” and 31.7% mentioned “Following food menus, trying unique dishes or cooking in unconventional ways.” Cross-analysis of these patterns across clusters yielded statistically significant results; in Cluster 3, a significant percentage of participants (56.1%) reported experiences of “Eating a lot,” and a notable percentage (12.3%) reported experiences of content “Stimulated eating,” while a relatively low percentage (10.5%) reported experiences of “Following food menus, trying unique dishes, or cooking in unconventional ways” (P < 0.01). In contrast, Cluster 1 exhibited the highest percentage (40.2%) of experiences related to “Following food menus, trying unique dishes, or cooking in unconventional ways,” compared to Cluster 3 (10.5%). Additionally, Cluster 1 showed a lower percentage (40.2%) of experiences related to “Eating a lot,” compared to Cluster 3 (56.1%), highlighting significant variations among the clusters (P < 0.01). Among the reasons for watching food-related content, the most prevalent were “To experience vicarious satisfaction by watching others eat food I want to eat” (34.7%), “To satisfy my curiosity about trendy foods, popular restaurants, and new products” (17.7%), and “To learn cooking techniques and adopt healthy eating habits, and to experience psychological satisfaction by listening to food-related sounds” (17.0%). This indicates that adolescents primarily watch food-related content for vicarious fulfillment and information seeking.
Table 4

Differences in media use characteristics among food-related lifestyle groups

nrp-18-687-i004
Variables Total (n = 392) Cluster 1 Cluster 2 Cluster 3 P-value1)
High-interest in food group (n = 103) Moderate-interest in food group (n = 209) Low-interest in food group (n = 80)
Experience uploading food-related content 0.865
Yes 35 (8.9) 8 (7.8) 19 (9.1) 8 (10.0)
No 357 (91.1) 95 (92.2) 190 (90.9) 72 (90.0)
Experience viewing food-related content 0.403
Yes 300 (76.5) 82 (79.6) 161 (77.0) 57 (71.3)
No 92 (23.5) 21 (20.4) 48 (23.0) 23 (28.7)
Most used SNS platform (among those with viewing experience, n = 300) 0.505
Instagram 164 (54.7) 48 (58.5) 89 (55.3) 27 (47.4)
YouTube 92 (30.7) 26 (31.7) 46 (28.6) 20 (35.1)
Others 44 (14.6) 8 (9.8) 26 (16.1) 10 (17.5)
Food-related content watching frequency (among those with viewing experience, n = 300) 0.983
Less than 4 times per month 33 (11.0) 11 (13.4) 16 (9.9) 6 (10.5)
1–2 times a week 170 (56.7) 47 (57.3) 91 (56.5) 32 (56.1)
3–4 times a week 53 (17.7) 13 (15.9) 29 (18.0) 11 (19.3)
More than 5–6 times a week 44 (14.6) 11 (13.4) 25 (15.6) 8 (14.1)
Most preferred food-related content (among those who view food-related content more than 1–2 times a week, n = 267) 0.599
Mukbang (eating videos) 138 (51.7) 35 (49.3) 75 (51.7) 28 (54.9)
ASMR (autonomous sensory meridian response) 52 (19.5) 16 (22.5) 27 (18.6) 9 (17.6)
Restaurant introduction and reviews 44 (16.5) 14 (19.7) 25 (17.2) 5 (9.9)
Cookbang (cooking videos) 33 (12.3) 6 (8.5) 18 (12.5) 9 (17.6)
Effects of food-related content on food behavior (among those with viewing experience, n = 300) 0.009
Eating a lot 137 (45.7) 33 (40.2) 72 (44.7) 32 (56.1)
Following food menus, trying unique dishes, or cooking in new ways 95 (31.7) 33 (40.2) 56 (34.8) 6 (10.5)
Eating quickly 21 (7.0) 3 (3.7) 13 (8.1) 5 (8.8)
Stimulated eating 17 (5.6) 4 (4.9) 6 (3.7) 7 (12.3)
Other 30 (10.0) 9 (11.0) 14 (8.7) 7 (12.3)
Reason for watching food-related content (among those with viewing experience, n = 300) 0.407
To experience vicarious satisfaction by watching others eat the food I want to eat 104 (34.7) 28 (34.1) 57 (35.4) 19 (33.4)
To satisfy my curiosity about trendy foods, popular restaurants, and new products 53 (17.7) 19 (23.2) 29 (18.0) 5 (8.8)
To learn cooking techniques and adopt healthy eating habits, and to experience psychological satisfaction by listening to food-related sounds 51 (17.0) 13 (15.9) 27 (16.8) 11 (19.3)
To pass time during breaks or to discuss with friends 32 (10.7) 7 (8.5) 19 (11.8) 6 (10.5)
To satisfy curiosity about the taste of a specific food and how people react to it 32 (10.7) 10 (12.2) 16 (9.9) 6 (10.5)
Other (not specified) 28 (9.3) 5 (6.1) 13 (8.1) 10 (17.5)
Values are presented as number (%).
1)The χ2 test was used to test differences across groups for categorical variables.

Differences in food consumption behavior characteristics among food-related lifestyle groups

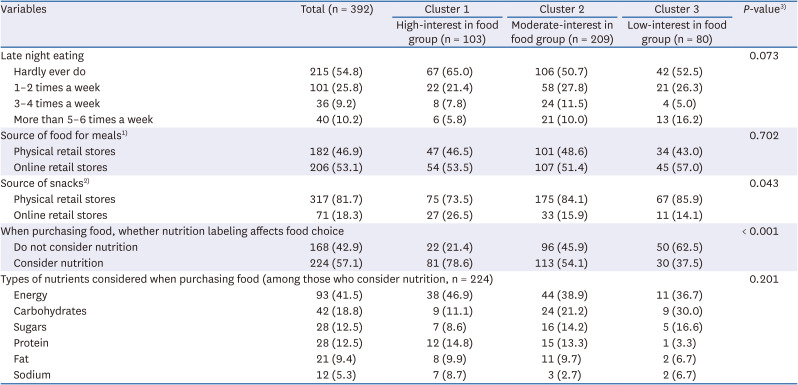
Table 5 presents the results of the cross-tabulation analysis conducted to examine between-cluster differences in food consumption behavior characteristics. More than half of the subjects (54.8%) responded to the item on late-night eating with “Hardly ever do.” When purchasing food for meals, 46.9% preferred physical retail stores for primary grocery shopping, while 53.1% preferred online retail stores. In contrast, for snack purchases, 81.7% preferred physical retail stores, while 18.3% chose online retail stores. Most participants purchased snacks from physical retail stores, with Clusters 2 (84.1%) and 3 (85.9%) showing significantly higher usage rates of physical retail stores compared to Cluster 1 (73.5%) (P < 0.05). Additionally, 57.1% of participants indicated that nutritional labeling influenced their food choices, with statistically significant differences between clusters (P < 0.001). A total of 78.6% of participants in Cluster 1 and 54.1% in Cluster 2 reported that nutrition labeling influenced their food choices, while only 37.5% of participants in Cluster 3 reported that nutrition labeling influenced their food choices. Higher levels of interest in food were associated with a higher likelihood of considering nutritional labeling when making food choices (P < 0.001). Among the 224 adolescents who responded that nutritional labeling influenced their food choices, the most impactful nutritional information components were energy (41.5%), carbohydrates (18.8%), sugars and protein (each at 12.5%), fat (9.4%), and sodium (5.3%).
Table 5

Differences in food consumption behavior characteristics among food-related lifestyle groups

nrp-18-687-i005
Variables Total (n = 392) Cluster 1 Cluster 2 Cluster 3 P-value3)
High-interest in food group (n = 103) Moderate-interest in food group (n = 209) Low-interest in food group (n = 80)
Late night eating 0.073
Hardly ever do 215 (54.8) 67 (65.0) 106 (50.7) 42 (52.5)
1–2 times a week 101 (25.8) 22 (21.4) 58 (27.8) 21 (26.3)
3–4 times a week 36 (9.2) 8 (7.8) 24 (11.5) 4 (5.0)
More than 5–6 times a week 40 (10.2) 6 (5.8) 21 (10.0) 13 (16.2)
Source of food for meals1) 0.702
Physical retail stores 182 (46.9) 47 (46.5) 101 (48.6) 34 (43.0)
Online retail stores 206 (53.1) 54 (53.5) 107 (51.4) 45 (57.0)
Source of snacks2) 0.043
Physical retail stores 317 (81.7) 75 (73.5) 175 (84.1) 67 (85.9)
Online retail stores 71 (18.3) 27 (26.5) 33 (15.9) 11 (14.1)
When purchasing food, whether nutrition labeling affects food choice < 0.001
Do not consider nutrition 168 (42.9) 22 (21.4) 96 (45.9) 50 (62.5)
Consider nutrition 224 (57.1) 81 (78.6) 113 (54.1) 30 (37.5)
Types of nutrients considered when purchasing food (among those who consider nutrition, n = 224) 0.201
Energy 93 (41.5) 38 (46.9) 44 (38.9) 11 (36.7)
Carbohydrates 42 (18.8) 9 (11.1) 24 (21.2) 9 (30.0)
Sugars 28 (12.5) 7 (8.6) 16 (14.2) 5 (16.6)
Protein 28 (12.5) 12 (14.8) 15 (13.3) 1 (3.3)
Fat 21 (9.4) 8 (9.9) 11 (9.7) 2 (6.7)
Sodium 12 (5.3) 7 (8.7) 3 (2.7) 2 (6.7)
Values are presented as number (%).
1)2)The response “I do not buy it myself” has been removed from the responses to the prompts “Source of food for meals” and “Source of snacks.”
3)The χ2 test was used to test differences across groups for categorical variables.

Differences in food literacy and NQ characteristics among food-related lifestyle groups

Table 6 presents the results from the ANOVA examining the differences in food literacy and NQ scores among the food-related lifestyle clusters. Based on the calculation of weights for each food literacy domain and item, total scores of 62 or higher were classified as “High,” 51 to 61 as “Medium-High,” 41 to 50 as “Medium-Low”, and below 41 as “Low” [142526]. Cluster 1 scored 72.59, which falls into the “High” category. Cluster 2 scored 54.15, a “Medium-High” rating. Cluster 3 scored 38.07, falling into the “Low” category. Consistent with these results, based on the weights assigned for each NQ domain and item, total scores of 58.6 or higher were evaluated as “High,” those from 44.0 to 58.5 were evaluated as “Medium,” and those below 44.0 were evaluated as “Low” [18]. Cluster 1 scored 59.52, which falls into the “High” category. Cluster 2 scored 47.59, a “Medium” rating. Finally, Cluster 3 scored 39.89, falling into the “Low” category. The post-hoc analysis results for the overall scores and each domain indicated a significant difference among the three groups in scores for food literacy and NQ (P < 0.001), but not for “Moderation” (P > 0.05).
Table 6

Differences in food literacy and nutrition quotient characteristics among food-related lifestyle groups

nrp-18-687-i006
Variables Mean ± SD Cluster 1 Cluster 2 Cluster 3 P-value1)
High-interest in food group (n = 103) Moderate-interest in food group (n = 209) Low-interest in food group (n = 80)
Total food literacy 55.57 ± 18.85 72.59 ± 14.44a 54.15 ± 13.35b 38.07 ± 18.09c < 0.001
Production 37.72 ± 26.73 57.92 ± 24.10a 35.50 ± 22.93b 17.50 ± 21.03c < 0.001
Distribution 50.27 ± 25.69 66.16 ± 24.19a 49.46 ± 20.97b 31.94 ± 26.12c < 0.001
Selection 65.77 ± 20.53 79.89 ± 14.78a 64.91 ± 16.09b 49.81 ± 24.56c < 0.001
Cooking 65.45 ± 21.83 79.78 ± 17.61a 64.06 ± 16.71b 50.61 ± 26.98c < 0.001
Intake 59.70 ± 23.80 79.89 ± 15.72a 56.91 ± 19.50b 41.01 ± 24.01c < 0.001
Total nutrition quotient 49.15 ± 13.34 59.52 ± 12.38a 47.59 ± 11.24b 39.89 ± 10.80c < 0.001
Balance 59.57 ± 15.78 63.64 ± 15.95a 57.90 ± 14.22b 48.90 ± 15.75c < 0.001
Moderation 46.91 ± 12.98 49.04 ± 13.48 45.70 ± 12.72 47.33 ± 12.76 0.096
Practice 48.08 ± 20.48 64.12 ± 18.99a 45.80 ± 17.16b 33.37 ± 16.31c < 0.001
a,b,cDifferent superscripts indicate significant differences (P < 0.001) by Tukey’s method.
1)Analysis of variance was used to test differences across groups for continuous variables.

DISCUSSION

This study analyzed food-related media use, food consumption behavior, food literacy, and NQ across different food-related lifestyle clusters in an adolescent population. Adolescents are more susceptible to the influence of media than adults [33]. Moreover, adolescence is a period of significant mental and physical changes, creating the foundation for lifelong health-related habits; dietary behaviors during adolescence play a crucial role in determining dietary habits and health status in adulthood [10]. It is thus essential to analyze adolescents’ dietary habits, food literacy, and NQ, and develop tailored nutritional education programs for them.
The high-interest in food group scored high in all Health-seeking and Safety-seeking factors. This could presumably be attributed to increased awareness and interest in healthy eating habits, especially following the COVID-19 pandemic. Research has shown that the pandemic has led individuals, particularly the younger generation, to prioritize their health and well-being, influencing choices and dietary preferences [34353637]. Adolescents displaying high interest in their dietary habits reported that the influence of food-related media consumption on their eating behaviors was positive. The high-interest in food group pays attention to nutrition labeling when making food choices and exhibits high scores in both food literacy and NQ. This indicates a correlation between a lifestyle characterized by a high interest in dietary habits and the beneficial impact of food media consumption. These findings suggest that implementing nutrition education programs utilizing media consumption could be beneficial for fostering a healthy dietary lifestyle in adolescents within this group.
In contrast, adolescents with low interest in their dietary habits were adversely affected by media consumption in relation to their eating behaviors. This group demonstrated less consideration of nutrition labeling when making food purchases, and they scored lower in both food literacy and NQ. These findings suggest that adolescents with low interest in their dietary habits lack awareness of nutritional information, and their media consumption negatively influences their actual eating habits. Therefore, to foster healthy dietary habits among this group, a primary focus should be placed on enhancing food literacy. These findings suggest that emphasizing nutrition education with a focus on enhancing food literacy is an effective strategy for adolescents with low interest in their dietary habits to develop healthy eating patterns.
One noteworthy finding is that 76.5% of the adolescents who participated exhibited a high level of experience in consuming food-related media. However, when examining their level of interest in food, it became apparent that adolescents with a high interest demonstrated higher food literacy, while those with lower interest showed lower levels of food literacy. This trend was also reflected in the NQ scores, which are indicative of nutrition-related habits. In essence, high consumption of food-related media itself does not necessarily have negative implications [38]. The key takeaway is the importance of focusing on enhancing adolescents' food literacy. In particular, leveraging media for nutritional education after improving adolescents’ understanding of food appears to be a beneficial approach, given the high prevalence of food-related media consumption among adolescents.
Food literacy is essential to healthy dietary habits and lifestyle. Considered a foundational element for individual health, food literacy involves conscious dietary competence that takes into account both personal well-being and societal and environmental considerations [39]. Through food literacy, individuals not only develop the capacity to make informed and wise food choices but also engage in positive interactions with food from various perspectives, contributing to the foundation for a sustainable society [40].
The average food literacy score was 55.57 points, with “Production” scoring the lowest at 37.72 points, aligning with the findings of previous research [142526]. “Production” is the process of cultivating, raising, and harvesting agricultural, livestock, and fisheries products and processing and packaging them into marketable goods. To enhance scores in this domain, education could elevate adolescents’ understanding of food production and processing. Effective educational methods for this purpose include experiential learning through field trips, lectures, and workshops, allowing adolescents to gain insights into the food production process. Moreover, providing education on sustainable production methods and innovative processing technologies can contribute significantly to meeting sustainability goals. Integrating such educational approaches can boost adolescents’ scores in the “Production” domain, but can also, and more importantly, foster a deeper understanding of sustainable food practices and innovative processing techniques.
The “Moderation” domain within NQ did not show significant differences among clusters and received low scores. The average moderation score for the participants in this study was 46.91 ± 12.98, which was lower than the mean score of 55.67 ± 0.39 suggested by the NQ guidelines [18]. “Moderation” encompasses nine items, including the frequency of consuming sweets, greasy snacks, instant noodles, spicy and salty soup and stew, caffeinated beverages, overeating, street foods from convenience stores, fast-food restaurants, or other snack shops, as well as the frequency of using smartphones, playing computer games, watching TV, and reading books while eating. This suggests that, during the teenage years more than other life stages, people display a lower interest in health and dietary habits. They face challenges related to undesirable dietary patterns such as irregular eating habits and frequent dining out, often influenced by academic stress [41]. Consequently, there is a need for interventions in the form of nutrition education, with a focus on moderating the consumption of unhealthy foods, either within schools or families. Strengthening the moderation aspect of dietary practices is likely to contribute to adolescents developing healthier eating habits.
The impact of adolescents’ media use on their dietary habits has emerged as a global issue; however, previous research regarding the relationship between media use and dietary habits has primarily focused on proposing general media regulation [42]. Significantly, the current study is pioneering in its holistic exploration of the interplay among media, food literacy, and nutritional habits. It is particularly noteworthy as it complements previous studies by adopting a lifestyle approach to scrutinize the correlation between adolescents’ food-related media use and their dietary habits. Furthermore, by conducting a comprehensive analysis of adolescents’ lifestyles in terms of their food-related media use, food consumption behaviors, food literacy, and NQ, our results revealed the overall characteristics of different clusters of adolescents in terms of their media use and dietary habits. Based on the characteristics of each cluster, the study provides essential data for the promotion of healthy eating habits among adolescents and the development of targeted nutrition education programs in homes and schools. By identifying ways to prevent adolescents from developing unhealthy dietary habits that can cause chronic diseases, this study may also contribute significantly to reductions in socioeconomic costs.
Despite these significant contributions, this study had several limitations. First, data was collected through a self-administered online survey; such surveys are often less accurate than face-to-face interviews, and biases related to self-reporting could have affected the reliability of the data. Second, the sample selection relied on voluntary responses, resulting in another potential bias. Third, the cross-sectional nature of the study design limited the establishment of causal relationships between variables. Finally, this study was limited to students enrolled in high schools located in the metropolitan area, and no significant differences were observed by clusters in demographic factors such as sex or grade level. However, significant differences were found among the groups in terms of food-related media usage, dietary behaviors, food literacy scores, and nutritional indices. Thus, future research should seek to survey larger areas, use larger sample sizes, and consider a variety of countries with high accessibility to food-related media.

Notes

Conflict of Interest: The authors declare no potential conflicts of interest.

Author Contributions:

  • Conceptualization: Lee S, Choi S, Ahn SE, Oh J.

  • Formal analysis: Lee S, Oh J.

  • Investigation: Lee S, Choi S, Oh J.

  • Methodology: Lee S, Choi S, Ahn SE, Oh J.

  • Supervision: Park YJ.

  • Validation: Lee S, Oh JE.

  • Writing - original draft: Lee S, Oh J.

  • Writing - review & editing: Lee S, Choi S, Ahn SE, Park YJ, Hwang JY, Yeo G, Oh J.

References

1. Strand M, Gustafsson SA. Mukbang and disordered eating: a netnographic analysis of online eating broadcasts. Cult Med Psychiatry. 2020; 44:586–609. PMID: 32277331.
2. Kim H. A study on food porn as a sub-culture-Centering on internet “Meokbang” (eating scene) in Afreeca TV. Humanit Rep. 2015; 50:433–455.
3. Anjani L, Mok T, Tang A, Oehlberg L, Goh WB. Why do people watch others eat food? An empirical study on the motivations and practices of mukbang viewers. In : Proceedings of the 2020 CHI conference on Human Factors in Computing Systems; April 25-30, 2020; Honolulu, HI, USA. New York (NY): Association for Computing Machinery;2020. p. 1–13.
4. Kang E, Lee J, Kim KH, Yun YH. The popularity of eating broadcast: Content analysis of “mukbang” YouTube videos, media coverage, and the health impact of “mukbang” on public. Health Informatics J. 2020; 26:2237–2248. PMID: 31992111.
5. World Health Organization. Obesity: Preventing and Managing the Global Epidemic: Report of a WHO Consultation. 2000. p. 13–245.
6. World Obesity Federation. Economic impact of overweight and obesity to surpass $4 trillion by 2035 [Internet]. London: World Obesity Federation;2023. cited 2024 May 6. Available from: https://www.worldobesity.org/news/economic-impact-of-overweight-and-obesity-to-surpass-4-trillion-by-2035.
7. Korea Disease Control and Prevention Agency. Press References; Over the past decade, there has been an increase in the prevalence of obesity among both adults and middle/high school students [Internet]. Cheongju: Korea Disease Control and Prevention Agency;2023. cited 2024 May 6. Available from: https://www.kdca.go.kr/board/board.es?mid=a20501010000&bid=0015&act=view&list_no=722017.
8. Ministry of Health and Welfare. Comprehensive Plan for Obesity Prevention and Control (2018–2022). Sejong: Ministry of Health and Welfare;2018. p. 10.
9. Guo SS, Chumlea WC. Tracking of body mass index in children in relation to overweight in adulthood. Am J Clin Nutr. 1999; 70:145S–148S.
10. Sawyer SM, Azzopardi PS, Wickremarathne D, Patton GC. The age of adolescence. Lancet Child Adolesc Health. 2018; 2:223–228. PMID: 30169257.
11. Taymoori P, Berry TR, Lubans DR. Tracking of physical activity during middle school transition in Iranian adolescents. Health Educ J. 2012; 71:631–641.
12. Hamulka J, Wadolowska L, Hoffmann M, Kowalkowska J, Gutkowska K. Effect of an education program on nutrition knowledge, attitudes toward nutrition, diet quality, lifestyle, and body composition in Polish teenagers. The ABC of healthy eating project: design, protocol, and methodology. Nutrients. 2018; 10:1439. PMID: 30720795.
13. Daly AN, O’Sullivan EJ, Kearney JM. Considerations for health and food choice in adolescents. Proc Nutr Soc. 2022; 81:75–86. PMID: 35039094.
14. Park D, Park YK, Park CY, Choi MK, Shin MJ. Development of a comprehensive food literacy measurement tool integrating the food system and sustainability. Nutrients. 2020; 12:3300. PMID: 33126558.
15. Vaitkeviciute R, Ball LE, Harris N. The relationship between food literacy and dietary intake in adolescents: a systematic review. Public Health Nutr. 2015; 18:649–658. PMID: 24844778.
16. Palumbo R. Sustainability of well-being through literacy. The effects of food literacy on sustainability of well-being. Agric Agric Sci Procedia. 2016; 8:99–106.
17. Pendergast D, Dewhurst Y. Home economics and food literacy: an international investigation. Int J Home Econ. 2012; 5:245–263.
18. Kim KN, Hwang HJ, Lim YS, Hwang JY, Kwon S, Lee JS, Kim HY. Revision of Nutrition Quotient for Korean adolescents 2021 (NQ-A 2021). J Nutr. 2023; 56:247–263.
19. Jung Y, Min S, Lee M. Study on the dietary behavior of adolescents in multicultural families using the nutrition quotient and their changes in the nutrition knowledge and the dietary attitudes after nutrition education. J East Asian Soc Diet Life. 2020; 30:208–218.
20. Park H, Ryu H. The relationship between lifestyle and Nutrition Quotient in middle school students. Korean J Community Living Sci. 2021; 32:243–255.
21. World Health Organization. BMI-for-age (5–19 years). 2007. cited 2024 May 6. Available from: https://www.who.int/tools/growth-reference-data-for-5to19-years/indicators/bmi-for-age.
22. Yun S, Kang H, Lee H. Mukbang- and Cookbang-watching status and dietary life of university students who are not food and nutrition majors. Nutr Res Pract. 2020; 14:276–285. PMID: 32528634.
23. Kang H, Yun S, Lee H. Dietary life and mukbang-and cookbang-watching status of university students majoring in food and nutrition before and after COVID-19 outbreak. J Nutr Health. 2021; 54:104–115.
24. You SM, Ahn SE, Oh HI, Oh JE, Oh JE. Effect of food-related lifestyle on beverage selection attributes of adolescents. J Korean Soc Food Sci Nutr. 2018; 47:649–656.
25. Park D, Choi MK, Park YK, Park CY, Shin MJ. Higher food literacy scores are associated with healthier diet quality in children and adolescents: the development and validation of a two-dimensional food literacy measurement tool for children and adolescents. Nutr Res Pract. 2022; 16:272–283. PMID: 35392524.
26. So H, Park D, Choi MK, Kim YS, Shin MJ, Park YK. Development and validation of a food literacy assessment tool for community-dwelling elderly people. Int J Environ Res Public Health. 2021; 18:4979. PMID: 34067139.
27. Kaiser HF. A second generation little jiff. Psychometrika. 1970; 35:401–415.
28. Kaiser HF. The varimax criterion for analytic rotation in factor analysis. Psychometrika. 1958; 23:187–200.
29. Williams B, Onsman A, Brown T. Exploratory factor analysis: a five-step guide for novices. Australas J Paramed. 2010; 8:1–13.
30. Hendricks C, Murdaugh C, Pender N. The Adolescent Lifestyle Profile: development and psychometric characteristics. J Natl Black Nurses Assoc. 2006; 17:1–5.
31. Dodd LJ, Al-Nakeeb Y, Nevill A, Forshaw MJ. Lifestyle risk factors of students: a cluster analytical approach. Prev Med. 2010; 51:73–77. PMID: 20385163.
32. Bennasar-Veny M, Yañez AM, Pericas J, Ballester L, Fernandez-Dominguez JC, Tauler P, Aguilo A. Cluster analysis of health-related lifestyles in university students. Int J Environ Res Public Health. 2020; 17:1776. PMID: 32182922.
33. Villani S. Impact of media on children and adolescents: a 10-year review of the research. J Am Acad Child Adolesc Psychiatry. 2001; 40:392–401. PMID: 11314564.
34. Eftimov T, Popovski G, Petković M, Seljak BK, Kocev D. COVID-19 pandemic changes the food consumption patterns. Trends Food Sci Technol. 2020; 104:268–272. PMID: 32905099.
35. Faour-Klingbeil D, Osaili TM, Al-Nabulsi AA, Jemni M, Todd EC. An on-line survey of the behavioral changes in Lebanon, Jordan and Tunisia during the COVID-19 pandemic related to food shopping, food handling, and hygienic practices. Food Control. 2021; 125:107934. PMID: 33564215.
36. Filimonau V, Vi LH, Beer S, Ermolaev VA. The Covid-19 pandemic and food consumption at home and away: an exploratory study of English households. Socioecon Plann Sci. 2022; 82:101125. PMID: 35721386.
37. Güney OI, Sangün L. How COVID-19 affects individuals’ food consumption behaviour: a consumer survey on attitudes and habits in Turkey. Br Food J. 2021; 123:2307–2320.
38. Steils N, Obaidalahe Z. “Social food”: food literacy co-construction and distortion on social media. Food Policy. 2020; 95:101932.
39. Thomas H, Azevedo Perry E, Slack J, Samra HR, Manowiec E, Petermann L, Manafò E, Kirkpatrick SI. Complexities in conceptualizing and measuring food literacy. J Acad Nutr Diet. 2019; 119:563–573. PMID: 30670348.
40. Slater J, Falkenberg T, Rutherford J, Colatruglio S. Food literacy competencies: a conceptual framework for youth transitioning to adulthood. Int J Consum Stud. 2018; 42:547–556.
41. Kim Y, Yang HY, Kim AJ, Lim Y. Academic stress levels were positively associated with sweet food consumption among Korean high-school students. Nutrition. 2013; 29:213–218. PMID: 23237650.
42. Strasburger VC. Communications Co, Media. Children, Adolescents, Obesity, and the Media. Elk Grove Village (IL): American Academy of Pediatrics;2011. p. 201–208.
TOOLS
Similar articles