Journal List > Nutr Res Pract > v.18(5) > 1516088434

Kim, Park, and Yang: Comparison of food and nutrient intake according to the presence of glaucoma among Korean older adults

Abstract

BACKGROUND/OBJECTIVES

The purpose of this study was to compare nutrient intake according to the presence of glaucoma among Korean individuals aged 60 yrs or older and to establish evidence for the necessity of dietary habits and nutritional management in the prevention and management of glaucoma.

SUBJECTS/METHODS

The study was conducted on 4,195 older adults aged 60 or older who participated in the Korea National Health and Nutrition Examination Survey in 2017 and 2018. The subjects were classified into glaucoma (n = 186) and non-glaucoma (n = 4,009) groups based on the doctor’s diagnosis of glaucoma. Nutrient intake was estimated using a 24-h recall method, and the intake of nutrients between the 2 groups was compared.

RESULTS

The comparison of food group and nutrient intake according to the subjects’ prevalence of glaucoma showed that the average intake of potatoes and starches was higher in the glaucoma group than in the non-glaucoma group (P = 0.049), whereas the average intake of meat, fish, and shellfish was higher in the non-glaucoma group than in the glaucoma group (P = 0.045, P = 0.018). Additionally, the average intake of omega-3 and vitamin C was higher in the non-glaucoma group than in the glaucoma group (P = 0.022, P = 0.045), while the average intake of niacin was higher in the glaucoma group than in the non-glaucoma group (P = 0.046).

CONCLUSION

The intake of meats, fish, and shellfish, omega-3, and vitamin C was higher in the non-glaucoma group than in the glaucoma group. These results suggest that a healthy diet might be necessary for the prevention and management of glaucoma.

INTRODUCTION

Glaucoma is known as one of the 3 major causes of blindness, along with age-related macular degeneration and diabetic retinopathy. In early stages of its development, patients rarely experience noticeable symptoms, leading to significant advancement of the disease by the time they visit a hospital [1]. As such, eye diseases associated with vision loss do not allow for the recovery of damaged optic nerves [2]. They can severely diminish a patient’s quality of life, including physical limitations. Therefore, the importance of early diagnosis and treatment should be emphasized. Currently, the elderly accounts for 18.4% of the Korean population [3]. The number of patients with severe ophthalmic diseases such as glaucoma is increasing as the aging population accelerates. The socio-economic burden is also increasing, making ophthalmic diseases a major health problem [2].
Glaucoma is a disease in which visual field defects occur due to abnormalities in the optic nerve that transmits light received by the eyes to the brain and is defined as progressive optic neuropathy. It is a serious eye disease that eventually leads to blindness if left untreated and undetected at an appropriate time [4]. According to previous studies, the prevalence of glaucoma among adults aged 30 or older in Korea was 0.2% [5], and the number of people with glaucoma is expected to increase steadily as the population ages rapidly [6]. Glaucoma is sometimes caused by aging [7], but aging is not the only cause of glaucoma. It is also known to be caused by various factors such as family history, myopia, high blood pressure, diabetes, smoking, eye pressure, and diet [8]. Recently, studies have emphasized the importance of nutrient intake in suppressing the progression and onset of glaucoma [9], and it has been reported that the intake of certain antioxidant nutrients inhibits the progression of glaucoma [10].
Many studies have been conducted on health and behavioral factors related to glaucoma, but studies on the relationship between nutrient intake and glaucoma are insufficient [2]. In particular, there is a lack of research in Korea that reveals the relationship between eye diseases and nutrition, and previous studies that have attempted analysis did not find significant differences between eating habits and eye diseases [11]. Therefore, this study was conducted to provide a basis for the need for diet and nutrition management in preventing and managing ophthalmic diseases, which have recently emerged as a major health problem, by comparing the food and nutrient intake of subjects according to the prevalence of glaucoma.

SUBJECTS AND METHODS

Research data and subjects

This study analyzed raw data from the Korea National Health and Nutrition Examination Survey (KNHANES) in 2017 and 2018. Out of the 16,119 individuals who participated in KNHANES during that period, 4,975 were older adults aged 60 or older. Among them, 4,195 responded to the glaucoma survey, and the final sample size was 4,195. Among the total subjects, 186 were diagnosed with glaucoma, while 4,009 were not diagnosed with glaucoma.

Ethics statement

The KNHANES is a legally mandated investigation conducted under Article 16 of the National Health Promotion Act. It was conducted with the approval of the Research Ethics Review Committee of the Korea Centers for Disease Control and Prevention. In 2017, it was conducted without deliberation by the Research Ethics Review Committee in accordance with the Bioethics Act. In 2018, it was approved by the Research Ethics Review Committee of the Korea Centers for Disease Control and Prevention (approval number 2018-01-03-P-A).

Health indicator

We used health examination survey data as health indicator data. Average values of systolic and diastolic blood pressure, fasting blood glucose, hemoglobin A1c (HbA1c), total cholesterol, high density lipoprotein (HDL) cholesterol, triglyceride, and high-sensitivity C-reactive protein (hs-CRP) were compared between the 2 groups. The prevalence of diabetes and hypertension was compared between the glaucoma group and the non-glaucoma group, based on physician diagnosis.

Food intake

Food intake was analyzed using nutrition survey data. Food group intake was evaluated using the 24-h recall method, and the average amounts of cereals, potatoes and starches, sugar and sweeteners, pulses, nuts and seeds, vegetables, fungi and mushrooms, fruits, seaweeds, seasonings, vegetable oil, meats, eggs, fish and shellfish, milks, animal fat, beverages, and alcohol intake were compared between the glaucoma group and non-glaucoma group.

Nutrient intake

Nutrient intake was analyzed using nutrition survey data. Nutrient intake was evaluated using a 24-h recall method, and the average amounts of energy, protein, fat, saturated fatty acids, monounsaturated fatty acids, polyunsaturated fatty acids, n-3 fatty acids, n-6 fatty acids, carbohydrates, cholesterol, and dietary fiber intake were compared between the glaucoma group and non-glaucoma group.

Mineral and vitamin intake

Vitamin and mineral intake were evaluated using a 24-h recall, and the average amounts of vitamin A, beta-carotene, retinol, thiamine, riboflavin, niacin, vitamin C, vitamin D, vitamin E, calcium, phosphorus, iron, sodium, potassium, magnesium, and zinc intake were compared between the glaucoma group and non-glaucoma group.

Nutrient adequacy ratio (NAR)

The NAR is a value obtained by dividing the daily intake of nutrients by the recommended nutrient intake (RNI) of those nutrients [12]. The daily intake of each nutrient was evaluated using a 24-h recall. The NAR was assessed for 12 nutrients for which the RNI was set. These 12 nutrients are carbohydrate, protein, vitamin A, thiamine, riboflavin, niacin, vitamin C, calcium, phosphorus, magnesium, iron, and zinc.

Statistical analysis

Since the KNHANES data was obtained using the complex sample design method, statistical analysis was conducted by considering the complex sample elements such as kstrata, cluster, and weight. The statistical analysis was performed using SAS statistical analysis software (Version 9.4; SAS Institute Inc., Cary, NC, USA). Categorical variables were analyzed using the Rao-Scott χ2 test and presented as frequencies and percentages, while continuous variables were analyzed using the t-test and presented as mean ± SE. The statistical significance level was set at P < 0.05.

RESULTS

General characteristics

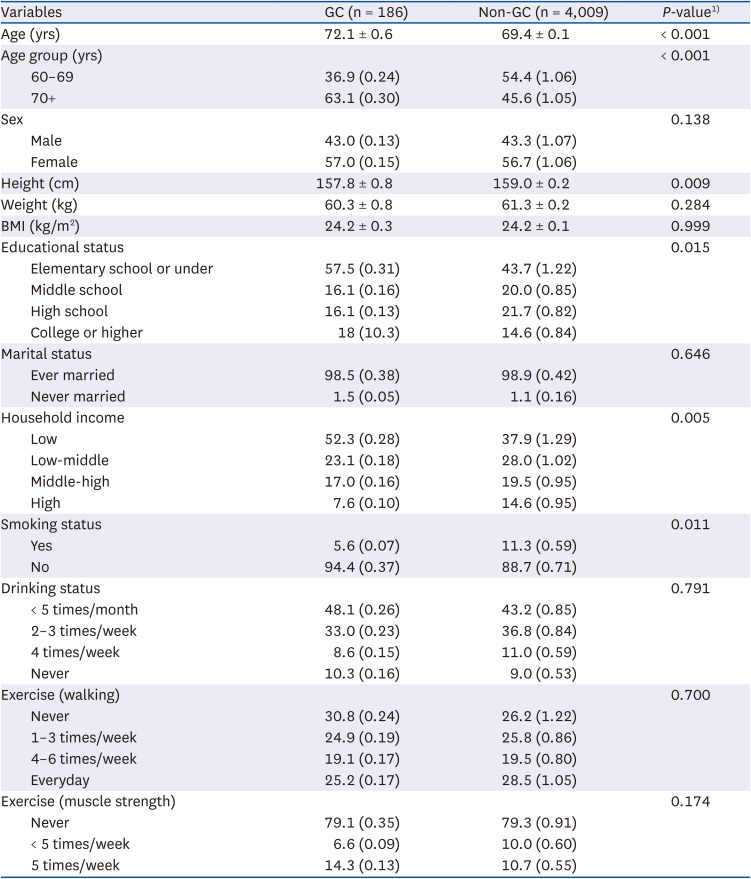
Table 1 shows the results of comparing the general characteristics of the glaucoma group and the non-glaucoma group. The average age of the glaucoma group was 72.1 ± 0.6 yrs old, and the average age of the non-glaucoma group was 69.4 ± 0.1 yrs old. The age of the glaucoma group was significantly higher than that of the non-glaucoma group (P < 0.001). The glaucoma group had lower levels of education (P = 0.015), income (P = 0.005), and smoking rates (P = 0.011) compared to the non-glaucoma group.
Table 1

General characteristics of study subjects according to the prevalence of glaucoma

nrp-18-701-i001
Variables GC (n = 186) Non-GC (n = 4,009) P-value1)
Age (yrs) 72.1 ± 0.6 69.4 ± 0.1 < 0.001
Age group (yrs) < 0.001
60–69 36.9 (0.24) 54.4 (1.06)
70+ 63.1 (0.30) 45.6 (1.05)
Sex 0.138
Male  43.0 (0.13) 43.3 (1.07)
Female 57.0 (0.15) 56.7 (1.06)
Height (cm) 157.8 ± 0.8 159.0 ± 0.2 0.009
Weight (kg) 60.3 ± 0.8 61.3 ± 0.2 0.284
BMI (kg/m2) 24.2 ± 0.3 24.2 ± 0.1 0.999
Educational status 0.015
Elementary school or under 57.5 (0.31) 43.7 (1.22)
Middle school 16.1 (0.16) 20.0 (0.85)
High school 16.1 (0.13) 21.7 (0.82)
College or higher 18 (10.3) 14.6 (0.84)
Marital status 0.646
Ever married 98.5 (0.38) 98.9 (0.42)
Never married 1.5 (0.05) 1.1 (0.16)
Household income 0.005
Low 52.3 (0.28) 37.9 (1.29)
Low-middle 23.1 (0.18) 28.0 (1.02)
Middle-high 17.0 (0.16) 19.5 (0.95)
High 7.6 (0.10) 14.6 (0.95)
Smoking status 0.011
Yes 5.6 (0.07) 11.3 (0.59)
No 94.4 (0.37) 88.7 (0.71)
Drinking status 0.791
< 5 times/month 48.1 (0.26) 43.2 (0.85)
2–3 times/week 33.0 (0.23) 36.8 (0.84)
4 times/week 8.6 (0.15) 11.0 (0.59)
Never 10.3 (0.16) 9.0 (0.53)
Exercise (walking) 0.700
Never 30.8 (0.24) 26.2 (1.22)
1–3 times/week 24.9 (0.19) 25.8 (0.86)
4–6 times/week 19.1 (0.17) 19.5 (0.80)
Everyday 25.2 (0.17) 28.5 (1.05)
Exercise (muscle strength) 0.174
Never 79.1 (0.35) 79.3 (0.91)
< 5 times/week 6.6 (0.09) 10.0 (0.60)
5 times/week 14.3 (0.13) 10.7 (0.55)
The data were analyzed using the complex sample module.
Values are presented as mean ± SE or weighted % (SE).
GC, glaucoma; Non-GC, non-glaucoma; BMI, body mass index.
1)P-values from t-test for continuous variables and P-values from Rao-Scott χ2 test for categorical variables.

Health indicators

Table 2 shows the results of comparing the health indicators of the glaucoma group and the non-glaucoma group. There was no significant difference in systolic blood pressure between the 2 groups, while diastolic blood pressure was significantly higher in the non-glaucoma group (P = 0.001). Additionally, there were no significant differences in the levels of fasting blood sugar, HbA1c, total cholesterol, HDL cholesterol, triglycerides, and hs-CRP.
Table 2

Health indicators of study subjects according to the prevalence of glaucoma

nrp-18-701-i002
Variables GC (n = 186) Non-GC (n = 4,009) P-value1)
Systolic blood pressure (mmHg) 127.6 ± 1.5 127.1 ± 0.4 0.749
Diastolic blood pressure (mmHg) 70.9 ± 0.8 73.9 ± 0.2 0.001
Fasting blood glucose (mg/d) 106.3 ± 1.8 107.8 ± 0.5 0.476
HbA1c (%) 6.1 ± 0.1 6.0 ± 0.0 0.464
Total cholesterol (mg/d) 182.7 ± 3.9 187.4 ± 0.8 0.226
HDL cholesterol (mg/d) 47.4 ± 0.9 48.5 ± 0.2 0.198
Triglyceride (mg/d) 134.4 ± 0.7 136.6 ± 0.2 0.760
hs-CRP (mg/L) 1.1 ± 0.2 1.3 ± 0.0 0.246
The data were analyzed using the complex sample module.
Values are presented as mean ± SE.
GC, glaucoma; Non-GC, non-glaucoma; HbA1c, hemoglobin A1c; HDL, high density lipoprotein; hs-CRP, high-sensitivity C-reactive protein.
1)P-value from t-test.

Prevalence of diabetes and hypertension

Table 3 shows the results of comparing the prevalence of diabetes mellitus and hypertension in the glaucoma group and the non-glaucoma group. The prevalence of hypertension in the glaucoma group was significantly higher than that in the non-glaucoma group (P = 0.031). In terms of diabetes mellitus, there was no statistically significant difference between the 2 groups.
Table 3

Prevalence of glaucoma according to diabetes mellitus and hypertension

nrp-18-701-i003
Variables GC (n = 186) Non-GC (n = 4,009) P-value1)
DM 0.949
Yes 19.8 (0.16) 19.6 (0.77)
No 80.2 (0.35) 80.4 (0.83)
HTN 0.031
Yes 58.3 (0.29) 49.3 (0.98)
No 41.7 (0.24) 50.7 (0.95)
The data were analyzed using the complex sample module.
Values are presented as weighted % (SE).
GC, glaucoma; Non-GC, non-glaucoma; DM, diabetes mellitus; HTN, hypertension.
1)P-value from Rao-Scott χ2 test.

Food group intake

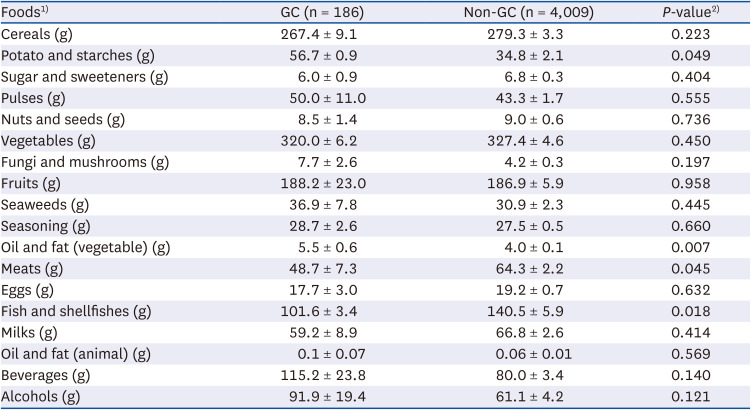
Table 4 shows the results of comparing the intake of food groups between the glaucoma group and the non-glaucoma group. The intake of potatoes and starch was significantly higher in the glaucoma group than in the non-glaucoma group (P = 0.049), and the intake of vegetable oil and fats was significantly higher in the glaucoma group than in the non-glaucoma group (P = 0.007). On the other hand, the intake of meats was significantly higher in the non-glaucoma group than in the glaucoma group (P = 0.045), and the intake of fish and shellfish was significantly higher in the non-glaucoma group than in the glaucoma group (P = 0.018).
Table 4

Daily food group intake of study subjects according to the prevalence of glaucoma

nrp-18-701-i004
Foods1) GC (n = 186) Non-GC (n = 4,009) P-value2)
Cereals (g) 267.4 ± 9.1 279.3 ± 3.3 0.223
Potato and starches (g) 56.7 ± 0.9 34.8 ± 2.1 0.049
Sugar and sweeteners (g) 6.0 ± 0.9 6.8 ± 0.3 0.404
Pulses (g) 50.0 ± 11.0 43.3 ± 1.7 0.555
Nuts and seeds (g) 8.5 ± 1.4 9.0 ± 0.6 0.736
Vegetables (g) 320.0 ± 6.2 327.4 ± 4.6 0.450
Fungi and mushrooms (g) 7.7 ± 2.6 4.2 ± 0.3 0.197
Fruits (g) 188.2 ± 23.0 186.9 ± 5.9 0.958
Seaweeds (g) 36.9 ± 7.8 30.9 ± 2.3 0.445
Seasoning (g) 28.7 ± 2.6 27.5 ± 0.5 0.660
Oil and fat (vegetable) (g) 5.5 ± 0.6 4.0 ± 0.1 0.007
Meats (g) 48.7 ± 7.3 64.3 ± 2.2 0.045
Eggs (g) 17.7 ± 3.0 19.2 ± 0.7 0.632
Fish and shellfishes (g) 101.6 ± 3.4 140.5 ± 5.9 0.018
Milks (g) 59.2 ± 8.9 66.8 ± 2.6 0.414
Oil and fat (animal) (g) 0.1 ± 0.07 0.06 ± 0.01 0.569
Beverages (g) 115.2 ± 23.8 80.0 ± 3.4 0.140
Alcohols (g) 91.9 ± 19.4 61.1 ± 4.2 0.121
The data were analyzed using the complex sample module.
Values are presented as mean ± SE.
GC, glaucoma; Non-GC, non-glaucoma.
1)Adjusted for age, sex, educational status, household income, smoking status, drinking, exercise (walking, muscle strength).
2)P-value from t-test.

Energy and nutrient intake

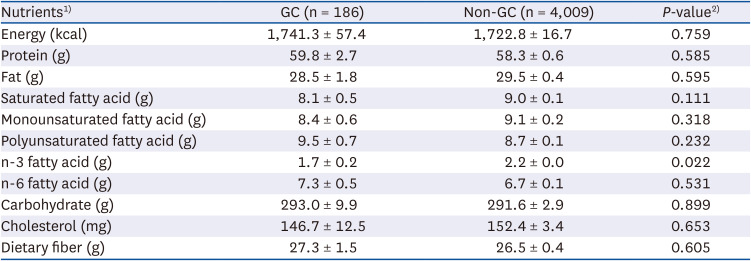
Table 5 shows the results of comparing the energy and nutrient intake of glaucoma group and non-glaucoma group. The intake of omega-3 fatty acids was significantly higher in the non-glaucoma group than in the glaucoma group (P = 0.022). There was no statistically significant difference in the intakes of energy, protein, fat, saturated fatty acid, monounsaturated fatty acid, polyunsaturated fatty acid, n-6 fatty acid, carbohydrate, cholesterol, dietary fiber according to the prevalence of glaucoma.
Table 5

Daily energy and nutrient intake of study subjects according to the prevalence of glaucoma

nrp-18-701-i005
Nutrients1) GC (n = 186) Non-GC (n = 4,009) P-value2)
Energy (kcal) 1,741.3 ± 57.4 1,722.8 ± 16.7 0.759
Protein (g) 59.8 ± 2.7 58.3 ± 0.6 0.585
Fat (g) 28.5 ± 1.8 29.5 ± 0.4 0.595
Saturated fatty acid (g) 8.1 ± 0.5 9.0 ± 0.1 0.111
Monounsaturated fatty acid (g) 8.4 ± 0.6 9.1 ± 0.2 0.318
Polyunsaturated fatty acid (g) 9.5 ± 0.7 8.7 ± 0.1 0.232
n-3 fatty acid (g) 1.7 ± 0.2 2.2 ± 0.0 0.022
n-6 fatty acid (g) 7.3 ± 0.5 6.7 ± 0.1 0.531
Carbohydrate (g) 293.0 ± 9.9 291.6 ± 2.9 0.899
Cholesterol (mg) 146.7 ± 12.5 152.4 ± 3.4 0.653
Dietary fiber (g) 27.3 ± 1.5 26.5 ± 0.4 0.605
The data were analyzed using the complex sample module.
Values are presented as mean ± SE.
GC, glaucoma; Non-GC, non-glaucoma.
1)Adjusted for age, sex, educational status, household income, smoking status, drinking, exercise (walking, muscle strength).
2)P-value from t-test.

Vitamin and mineral intake

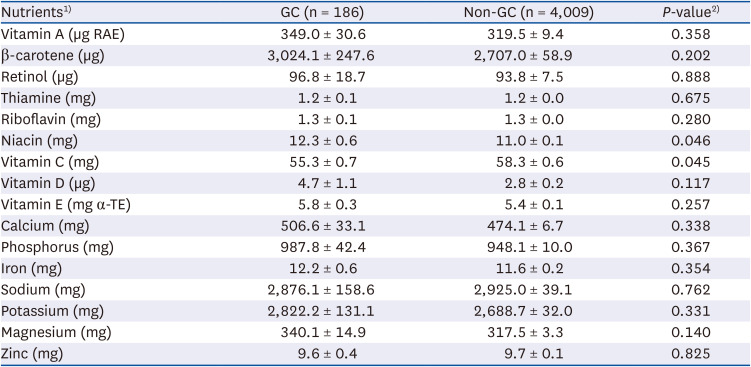
Table 6 shows the results of comparing the vitamin and mineral intake of glaucoma group and non-glaucoma group. Niacin intake was significantly higher in glaucoma group than in non-glaucoma group (P = 0.046), and vitamin C intake was significantly higher in non-glaucoma group than in glaucoma group (P = 0.045). There was no statistically significant difference in the intake of various minerals according to the prevalence of glaucoma.
Table 6

Daily vitamin and mineral intake of study subjects according to the prevalence of glaucoma

nrp-18-701-i006
Nutrients1) GC (n = 186) Non-GC (n = 4,009) P-value2)
Vitamin A (µg RAE) 349.0 ± 30.6 319.5 ± 9.4 0.358
β-carotene (µg) 3,024.1 ± 247.6 2,707.0 ± 58.9 0.202
Retinol (µg) 96.8 ± 18.7 93.8 ± 7.5 0.888
Thiamine (mg) 1.2 ± 0.1 1.2 ± 0.0 0.675
Riboflavin (mg) 1.3 ± 0.1 1.3 ± 0.0 0.280
Niacin (mg) 12.3 ± 0.6 11.0 ± 0.1 0.046
Vitamin C (mg) 55.3 ± 0.7 58.3 ± 0.6 0.045
Vitamin D (µg) 4.7 ± 1.1 2.8 ± 0.2 0.117
Vitamin E (mg α-TE) 5.8 ± 0.3 5.4 ± 0.1 0.257
Calcium (mg) 506.6 ± 33.1 474.1 ± 6.7 0.338
Phosphorus (mg) 987.8 ± 42.4 948.1 ± 10.0 0.367
Iron (mg) 12.2 ± 0.6 11.6 ± 0.2 0.354
Sodium (mg) 2,876.1 ± 158.6 2,925.0 ± 39.1 0.762
Potassium (mg) 2,822.2 ± 131.1 2,688.7 ± 32.0 0.331
Magnesium (mg) 340.1 ± 14.9 317.5 ± 3.3 0.140
Zinc (mg) 9.6 ± 0.4 9.7 ± 0.1 0.825
The data were analyzed using the complex sample module.
Values are presented as mean ± SE.
GC, glaucoma; Non-GC, non-glaucoma.
1)Adjusted for age, sex, educational status, household income, smoking status, drinking, exercise (walking, muscle strength).
2)P-value from t-test.

NAR

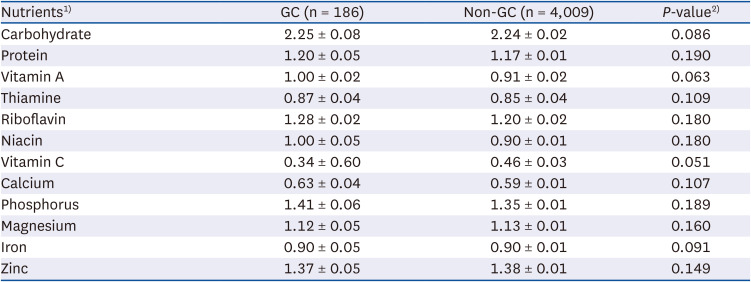
Table 7 shows the results of comparing the NAR of glaucoma group and non-glaucoma group. There was no statistically significant difference in NAR according to the prevalence of glaucoma. However, the P-value for the NAR according to the prevalence of glaucoma of vitamin C was 0.051, indicating a result close to 0.05.
Table 7

Nutrition adequacy ratio of study subjects according to the prevalence of glaucoma

nrp-18-701-i007
Nutrients1) GC (n = 186) Non-GC (n = 4,009) P-value2)
Carbohydrate 2.25 ± 0.08 2.24 ± 0.02 0.086
Protein 1.20 ± 0.05 1.17 ± 0.01 0.190
Vitamin A 1.00 ± 0.02 0.91 ± 0.02 0.063
Thiamine 0.87 ± 0.04 0.85 ± 0.04 0.109
Riboflavin 1.28 ± 0.02 1.20 ± 0.02 0.180
Niacin 1.00 ± 0.05 0.90 ± 0.01 0.180
Vitamin C 0.34 ± 0.60 0.46 ± 0.03 0.051
Calcium 0.63 ± 0.04 0.59 ± 0.01 0.107
Phosphorus 1.41 ± 0.06 1.35 ± 0.01 0.189
Magnesium 1.12 ± 0.05 1.13 ± 0.01 0.160
Iron 0.90 ± 0.05 0.90 ± 0.01 0.091
Zinc 1.37 ± 0.05 1.38 ± 0.01 0.149
The data were analyzed using the complex sample module.
Values are presented as mean ± SE.
GC, glaucoma; Non-GC, non-glaucoma.
1)Adjusted for age, sex, educational status, household income, smoking status, drinking, exercise (walking, muscle strength).
2)P-value from t-test.

DISCUSSION

Using data from KNHANES 2017 and 2018, this study attempted to lay the basis for the need for dietary habits and nutritional management to prevent and manage eye diseases by comparing nutrient intake according to the prevalence of glaucoma in Korean seniors aged 60 or older. As a result, 3 considerations could be made.
First, when comparing the vitamin C intake between the glaucoma group and the non-glaucoma group, it was found that the non-glaucoma group had a higher intake of vitamin C than the glaucoma group. Studies by Ramdas et al. [13] have reported a positive effect of vitamin C intake from the diet on glaucoma, and studies by Wang et al. [14] have also indicated that vitamin C intake can reduce the prevalence of glaucoma. Furthermore, studies conducted by Giaconi et al. [15] have supported the beneficial effect of vitamin C intake on glaucoma, suggesting that a higher consumption of vitamin C-rich foods such as vegetables and fruits may lower the risk of developing glaucoma. In this study, although the average vitamin C intake of the non-glaucoma group was higher than that of the glaucoma group, it was much lower than the recommended intake of 100 mg/day, and the difference between the 2 groups was also small. Therefore, it is necessary to investigate the correlation between vitamin C intake and glaucoma in a different study design.
Second, comparing niacin intake of glaucoma group and non-glaucoma group, the amount of niacin intake in the glaucoma group was higher than in the non-glaucoma group. According to previous studies on niacin and glaucoma, the higher the intake of niacin, the lower the likelihood of developing glaucoma [16]. Jung et al. [17] studies also reported that niacin intake was significantly lower in glaucoma patients. However, according to a study on the link between eye pressure and niacin intake, known as a major risk factor for glaucoma, the higher the niacin intake, the higher the eye pressure, and the possibility of glaucoma risk was indirectly increased [18]. Lee et al. [19] reported there was no significant link between the niacin intake. Currently, there is a lack of prior research on niacin intake and glaucoma, and inconsistent results have been shown, so further research on the relationship between niacin and glaucoma is necessary.
Third, comparing omega-3 fatty acid intake of glaucoma group and non-glaucoma group, the omega-3 fatty acid intake in the non-glaucoma group was higher than in the glaucoma group. The intake of omega-3 fatty acids has been reported to decrease intraocular pressure, reducing the risk of glaucoma [102021]. Nguyen et al. [22] reported that an increase in intraocular pressure was a strong factor in glaucoma progression and that the risk of glaucoma increases by 11% with every 1 mmHg increase. Experiments with mice supported the notion that omega-3 fatty acid intake helped reduce intraocular pressure. These experiments suggested that the intake of omega-3 fatty acids increased aqueous outflow and resulted in a decrease in intraocular pressure in mice [23]. Based on these findings, it is suggested that adequate intake of omega-3 fatty acids may reduce the risk of glaucoma in individuals aged 60 and above. Therefore, it is recommended for older adults to ensure sufficient consumption of omega-3 fatty acids.
Fourth, the glaucoma group had lower intake of meats, fish, and shellfish compared to the non-glaucoma group. Numerous studies have investigated the associations between glaucoma and specific food groups. However, a definitive correlation has not yet been established. Previous studies have suggested that a well-balanced diet rich in green vegetables can inhibit the development and progression of glaucoma [24]. Furthermore, the intake of fruits and vegetables that are rich in vitamins has been linked to a reduced risk of glaucoma [15]. Additionally, Kim [11] found that consuming blue-backed fish had a positive effect on glaucoma, which aligns with the findings of the present study. However, further research is needed to determine whether the intake of specific food groups is indeed related to glaucoma. Therefore, future investigations should focus on exploring the relationships between glaucoma and various food groups.
Our study has several limitations. Firstly, this study utilized 24-h recall data from the KNHANES. The 24-h recall is a method used to investigate the type and quantity of food consumed in the past 24 h or the previous day. Considering that the subjects in this study were over 60 yrs old, it is believed that the survey was more challenging compared to a younger age group. Additionally, relying solely on this data may not accurately represent the usual food consumption or intake amounts of the subjects. Secondly, current study was a cross-sectional study and conducted as part of the KNHANES, which limits our ability to establish a causal relationship between nutrient intake and glaucoma. To clearly confirm any causal relationships, future studies utilizing prospective cohort surveys are needed. Thirdly, there was a significant difference in the number of subjects between the 2 groups, with a smaller number of subjects in the glaucoma group.
In summary, the results of the present study revealed that the glaucoma group showed lower intakes of meats, fish, shellfish, omega-3, and vitamin C compared to the non-glaucoma group. Therefore, there was an association between food and nutrient intake and glaucoma in older adults. A prospective study is needed to clarify the causal relationship between food, nutrient intake, and glaucoma for future research.

Notes

Conflict of Interest: The authors declare no potential conflicts of interests.

Author Contributions:

  • Conceptualization: Kim J, Yang YJ, Park S, Methodology.

  • Writing - review & editing: Kim J, Yang YJ, Park S.

References

1. Lee KB, Kim MK, Kim MJ, Ahn SI, Hwang YH. The path to glaucoma diagnosis. J Korean Ophthalmol Soc. 2016; 57:794–799.
2. Woo GJ, Kim YJ, Oh KW. Prevalence, awareness and treatment rates of eye diseases: Korea National Health and Nutrition Examination Survey. Public Health Wkly Rep. 2019; 12:717–721.
3. Korean Statistical Information Service. Percentage of the elderly population [Internet]. Daejeon: Statistics Korea;2023. cited 2023 July 25. Available from: https://kosis.kr/visual/populationKorea/PopulationDashBoardMain.do.
4. Hyman L, Wu SY, Connell AM, Schachat A, Nemesure B, Hennis A, Leske MC. Prevalence and causes of visual impairment in The Barbados Eye Study. Ophthalmology. 2001; 108:1751–1756. PMID: 11581045.
5. Park SS, Lee HJ, Kim HJ, Lee EH. The prevalence of cataract and glaucoma in Korean. Korean J Vis Sci. 2012; 14:77–84.
6. Quigley HA, Broman AT. The number of people with glaucoma worldwide in 2010 and 2020. Br J Ophthalmol. 2006; 90:262–267. PMID: 16488940.
7. Le A, Mukesh BN, McCarty CA, Taylor HR. Risk factors associated with the incidence of open-angle glaucoma: the visual impairment project. Invest Ophthalmol Vis Sci. 2003; 44:3783–3789. PMID: 12939292.
8. McMonnies CW. Glaucoma history and risk factors. J Optom. 2017; 10:71–78. PMID: 27025415.
9. Hwang HJ, Shin KO, Shin SJ. A study on the relationship between eye disease and nutrient intake in Korean adults: data from Korean National Health and Nutrition Examination Survey 2015, 2016. J Korean Diet Assoc. 2021; 27:77–91.
10. Pasquale LR, Kang JH. Lifestyle, nutrition, and glaucoma. J Glaucoma. 2009; 18:423–428. PMID: 19680048.
11. Kim H. Relations of glaucoma and dietary pattern factor. J Korean Ophthalmic Opt Soc. 2013; 18:61–65.
12. Ministry of Health and Welfare (KR). The Korean Nutrition Society. Dietary Reference Intakes for Koreans 2020. Sejong: Ministry of Health and Welfare;2020.
13. Ramdas WD, Schouten JS, Webers CA. The effect of vitamins on glaucoma: a systematic review and meta-analysis. Nutrients. 2018; 10:359. PMID: 29547516.
14. Wang SY, Singh K, Lin SC. Glaucoma and vitamins A, C, and E supplement intake and serum levels in a population-based sample of the United States. Eye (Lond). 2013; 27:487–494. PMID: 23429409.
15. Giaconi JA, Yu F, Stone KL, Pedula KL, Ensrud KE, Cauley JA, Hochberg MC, Coleman AL. Study of Osteoporotic Fractures Research Group. The association of consumption of fruits/vegetables with decreased risk of glaucoma among older African-American women in the study of osteoporotic fractures. Am J Ophthalmol. 2012; 154:635–644. PMID: 22818906.
16. Taechameekietichai T, Chansangpetch S, Peerawaranun P, Lin SC. Association between daily niacin intake and glaucoma: National Health and Nutrition Examination Survey. Nutrients. 2021; 13:4263. PMID: 34959814.
17. Jung KI, Kim YC, Park CK. Dietary niacin and open-angle glaucoma: the Korean National Health and Nutrition Examination Survey. Nutrients. 2018; 10:387. PMID: 29565276.
18. Tittler EH, de Barros DS, Navarro JB, Freitas DG, Gheith ME, Siam GA, Spaeth GL. Oral niacin can increase intraocular pressure. Ophthalmic Surg Lasers Imaging. 2008; 39:341–342. PMID: 18717445.
19. Lee SYC, Tseng VL, Avallone TJ, Yu F, Caprioli J, Coleman AL. Associations between niacin intake and glaucoma in the National Health and Nutrition Examination Survey. Invest Ophthalmol Vis Sci. 2021; 62:1604.
20. Kang JH, Pasquale LR, Willett WC, Rosner BA, Egan KM, Faberowski N, Hankinson SE. Dietary fat consumption and primary open-angle glaucoma. Am J Clin Nutr. 2004; 79:755–764. PMID: 15113712.
21. Bengtsson B, Leske MC, Hyman L, Heijl A. Early Manifest Glaucoma Trial Group. Fluctuation of intraocular pressure and glaucoma progression in the early manifest glaucoma trial. Ophthalmology. 2007; 114:205–209. PMID: 17097736.
22. Nguyen CT, Bui BV, Sinclair AJ, Vingrys AJ. Dietary omega 3 fatty acids decrease intraocular pressure with age by increasing aqueous outflow. Invest Ophthalmol Vis Sci. 2007; 48:756–762. PMID: 17251475.
23. Wang YE, Tseng VL, Yu F, Caprioli J, Coleman AL. Association of dietary fatty acid intake with glaucoma in the United States. JAMA Ophthalmol. 2018; 136:141–147. PMID: 29270632.
24. Perez CI, Singh K, Lin S. Relationship of lifestyle, exercise, and nutrition with glaucoma. Curr Opin Ophthalmol. 2019; 30:82–88. PMID: 30562241.
TOOLS
Similar articles