INTRODUCTION
Effective management of blood pressure is crucial in a clinical setting due to its impact on the risk of mortality following surgery, which can be influenced by hemodynamic shifts, increased stress responses, heightened blood coagulability, and inflammation resulting from anesthesia and surgical procedures. Although the topic has been extensively discussed, current research does not offer definitive insights into how various blood pressure levels affect outcomes after surgery.
1234567891011121314
Cheung et al.
15 proposed the “HEART” score, aimed at predicting intraoperative hypotension, known as a risk factor for 30-day mortality, in a study involving 193 patients undergoing elective non-cardiac surgery. This score considers variables such as preanesthetic heart rate and the presence of preanesthetic hypotension. Recently, Venkatesan et al.
16 conducted a cohort study directly analyzing the impact of preoperatively measured blood pressure on 30-day mortality in patients undergoing elective non-cardiac surgery. This study reported that preoperative hypotension affected 30-day mortality in elderly patients. It specifically highlighted that preoperative hypotension had a pronounced impact on the 30-day mortality of elderly patients when mean systolic blood pressure falls below 119/63 mmHg, suggesting further research to develop more nuanced perioperative care strategies for this population group.
The relationship between preoperative hypertension (HTN) and the risk of 30 days mortality is not well-defined, but surgeries for patients with such conditions are frequently delayed or cancelled in clinical settings. Howell et al.,
17 through a systematic review, reported that while the association between preoperative HTN and the risk of mortality was statistically significant, it was difficult to conclude that it was clinically significant. Therefore, they recommended not to postpone or cancel surgeries based on preoperative HTN. Additionally, they noted that “white coat hypertension,” which refers to HTN arising from pre-surgery anxiety or being in an unfamiliar environment, could be included among these cases of preoperative HTN.
18192021 This inclusion might lead to an overestimation of the association between preoperative HTN and the risk of mortality.
Drummond et al.
18 studied “white coat hypertension” by comparing blood pressure readings at various times and found that arterial pressure was higher just before anesthesia than readings taken days prior or during office visits. Their study supports using pre-surgery blood pressure records for clinical decisions, emphasizing the need to consider baseline blood pressure variations. They suggest that accounting for such variations could refine decisions on surgery delays or cancellations, though few studies have examined this in relation to postoperative outcomes.
20 These reports underscore the critical importance of considering blood pressure differences in post-operative risk assessments. However, there remains a shortage of studies that explore the association between blood pressure differentials and post-operative outcomes.
Our objective of this study was to assess the effect of the differential blood pressure (Diff-BP), which defined as discrepancy between preanesthetic blood pressure measured before surgery and the patient’s baseline blood pressure measured in the ward before one day of surgery on postoperative mortality risk. In addition, we aim to determine the blood pressure difference thresholds that elevate postoperative mortality risk. In this study, we hypothesized that a greater disparity between the blood pressure reading taken in the ward the day before surgery and the blood pressure reading taken in the operating room on the day of surgery would be associated with poorer postoperative outcomes. Further analysis explored the influence of a history of HTN and age—specifically, being over 65—on the mortality risk associated with Diff-BP.
METHODS
Data collection
Data for this study were derived from in-hospital electronic databases and documented within the electronic medical record (EMR) system. Collected information included patient demographics, historical records of HTN, details of surgical procedures, and American Society of Anesthesiologists (ASA) physical status classifications. This ASA scale estimates perioperative risk, ranging from class I for healthy individuals to class VI for brain-dead patients. Additionally, blood pressure readings from the ward and operating room, as well as postoperative results, were analyzed.
Demographic data encompassed age, sex, height, weight, and body mass index (BMI). The surgical information detailed the nature of the surgery and the executing department. blood pressure values were calculated as the average of manual, noninvasive measurements obtained within 24 hours preceding the surgery, provided at least two readings were available from the pre-surgery day. Day-of-surgery blood pressure data were omitted from our analysis to avoid inconsistencies arising from varied timing and frequency of these measurements and potential alterations due to preoperative fasting.
The preanesthetic blood pressure reading was recorded immediately before the administration of intravenous anesthesia induction agents in the patient’s first operating room. It is important to highlight that both the blood pressures were obtained non-invasively, typically using a pressurized cuff applied to the arm or leg. Our study did not differentiate based on the site of blood pressure measurement nor the specific equipment utilized. We included various blood pressure measurements such as systolic blood pressure (SBP), diastolic blood pressure (DBP), mean blood pressure (MBP), and pulse pressure (PP). The Diff-BP was evaluated across all blood pressure parameters including systolic, diastolic, mean, and pulse pressures.
In our analysis, we concentrated exclusively on in-hospital mortalities occurring within 30 days following surgery to assess postoperative outcomes
Inclusion and exclusion criteria
The
Fig. 1 shows the flow chart of study population including inclusion and exclusion criteria. The study cohort comprised 85,296 patients who attended a single tertiary institution from 1 March 2019 to 28 February 2021. To focus our study on adult patients undergoing non-cardiac surgery, we excluded 11,357 patients who were under 18 years of age and 6,584 patients who had undergone cardiac surgery. Non-cardiac surgery encompasses all surgical interventions that do not involve the heart or its major adjacent vessels. In contrast, cardiac surgeries require the use of cardiopulmonary bypass technology, which temporarily replaces heart and lung function, facilitating surgical procedures on the heart and its associated structures. This fundamental difference leads to distinct physiological responses during surgery and different postoperative recovery pathways. Consequently, our analysis was exclusively dedicated to non-cardiac surgeries, excluding procedures classified as cardiac surgeries.
Fig. 1
Flow chart of study population including inclusion and exclusion criteria.
ASA = American Society of Anesthesiologists.
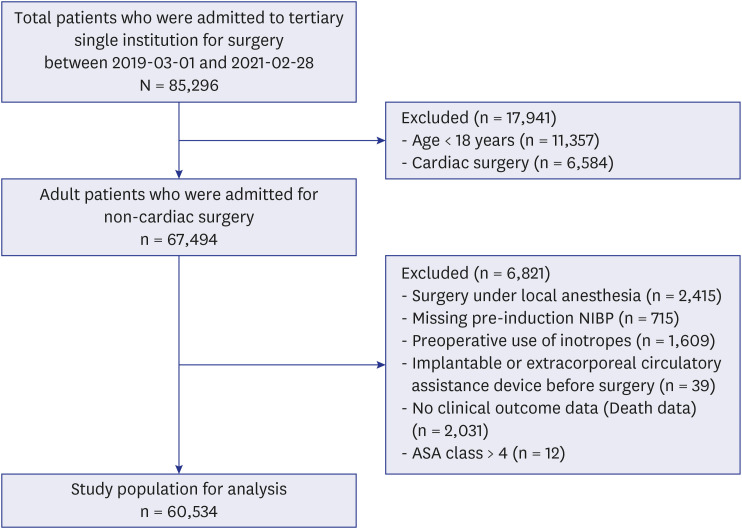
In our investigation, we refined the study cohort by excluding specific subsets of patients. This included those who underwent procedures necessitating only local anesthesia (n = 2,415), as well as individuals with incomplete records of blood pressure measurements (n = 715) or 30-day mortality data (n = 2,031). Furthermore, patients who used implantable or extracorporeal circulatory assistance devices prior to surgery (n = 39) were omitted from the analysis. Additionally, we excluded those who were administered medications known to influence perioperative blood pressure, such as vasopressors, inotropes, and tranquilizers (n = 1,609), as well as patients designated as ASA class V and VI (n = 12). After these exclusions, the final sample size for our study was 60,534 patients. Patients without outcome information or pressure measurements either preanesthetically or in the ward were excluded from the analysis. Additionally, patients with fewer than three baseline pressure readings and those without recorded covariate information were also excluded.
Statistical analysis
The primary analysis explored the relationship between two types of blood pressure measurements—preanesthetic blood pressure and Diff-BP—and 30-day postoperative mortality. Our methodology for analyzing these relationships utilized the restricted cubic spline logistic regression (RCS-LR) approach, referenced in the work of Venkatesan et al.
16
In summary, we modeled all blood pressure values and their differences as continuous variables, employing both adjusted and unadjusted restricted cubic spline regression analyses with four knots. The knots’ placements were determined based on the recommended percentiles at the 5th, 35th, 65th, and 95th percentiles for all blood pressure measurements and differences. The adjusted RCS-LR model accounted for a range of covariates, including age, sex, BMI, ASA class, and type of surgery, to ensure comprehensive adjustment.
To evaluate the adequacy of our modeling, we used several metrics. Initially, we compared the Akaike Information Criterion (AIC) scores of linear models and the RCS-LR model to ascertain if the RCS-LR provided a superior fit. We also examined the AIC scores for models with five knots (at the 5th, 25th, 50th, 75th, and 95th percentiles) versus those with four knots, to determine the best fit model for each variable. Furthermore, the Hosmer-Lemeshow (HL) test was employed to assess the goodness of fit for our models.
Risk thresholds were established at the point where the 95% confidence intervals (CIs) did not overlap with 1 (P < 0.050), indicating statistical significance. Additionally, we conducted a subgroup analysis with the hypothesis that a history of HTN and age > 65 could be particularly indicative of increased mortality risk. Bland-Altman analysis was employed to visualize relationship between baseline and preanesthetic blood pressure. All analyses were carried out using the R programming language (R version 3.5.1; R Foundation for Statistical Computing, Vienna, Austria).
Ethics statement
Ethical approval for this study was provided by the Institutional Review Board (IRB) of Asan Medical Center (IRB No. 2022-0901), on 7 September 2022. This retrospective analysis study followed the guidelines of the Declaration of Helsinki. The requirement for informed consent from the patient subjects was waived by the IRB because the study data were automatically collected through the EMR system, analyzed retrospectively, and only used for analysis after being anonymized by removing all identifiers and sensitive information.
RESULTS
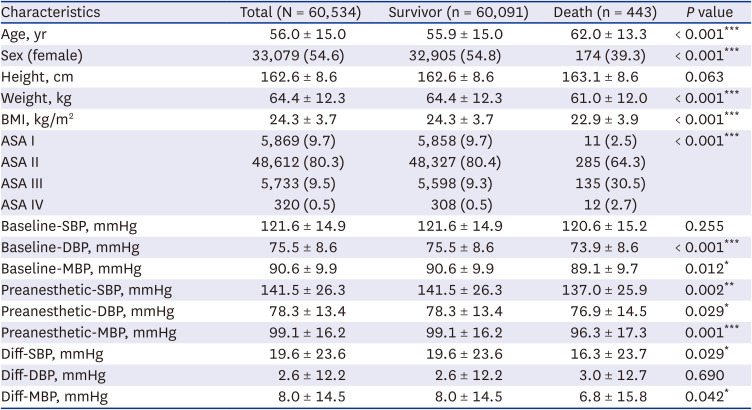
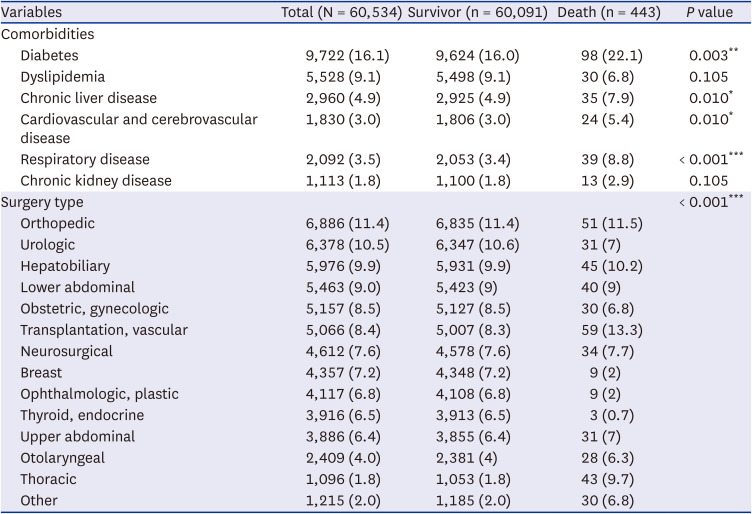
Tables 1 and
2 present a detailed comparison of patient cohort characteristics and clinical variables, including demographic information, surgery type, relative to 30-day postoperative mortality. Our study cohort included 60,534 adult patients who underwent elective non-cardiac surgery. It was observed that the deceased patient group exhibited significantly higher average age (62.0 vs. 55.9 years,
P < 0.001), a smaller proportion of females (39.3% vs. 54.8%,
P < 0.001), reduced average weight (61.0 vs. 64.4 kg,
P < 0.001), and decreased BMI (22.9 vs 24.3 kg/m
2,
P < 0.001). Additionally, this group had a substantially larger fraction of patients deemed high-risk (ASA3 or higher, 33.2% vs. 9.8%,
P < 0.001). Comorbidities such as diabetes (22.1% vs. 16.0%,
P = 0.003), chronic liver disease (7.9% vs. 4.9%,
P = 0.010), cardiovascular and cerebrovascular disease (5.4% vs. 3.0%,
P = 0.010), and respiratory disease (8.8% vs. 3.4%,
P < 0.001) also showed a higher proportion in deceased patient group. The type of surgery also differed significantly between survival and deceased groups, with thoracic surgery being notably different (9.7% vs. 1.8%,
P < 0.001). In terms of blood pressure, the deceased patients typically displayed lower readings for both the baseline and the preanesthetic blood pressure. The difference in Diff-BP showed marginal significance for SBP (
P = 0.029) and MBP (
P = 0.042).
Table 1
Patient characteristics based on 30-day postoperative mortality
|
Characteristics |
Total (N = 60,534) |
Survivor (n = 60,091) |
Death (n = 443) |
P value |
|
Age, yr |
56.0 ± 15.0 |
55.9 ± 15.0 |
62.0 ± 13.3 |
< 0.001***
|
|
Sex (female) |
33,079 (54.6) |
32,905 (54.8) |
174 (39.3) |
< 0.001***
|
|
Height, cm |
162.6 ± 8.6 |
162.6 ± 8.6 |
163.1 ± 8.6 |
0.063 |
|
Weight, kg |
64.4 ± 12.3 |
64.4 ± 12.3 |
61.0 ± 12.0 |
< 0.001***
|
|
BMI, kg/m2
|
24.3 ± 3.7 |
24.3 ± 3.7 |
22.9 ± 3.9 |
< 0.001***
|
|
ASA I |
5,869 (9.7) |
5,858 (9.7) |
11 (2.5) |
< 0.001***
|
|
ASA II |
48,612 (80.3) |
48,327 (80.4) |
285 (64.3) |
|
ASA III |
5,733 (9.5) |
5,598 (9.3) |
135 (30.5) |
|
ASA IV |
320 (0.5) |
308 (0.5) |
12 (2.7) |
|
Baseline-SBP, mmHg |
121.6 ± 14.9 |
121.6 ± 14.9 |
120.6 ± 15.2 |
0.255 |
|
Baseline-DBP, mmHg |
75.5 ± 8.6 |
75.5 ± 8.6 |
73.9 ± 8.6 |
< 0.001***
|
|
Baseline-MBP, mmHg |
90.6 ± 9.9 |
90.6 ± 9.9 |
89.1 ± 9.7 |
0.012*
|
|
Preanesthetic-SBP, mmHg |
141.5 ± 26.3 |
141.5 ± 26.3 |
137.0 ± 25.9 |
0.002**
|
|
Preanesthetic-DBP, mmHg |
78.3 ± 13.4 |
78.3 ± 13.4 |
76.9 ± 14.5 |
0.029*
|
|
Preanesthetic-MBP, mmHg |
99.1 ± 16.2 |
99.1 ± 16.2 |
96.3 ± 17.3 |
0.001***
|
|
Diff-SBP, mmHg |
19.6 ± 23.6 |
19.6 ± 23.6 |
16.3 ± 23.7 |
0.029*
|
|
Diff-DBP, mmHg |
2.6 ± 12.2 |
2.6 ± 12.2 |
3.0 ± 12.7 |
0.690 |
|
Diff-MBP, mmHg |
8.0 ± 14.5 |
8.0 ± 14.5 |
6.8 ± 15.8 |
0.042*
|
Table 2
Association between patient comorbidity, surgery type and 30-day postoperative mortality
|
Variables |
Total (N = 60,534) |
Survivor (n = 60,091) |
Death (n = 443) |
P value |
|
Comorbidities |
|
|
|
|
|
Diabetes |
9,722 (16.1) |
9,624 (16.0) |
98 (22.1) |
0.003**
|
|
Dyslipidemia |
5,528 (9.1) |
5,498 (9.1) |
30 (6.8) |
0.105 |
|
Chronic liver disease |
2,960 (4.9) |
2,925 (4.9) |
35 (7.9) |
0.010*
|
|
Cardiovascular and cerebrovascular disease |
1,830 (3.0) |
1,806 (3.0) |
24 (5.4) |
0.010*
|
|
Respiratory disease |
2,092 (3.5) |
2,053 (3.4) |
39 (8.8) |
< 0.001***
|
|
Chronic kidney disease |
1,113 (1.8) |
1,100 (1.8) |
13 (2.9) |
0.105 |
|
Surgery type |
|
|
|
< 0.001***
|
|
Orthopedic |
6,886 (11.4) |
6,835 (11.4) |
51 (11.5) |
|
Urologic |
6,378 (10.5) |
6,347 (10.6) |
31 (7) |
|
Hepatobiliary |
5,976 (9.9) |
5,931 (9.9) |
45 (10.2) |
|
Lower abdominal |
5,463 (9.0) |
5,423 (9) |
40 (9) |
|
Obstetric, gynecologic |
5,157 (8.5) |
5,127 (8.5) |
30 (6.8) |
|
Transplantation, vascular |
5,066 (8.4) |
5,007 (8.3) |
59 (13.3) |
|
Neurosurgical |
4,612 (7.6) |
4,578 (7.6) |
34 (7.7) |
|
Breast |
4,357 (7.2) |
4,348 (7.2) |
9 (2) |
|
Ophthalmologic, plastic |
4,117 (6.8) |
4,108 (6.8) |
9 (2) |
|
Thyroid, endocrine |
3,916 (6.5) |
3,913 (6.5) |
3 (0.7) |
|
Upper abdominal |
3,886 (6.4) |
3,855 (6.4) |
31 (7) |
|
Otolaryngeal |
2,409 (4.0) |
2,381 (4) |
28 (6.3) |
|
Thoracic |
1,096 (1.8) |
1,053 (1.8) |
43 (9.7) |
|
Other |
1,215 (2.0) |
1,185 (2.0) |
30 (6.8) |
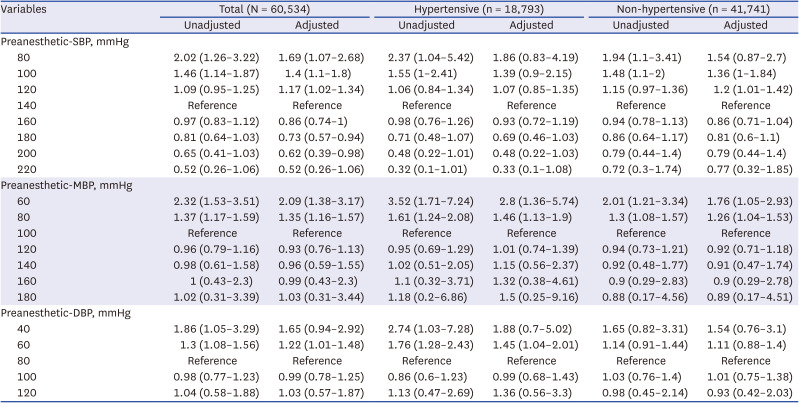
Fig. 2 showcases both unadjusted and adjusted analyses, considering ASA class, sex, age, BMI, and surgery department, using restricted cubic spline analysis for preanesthetic systolic blood pressure and Diff-SBP. The findings indicate an association of decreased preanesthetic blood pressure starting from 120 mmHg with increased odds of postoperative mortality, highlighted by an adjusted odds ratio (OR) of 1.17 (95% CI, 1.02–1.34) at 120 mmHg. Statistically significant ORs are observed for the 120, 100, and 80 mmHg cases, as shown in
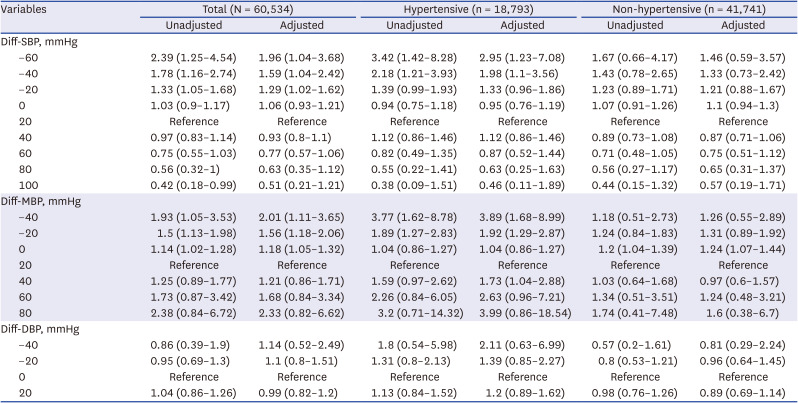
Table 3. For Diff-SBP, an elevation in adjusted OR begins at a Diff-SBP of −20 mmHg, noted at 1.29 (95% CI, 1.02–1.62). Statistically significant odds ratios are observed for the −20, −40, and −60 mmHg cases, as shown in
Table 4. These trends are significantly more distinct in hypertensive patients compared to those without HTN (Diff-SBP of −30 mmHg: 1.63 [95% CI, 1.04–2.55]). The adequacy of model fit was evaluated using AIC scores across models with different knot configurations (5%, 25%, 50%, 75%, 95% vs. 5%, 35%, 65%, 95%) and against linear models, as elaborated in
Supplementary Table 1. Additionally, the results of the Hosmer and Lemeshow goodness of fit test, as employed by Venkatesan et al.,
16 affirm a satisfactory model fit to the data (
pHL,preanes − SBP
= 0.382,
pHL,Diff−SBP
= 0.264), despite the AIC for both preanesthetic SBP and Diff-SBP not being lower than their linear model counterparts (
AICfull
−
AICnull
= −3.8 and −3.2). Noteworthy is that non-hypertensive individuals did not demonstrate an increase in OR in any direction of the Preanesthetic SBP and Diff-SBP.
Fig. 2
Unadjusted and fully adjusted spline graphs illustrate the association between preanesthetic-SBP, Diff-SBP, and perioperative mortality. The fully adjusted model accounts for age, sex, BMI, department of operation, and ASA class. Patients with and without a history of hypertension are analyzed separately in subsequent figures. (A) The unadjusted model shows a higher risk estimation for both low preanesthetic and Diff-SBP compared to adjusted model. (B) The adjusted model shows a relatively low risk estimation for both. Preanesthetic SBP lower than 80 mmHg or Diff-SBP lower than −20 mmHg are significantly associated with 30-day mortality risk.
SBP = systolic blood pressure, Diff-SBP = differential systolic blood pressure, BMI = body mass index, ASA = American Society of Anesthesiologists, CI = confidence interval, DEP = department of operation.
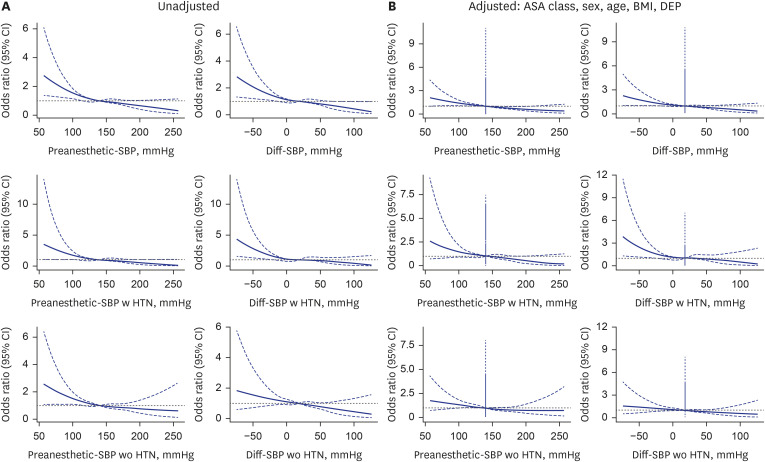
Table 3
Odds ratios for the risk of 30-day mortality according to preanesthetic blood pressure
|
Variables |
Total (N = 60,534) |
Hypertensive (n = 18,793) |
Non-hypertensive (n = 41,741) |
|
Unadjusted |
Adjusted |
Unadjusted |
Adjusted |
Unadjusted |
Adjusted |
|
Preanesthetic-SBP, mmHg |
|
|
|
|
|
|
|
80 |
2.02 (1.26–3.22) |
1.69 (1.07–2.68) |
2.37 (1.04–5.42) |
1.86 (0.83–4.19) |
1.94 (1.1–3.41) |
1.54 (0.87–2.7) |
|
100 |
1.46 (1.14–1.87) |
1.4 (1.1–1.8) |
1.55 (1–2.41) |
1.39 (0.9–2.15) |
1.48 (1.1–2) |
1.36 (1–1.84) |
|
120 |
1.09 (0.95–1.25) |
1.17 (1.02–1.34) |
1.06 (0.84–1.34) |
1.07 (0.85–1.35) |
1.15 (0.97–1.36) |
1.2 (1.01–1.42) |
|
140 |
Reference |
Reference |
Reference |
Reference |
Reference |
Reference |
|
160 |
0.97 (0.83–1.12) |
0.86 (0.74–1) |
0.98 (0.76–1.26) |
0.93 (0.72–1.19) |
0.94 (0.78–1.13) |
0.86 (0.71–1.04) |
|
180 |
0.81 (0.64–1.03) |
0.73 (0.57–0.94) |
0.71 (0.48–1.07) |
0.69 (0.46–1.03) |
0.86 (0.64–1.17) |
0.81 (0.6–1.1) |
|
200 |
0.65 (0.41–1.03) |
0.62 (0.39–0.98) |
0.48 (0.22–1.01) |
0.48 (0.22–1.03) |
0.79 (0.44–1.4) |
0.79 (0.44–1.4) |
|
220 |
0.52 (0.26–1.06) |
0.52 (0.26–1.06) |
0.32 (0.1–1.01) |
0.33 (0.1–1.08) |
0.72 (0.3–1.74) |
0.77 (0.32–1.85) |
|
Preanesthetic-MBP, mmHg |
|
|
|
|
|
|
|
60 |
2.32 (1.53–3.51) |
2.09 (1.38–3.17) |
3.52 (1.71–7.24) |
2.8 (1.36–5.74) |
2.01 (1.21–3.34) |
1.76 (1.05–2.93) |
|
80 |
1.37 (1.17–1.59) |
1.35 (1.16–1.57) |
1.61 (1.24–2.08) |
1.46 (1.13–1.9) |
1.3 (1.08–1.57) |
1.26 (1.04–1.53) |
|
100 |
Reference |
Reference |
Reference |
Reference |
Reference |
Reference |
|
120 |
0.96 (0.79–1.16) |
0.93 (0.76–1.13) |
0.95 (0.69–1.29) |
1.01 (0.74–1.39) |
0.94 (0.73–1.21) |
0.92 (0.71–1.18) |
|
140 |
0.98 (0.61–1.58) |
0.96 (0.59–1.55) |
1.02 (0.51–2.05) |
1.15 (0.56–2.37) |
0.92 (0.48–1.77) |
0.91 (0.47–1.74) |
|
160 |
1 (0.43–2.3) |
0.99 (0.43–2.3) |
1.1 (0.32–3.71) |
1.32 (0.38–4.61) |
0.9 (0.29–2.83) |
0.9 (0.29–2.78) |
|
180 |
1.02 (0.31–3.39) |
1.03 (0.31–3.44) |
1.18 (0.2–6.86) |
1.5 (0.25–9.16) |
0.88 (0.17–4.56) |
0.89 (0.17–4.51) |
|
Preanesthetic-DBP, mmHg |
|
|
|
|
|
|
|
40 |
1.86 (1.05–3.29) |
1.65 (0.94–2.92) |
2.74 (1.03–7.28) |
1.88 (0.7–5.02) |
1.65 (0.82–3.31) |
1.54 (0.76–3.1) |
|
60 |
1.3 (1.08–1.56) |
1.22 (1.01–1.48) |
1.76 (1.28–2.43) |
1.45 (1.04–2.01) |
1.14 (0.91–1.44) |
1.11 (0.88–1.4) |
|
80 |
Reference |
Reference |
Reference |
Reference |
Reference |
Reference |
|
100 |
0.98 (0.77–1.23) |
0.99 (0.78–1.25) |
0.86 (0.6–1.23) |
0.99 (0.68–1.43) |
1.03 (0.76–1.4) |
1.01 (0.75–1.38) |
|
120 |
1.04 (0.58–1.88) |
1.03 (0.57–1.87) |
1.13 (0.47–2.69) |
1.36 (0.56–3.3) |
0.98 (0.45–2.14) |
0.93 (0.42–2.03) |
Table 4
Odds ratios for the risks of 30-day mortality according to the difference between preanesthetic blood pressure and preoperative blood pressure
|
Variables |
Total (N = 60,534) |
Hypertensive (n = 18,793) |
Non-hypertensive (n = 41,741) |
|
Unadjusted |
Adjusted |
Unadjusted |
Adjusted |
Unadjusted |
Adjusted |
|
Diff-SBP, mmHg |
|
|
|
|
|
|
|
−60 |
2.39 (1.25–4.54) |
1.96 (1.04–3.68) |
3.42 (1.42–8.28) |
2.95 (1.23–7.08) |
1.67 (0.66–4.17) |
1.46 (0.59–3.57) |
|
−40 |
1.78 (1.16–2.74) |
1.59 (1.04–2.42) |
2.18 (1.21–3.93) |
1.98 (1.1–3.56) |
1.43 (0.78–2.65) |
1.33 (0.73–2.42) |
|
−20 |
1.33 (1.05–1.68) |
1.29 (1.02–1.62) |
1.39 (0.99–1.93) |
1.33 (0.96–1.86) |
1.23 (0.89–1.71) |
1.21 (0.88–1.67) |
|
0 |
1.03 (0.9–1.17) |
1.06 (0.93–1.21) |
0.94 (0.75–1.18) |
0.95 (0.76–1.19) |
1.07 (0.91–1.26) |
1.1 (0.94–1.3) |
|
20 |
Reference |
Reference |
Reference |
Reference |
Reference |
Reference |
|
40 |
0.97 (0.83–1.14) |
0.93 (0.8–1.1) |
1.12 (0.86–1.46) |
1.12 (0.86–1.46) |
0.89 (0.73–1.08) |
0.87 (0.71–1.06) |
|
60 |
0.75 (0.55–1.03) |
0.77 (0.57–1.06) |
0.82 (0.49–1.35) |
0.87 (0.52–1.44) |
0.71 (0.48–1.05) |
0.75 (0.51–1.12) |
|
80 |
0.56 (0.32–1) |
0.63 (0.35–1.12) |
0.55 (0.22–1.41) |
0.63 (0.25–1.63) |
0.56 (0.27–1.17) |
0.65 (0.31–1.37) |
|
100 |
0.42 (0.18–0.99) |
0.51 (0.21–1.21) |
0.38 (0.09–1.51) |
0.46 (0.11–1.89) |
0.44 (0.15–1.32) |
0.57 (0.19–1.71) |
|
Diff-MBP, mmHg |
|
|
|
|
|
|
|
−40 |
1.93 (1.05–3.53) |
2.01 (1.11–3.65) |
3.77 (1.62–8.78) |
3.89 (1.68–8.99) |
1.18 (0.51–2.73) |
1.26 (0.55–2.89) |
|
−20 |
1.5 (1.13–1.98) |
1.56 (1.18–2.06) |
1.89 (1.27–2.83) |
1.92 (1.29–2.87) |
1.24 (0.84–1.83) |
1.31 (0.89–1.92) |
|
0 |
1.14 (1.02–1.28) |
1.18 (1.05–1.32) |
1.04 (0.86–1.27) |
1.04 (0.86–1.27) |
1.2 (1.04–1.39) |
1.24 (1.07–1.44) |
|
20 |
Reference |
Reference |
Reference |
Reference |
Reference |
Reference |
|
40 |
1.25 (0.89–1.77) |
1.21 (0.86–1.71) |
1.59 (0.97–2.62) |
1.73 (1.04–2.88) |
1.03 (0.64–1.68) |
0.97 (0.6–1.57) |
|
60 |
1.73 (0.87–3.42) |
1.68 (0.84–3.34) |
2.26 (0.84–6.05) |
2.63 (0.96–7.21) |
1.34 (0.51–3.51) |
1.24 (0.48–3.21) |
|
80 |
2.38 (0.84–6.72) |
2.33 (0.82–6.62) |
3.2 (0.71–14.32) |
3.99 (0.86–18.54) |
1.74 (0.41–7.48) |
1.6 (0.38–6.7) |
|
Diff-DBP, mmHg |
|
|
|
|
|
|
|
−40 |
0.86 (0.39–1.9) |
1.14 (0.52–2.49) |
1.8 (0.54–5.98) |
2.11 (0.63–6.99) |
0.57 (0.2–1.61) |
0.81 (0.29–2.24) |
|
−20 |
0.95 (0.69–1.3) |
1.1 (0.8–1.51) |
1.31 (0.8–2.13) |
1.39 (0.85–2.27) |
0.8 (0.53–1.21) |
0.96 (0.64–1.45) |
|
0 |
Reference |
Reference |
Reference |
Reference |
Reference |
Reference |
|
20 |
1.04 (0.86–1.26) |
0.99 (0.82–1.2) |
1.13 (0.84–1.52) |
1.2 (0.89–1.62) |
0.98 (0.76–1.26) |
0.89 (0.69–1.14) |
Fig. 3 explores the relationship between the preanesthetic MBP and its divergence from the baseline MBP. Reflecting the findings related to SBP, a decline in Preanesthetic MBP starting at 80 mmHg was linked to an increased OR of 1.35 (95% CI, 1.16–1.57). The analysis, conducted using a RCS-LR model, highlighted a significant improvement in AIC compared to linear models for both preanesthetic MBP and Diff-MBP, with AIC gains of 2.081 and 6.934, respectively. In examining Diff-MBP, a distinct bidirectional shift in OR was observed: an elevation in OR was recorded as Diff-MBP dropped below 0, presenting an OR of 1.18 (95% CI, 1.05–1.32) when Diff-MBP was 0. Similarly, an ascent in OR was also noted for Diff-MBP values surpassing 30 mmHg, with an OR of 1.03 (95% CI, 0.84–1.26) at a Diff-MBP of 30. This bidirectional trend was more pronounced among hypertensive patients, with an adjusted OR of 1.35 (95% CI, 1.04–1.77) for a Diff-MBP of 0 mmHg, and an adjusted OR of 1.41 (95% CI, 1.03–1.92) for a Diff-MBP of 30 mmHg. However, akin to the observations with SBP, individuals without HTN did not exhibit any change in OR, regardless of the direction. Similar results were obtained for DBP and PP as well (
Supplementary Figs. 1 and
2).
Fig. 3
Unadjusted and fully adjusted spline graphs illustrate the association between Preanesthetic-MBP, Diff-MBP, and perioperative mortality. The fully adjusted model accounts for age, sex, BMI, department of operation, and ASA class. Patients with and without a history of hypertension are analyzed separately in subsequent figures. (A) The unadjusted model shows a higher risk estimation for both low preanesthetic and Diff-MBP compared to adjusted model. (B) The adjusted model shows a relatively low risk estimation for both. Preanesthetic MBP lower than 80 mmHg or Diff-MBP lower than −20 mmHg are significantly associated with 30-day mortality risk. Higher MBP do not reached statistical significance, except Diff-MBP equal to 40 mmHg.
MBP = mean blood pressure, Diff-SBP = differential mean blood pressure, BMI = body mass index, ASA = American Society of Anesthesiologists, CI = confidence interval, DEP = department of operation.
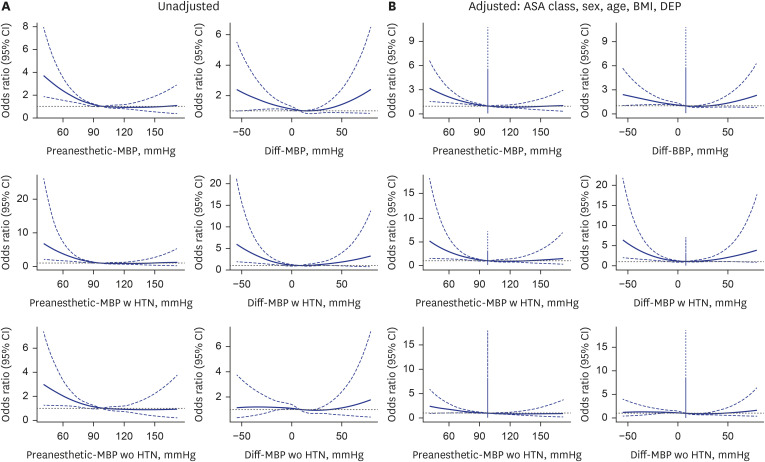
Table 3 provides point estimates for specific blood pressure values at 20 mmHg intervals, as determined from the cubic spline curves. In this analysis, we have differentiated between hypertensive and non-hypertensive patients, showcasing a pronounced association in hypertensive patients. Similarly,
Table 4 presents point estimates for specific blood pressure difference values, also segmented by 20 mmHg intervals based on the corresponding cubic spline curves, akin to the approach in
Table 3. This analysis includes a separate examination of hypertensive and non-hypertensive patient groups, analogous to the preanesthetic blood pressure scenario.
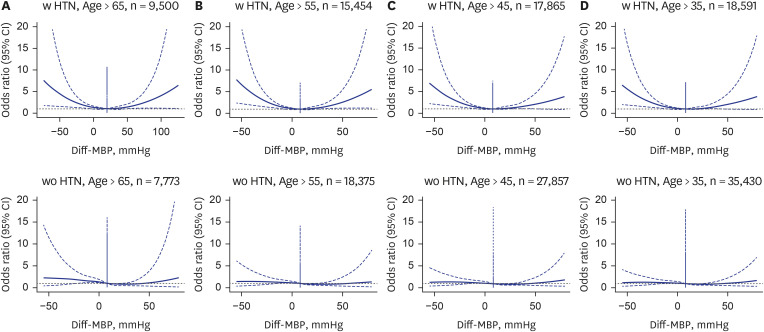
Subgroup analyses exploring the impact of age and HTN history on the association between Diff-BP and 30-day post-operative mortality show that the increased risk associated with negative Diff-BP is more pronounced in patients over the age of 65 and those with a history of HTN.
DISCUSSION
Our study investigated the association between the Diff-BP and 30-day post-surgery mortality. We found a lower preanesthetic compared to baseline blood pressure significantly increased 30 days post-operative mortality risk. On the other hand, a higher preanesthetic blood pressure relative to baseline blood pressure did not substantially escalate the 30-day mortality risk. Our analysis challenges the clinical decision of delaying or cancelling surgeries due to preanesthetic HTN, as we observed no significant correlation between such HTN and an increase in postoperative 30-day mortality.
222324
Our study did uncover a significant association between a higher mean blood pressure in the operating room prior to anesthesia induction relative to the baseline (Diff-MBP > 30 mmHg) and 30-day mortality in patients with HTN. This indicates that in hypertensive individuals, an increase of more than 30 mmHg in MBP at preanesthetic measurement compared to the baseline measurements requires careful attention from clinicians during the perioperative period.
Additionally, our analysis indicates that the risk of postoperative 30-day mortality is not only related to preanesthetic hypotension (preanesthetic blood pressure < 80 mmHg) which agrees with the study by Venkatesan et al.,
16 but also to a significantly reduced preanesthetic blood pressure from baseline (Diff-MBP < −20 mmHg). These findings emphasize the critical role of blood pressure differentials in postoperative risk estimation, a factor not reported in previous studies. Preoperative hypotension likely increases postoperative mortality by pushing patients to the lower limit of cerebral and other end-organ autoregulation, making them more susceptible to perioperative hemodynamic changes, inflammation, and stress responses, which can lead to secondary organ injury and increased risk of death.
16 It suggests that surgical risk evaluations should carefully account for both elevated and decreased preanesthetic blood pressure levels relative to baseline measurements.
Prior research, including Wax et al.’s,
2 has linked preanesthetic HTN with an increased risk of myocardial injury and postoperative mortality, focusing on patients with HTN (blood pressure > 140/90 mmHg). However, its outcomes—myocardial injury or death—did not directly correlate preanesthetic-blood pressure with 30-day mortality. Basem et al.
3 found preanesthetic blood pressure extremes (DBP < 70 mmHg, SBP > 160 mmHg) raised postoperative complications in non-cardiac surgeries but couldn't isolate effects to specific risk factors due to a composite outcome variable. Marcucci et al.
25 reported similar major vascular complications between hypotension-avoidance and HTN-avoidance strategies yet highlighted the hypotension-avoidance group’s lower risk of significant intraoperative hypotension, suggesting its potential to reduce 30-day mortality risk indirectly.
Our research aimed to clarify how preanesthetic blood pressure and its Diff-BP impacts 30-day mortality, providing insights beyond previous studies’ limitations.
16 We explore this blood pressure differential, offering new perspectives on its prognostic value for surgical outcomes, particularly noting how these variations affect mortality risk, especially in the elderly and those with HTN. Our findings suggest an age-dependent mortality risk increase associated with preanesthetic blood pressure changes, significantly highlighted in hypertensive patients (
Figs. 4 and
5).
Fig. 4
Fully adjusted spline graphs illustrating the association between Diff-BP, and perioperative mortality in different age groups (> 65 years) and history of hypertension. (A) > 65 with HTN. (B) ≤ 65 with HTN. (C) > 65 without HTN. (D) ≤ 65 without HTN.
Diff-BP = differential blood pressure, HTN = hypertension, CI = confidence interval, SBP = systolic blood pressure, MBP = mean blood pressure, DBP = diastolic blood pressure.
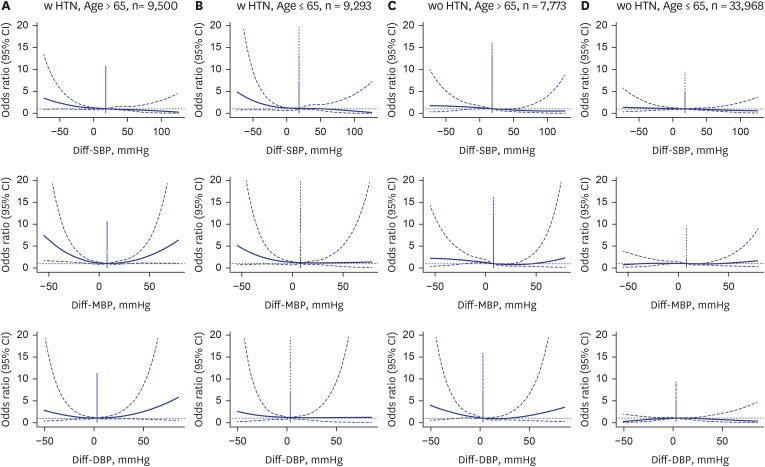
Fig. 5
Fully adjusted spline graphs illustrating the association between Diff-MBP, and perioperative mortality in different age groups. (A) Age > 65, (B) age > 55, (C) age > 45, and (D) age > 35.
Diff-MBP = differential mean blood pressure, HTN = hypertension, CI = confidence interval.
Earlier studies, like those by Drummond et al.
18 and van Klei et al.,
20 investigated preoperative versus preanesthetic blood pressure differences but either focused on small samples or specific patient groups, limiting broader conclusions. Our study extends this work by examining the relationship across a wider demographic, underscoring the importance of considering both age and pre-existing HTN in assessing mortality risks associated with blood pressure fluctuations before surgery.
Our study broadens previous research by examining adults 18 and older, confirming an increase in preanesthetic blood pressure, as seen in earlier studies. Through Bland-Altman analysis, we found a positive correlation between baseline blood pressure and preanesthetic blood pressure, showing that higher readings tend to have larger discrepancies (
Supplementary Figs. 3 and
4). This pattern was consistent across systolic, mean, and diastolic pressures, indicating an increased mortality risk in hypertensive patients. Our findings contribute new insights into the impact of blood pressure variation on surgical outcomes. While we did not specifically account for the timing of blood pressure measurements, the implications from Drummond’s study suggest that the timing of these measurements is unlikely to significantly alter our study’s core findings.
In this study, we utilized cubic spline logistic regression, following the methods of Venkatesan et al.
16 Additionally, we compared the results of simple logistic regression with cubic spline logistic regression using model assessment metrics such as AIC and the HL test, as shown in
Supplementary Table 1. We also tested the effect of the number of knots in the statistical modeling and found that 4 knots were optimal. The use of cubic spline analysis demonstrated significant benefits, particularly in the Diff-MBP case (
Supplementary Table 1).
Our study is subject to several limitations, notably due to its retrospective design. The potential for missing data including antihypertensive medication usage may introduces the risk of biased outcomes. Moreover, the selection of patients for our analysis may have been influenced by selection bias. Nevertheless, the robustness of our conclusions is supported, in part, by the considerable size of our study population. It is important to acknowledge, however, that our findings are derived from a single institution, which may limit their broader applicability. To corroborate our results, future research involving multiple institutions is warranted. Additionally, this retrospective analysis relied on data collected from an EMR system, without specifically addressing possible discrepancies caused by varying blood pressure measurement techniques or equipment. Despite this, given the unified setting of our data collection, we assumed minimal variation in measurement practices. We are optimistic that the breadth of our data analysis helps to diminish the impact of these limitations, offering valuable insights despite the mentioned constraints. Another limitation of our study is that our results do not provide information on whether preoperative blood pressure control in patients with preanesthetic blood pressure lower than baseline blood pressure can improve postoperative outcomes. Therefore, prospective studies are needed to determine whether preoperative blood pressure control can enhance postoperative outcomes in the high-risk surgical population identified in our study.
In exploring the link between blood pressure metrics and surgical outcomes, our analysis accounted for potential confounders including age, sex, BMI, a history of HTN, ASA classification, and the type of surgery. Owing to the absence of detailed patient comorbidity information beyond HTN in our dataset, we employed ASA classification as a proxy to adjust for patient health status.
26 In addition, For the antihypertensive medication usage, given that in-hospital patients with HTN are typically educated to strictly adhere to a daily regimen of antihypertensive medication, it is reasonable to assume they would have taken their medication on the day of surgery. Furthermore, given the broad spectrum of surgical procedures, we adjusted for the type of surgery based on the surgical department rather than specific surgical codes, aiming to mitigate potential biases and provide a more generalized understanding of the relationship between preoperative blood pressure variations and postoperative outcome.
In conclusion, our investigation explores the complex relationship between blood pressure measured immediately before anesthesia induction in the operating room and preoperative blood pressure, and its impact on outcomes following non-cardiac surgeries. Our study showed that lower preanesthetic blood pressure compared to baseline blood pressure was associated with poorer postoperative outcomes, whereas higher blood pressure was not associated with worse postoperative outcomes. This suggests that lower preanesthetic blood pressure relative to baseline blood pressure may require more attentive perioperative patient management. This study represents one of the pioneering efforts to systematically explore the effect of blood pressure differences on 30 days mortality. The gap between preanesthetic and baseline blood pressure, often significant, remains an under-explored factor in its potential to influence surgical outcomes. By shedding light on this relationship, our research contributes vital insights to the field of perioperative care, significantly advancing our understanding of how to optimize patient outcomes post-surgery. Although we cannot change or suggest clinical treatment guidelines based on our study, our findings may provide a rationale for screening high-risk patients before surgery and serve as a preliminary basis for prospective studies to determine how clinical interventions may affect outcomes. The necessity for broader, multi-institutional studies to further validate and refine clinical practice based on these insights cannot be overstated, highlighting the importance of our findings for future surgical management and patient care strategies.


 PDF
PDF Citation
 Print
Print


 XML Download