Journal List > J Educ Eval Health Prof > v.21 > 1516088199

Seo, Choi, Kim, and Huh: Comparison of real data and simulated data analysis of a stopping rule based on the standard error of measurement in computerized adaptive testing for medical examinations in Korea: a psychometric study

Abstract

Purpose

This study aimed to compare and evaluate the efficiency and accuracy of computerized adaptive testing (CAT) under 2 stopping rules (standard error of measurement [SEM]=0.3 and 0.25) using both real and simulated data in medical examinations in Korea.

Methods

This study employed post-hoc simulation and real data analysis to explore the optimal stopping rule for CAT in medical examinations. The real data were obtained from the responses of 3rd-year medical students during examinations in 2020 at Hallym University College of Medicine. Simulated data were generated using estimated parameters from a real item bank in R. Outcome variables included the number of examinees’ passing or failing with SEM values of 0.25 and 0.30, the number of items administered, and the correlation. The consistency of real CAT result was evaluated by examining consistency of pass or fail based on a cut score of 0.0. The efficiency of all CAT designs was assessed by comparing the average number of items administered under both stopping rules.

Results

Both SEM 0.25 and SEM 0.30 provided a good balance between accuracy and efficiency in CAT. The real data showed minimal differences in pass/fail outcomes between the 2 SEM conditions, with a high correlation (r=0.99) between ability estimates. The simulation results confirmed these findings, indicating similar average item numbers between real and simulated data.

Conclusion

The findings suggest that both SEM 0.25 and 0.30 are effective termination criteria in the context of the Rasch model, balancing accuracy and efficiency in CAT.

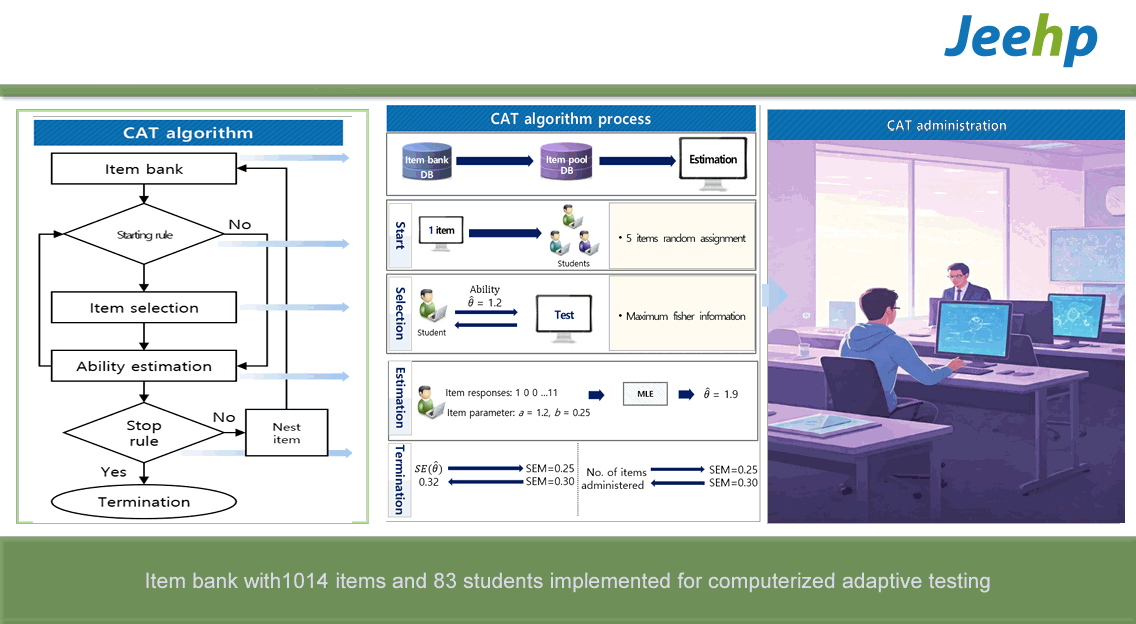
Graphical abstract

Introduction

Background

Computerized adaptive testing (CAT) was first implemented in high-stakes exams such as the National Council Licensure Examination for Registered Nurses (NCLEX-RN) in the United States in 1994. Subsequently, the National Registry of Emergency Medical Technicians (NREMT) in the United States adopted CAT for the Emergency Medical Technicians licensing examination in 2007. Additionally, CAT has been adopted in other assessments, such as the Medical Council of Canada Qualifying Examination. The implementation of CAT is based on item response theory (IRT), which operates under the assumption that both the examinee ability parameters and item parameters remain invariant across different testing situations.
In the CAT process, after each interim ability estimate is calculated, the standard error of the current ability estimate is evaluated. CAT is stopped if this standard error falls below a predetermined criterion; otherwise, it continues until the standard error associated with an interim ability estimate meets the criterion. The final ability estimate is then determined by the most recent interim ability estimate once item selection has finished. CAT stopping rules are designed to ensure equivalent measurement precision for all examinees by terminating item administration once a predetermined measurement standard error is reached. These tests vary in length because the number of items required to meet the termination criterion can differ among examinees.
Researchers have introduced multiple variable-length stopping rules, all aimed at administering the minimum number of items necessary to achieve a reliable estimate of an examinee’s ability, though they vary in the criteria used to determine when an examinee’s ability has been adequately assessed. One such rule is the standard error of measurement (SEM) stopping rule, which ceases item administration when the standard error of the current ability estimate reaches a pre-specified level [1]. In a CAT simulation study, the efficacy of 3 variable-length stopping rules—standard error, minimum information, and change in θ—was evaluated both individually and in combination with constraints on the minimum and maximum number of items [2].

Objectives

The purpose of this study was to evaluate the SEM-based termination criteria for CAT in medical examinations. The study aimed to assess the efficiency and accuracy of CAT using the Rasch model. Extensive research on CAT has employed SEM termination criteria to increase measurement efficiency and accuracy. This study, which used both simulation and real data, investigated the SEM termination criteria for implementing CAT in medical examinations.

Methods

Ethics statement

This study utilized students’ responses in CAT and simulated data; therefore, neither approval by the institutional review board nor the obtainment of informed consent was required.

Study design

Both post-hoc simulation and real data studies were designed to determine the termination rule for computerized testing.

Data sources

Data were obtained from the responses of third-year medical students during examinations in medical courses, the topics of which included all clinical areas, in 2020 at Hallym University College of Medicine. Simulated data were generated using estimated parameters in R. The real data were obtained from real CAT examinations conducted using the adaptive testing platform, LIVECAT (The CAT Korea, https://www.thecatkorea.com/). The data included information calculated each time an examinee responded to individual items, such as the examinee’s ability estimate and the number of items administered. CAT was implemented with a termination criterion of SEM 0.25, with data for each examinee being recorded from the first item until the SEM for the examinee’s ability reached 0.25. To compare the examinee’s ability and the number of items administered based on different termination criteria, data from the original dataset were extracted up to the point where the SEM for the examinee’s ability reached 0.30 (Dataset 1). This approach enabled the creation of data for the same individuals under termination criteria of 0.25 and 0.30.

Setting

In a Monte Carlo simulation study, 1,012 real item parameters from an actual item bank were used, and the abilities (θ) of 1,000 students were generated from a distribution with a mean of 0 and a standard deviation of 1 to mimic real conditions. This study utilized 1,012 item parameters from real medical examination data at Hallym University College of Medicine, collected in 2016 and 2017. In the actual CAT, 83 students from Hallym University College of Medicine participated in a CAT examination using the LIVECAT platform in 2020 [3].

Variables

The outcome variables included the number of examinees who passed or failed according to the cut score with SEM values of 0.25 and 0.30 in the real CAT study, and the correlation and number of items administered with respect to the various SEM criteria in the post-hoc simulation study.

Measurement

This simulation study of CAT employed a post-hoc simulation design. In this approach, item responses were generated from 1,000 candidates responding to real items. A conventional test was previously administered to measure the candidates and to create a full data matrix that was later utilized in the simulated CAT. Because the true θ is unknown, a post-hoc simulation typically assesses the impact of varying CAT termination criteria on test efficiency. The CAT simulation was conducted using the “catR” packages in the R program [4,5]. The real CAT study evaluated the consistency of pass or fail based on a cut score of 0, using SEM values of 0.25 and 0.30.

Bias

All participants were included in this study, and simulation data were generated using R packages. Therefore, there was no participant bias in this study.

Study size

Sample size estimation was not required for this study.

Statistical methods

Measurement results were presented using descriptive statistics. The SEM of examinees in CAT can be computed by observed standard error (OSE) of ability estimate [6]. SEM can be computed by taking the inverse of the square root of the second derivative of the likelihood function when θ is estimated by the maximum likelihood estimation (MLE) and expected a posteriori (EAP) methods. The SEM is described as:
(1)
σθ^=1-2 ln L(u|θj)θj2,
where,
(2)
2 ln L(u|θj)θj2=-i=1nPijQij
and Qij=1Pij.lnL(u|θj) is the log-likelihood function of examinee j directly from the Rasch model, following the assumption of local independence. The Rasch model is described as
(3)
Piθj=expθj-bi1+expθj-bi
The second derivative of the log-likelihood function containing observed values (uij) can be called the SEM. The SEM value in Equation 1 was used to terminate CAT for individual examinees.
Equation 2 is equivalent to the test information function I(θ^j). Therefore, SEM can be expressed by the test information function, I(θ^j), as follows:
(4)
σθ^=1Iθ^j
The variable defined in Equation 4 can be called the theoretical standard error, which is distinct from the OSE.

Results

Real data results

The Hallym University medical exam was administered as variable-length CAT. In 2021, a total of 83 candidates were used in this analysis. In real data, the average number of items based on SEM=0.25 was 71.53 and the average number of items based on SEM=0.30 was 50.38. The correlation between the 2 abilities using SEM=0.25 and SEM=0.30 was 0.99 (P<0.001). The real data results were compared with the results of post-hoc simulation study.
The number of candidates who passed or failed based on SEM=0.25 and 0.3 is presented in Table 1. The cut-score was set to 0.0 based on the mean of the standard normal distribution. The classification consistency of pass or fail between the 2 SEM criteria was 0.927, indicating that there were no major differences between the 2 SEM criteria.
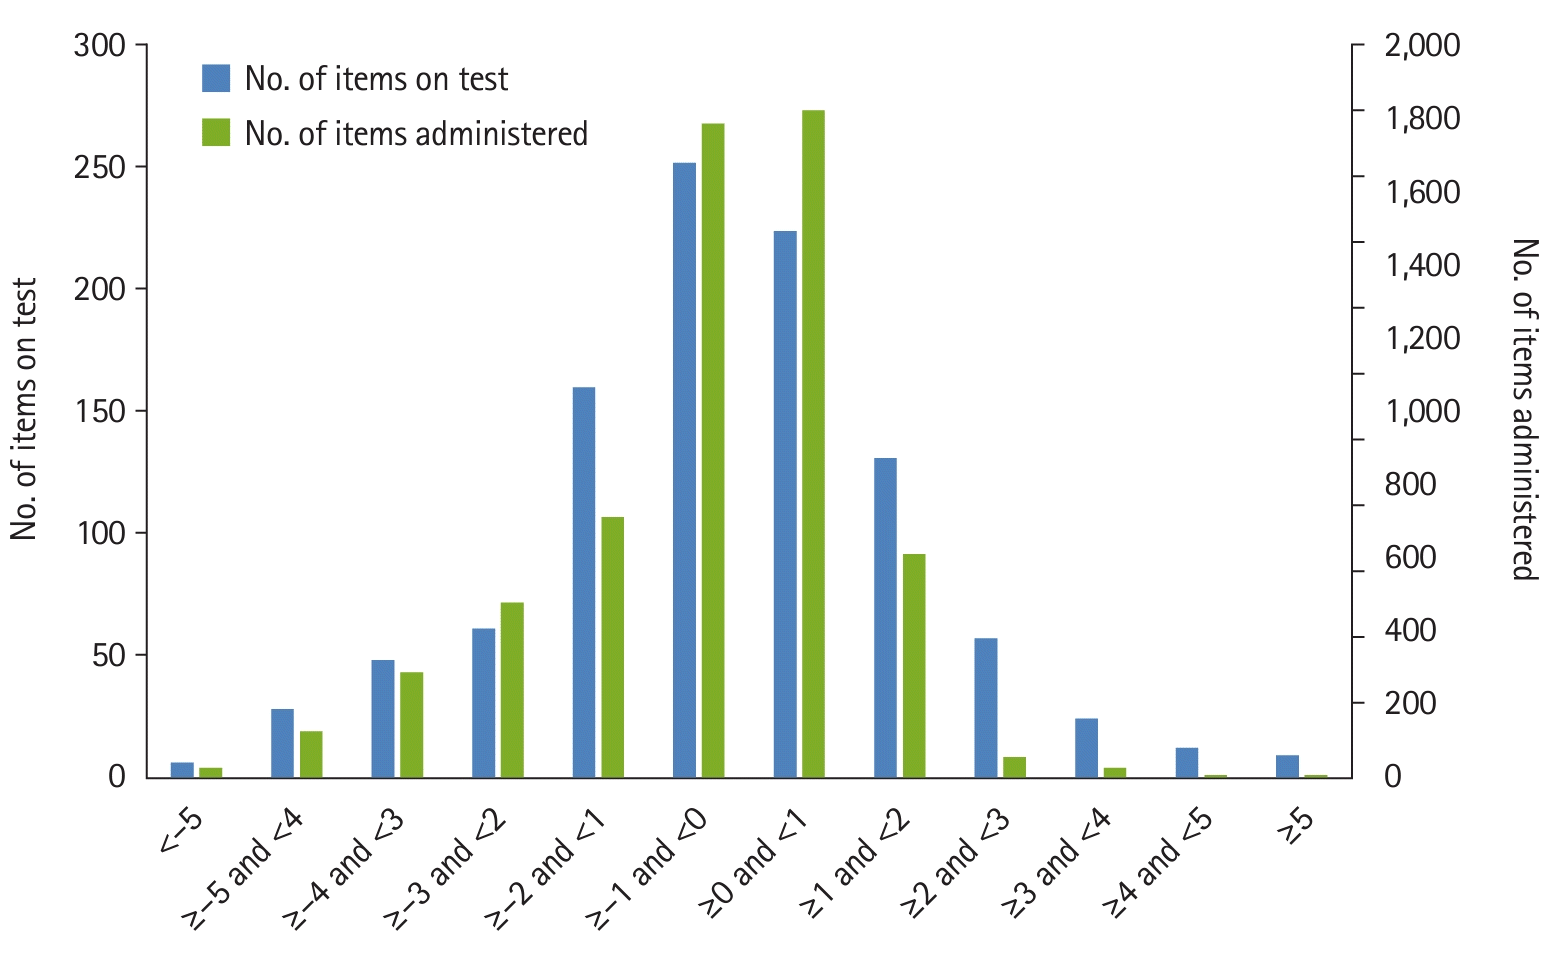
There were 1,012 operational items in the item pool in CAT. Table 2 shows the number of items and proportion administered and exposed to examinees with respect to item difficulty ranges under SEM=0.25. Fig. 1 shows number of items administered and exposed in CAT under SEM=0.25.

CAT simulation results

The correlation statistic was used to evaluate the recovery of the true θ by CAT (Table 3). Additionally, the efficiency of CAT was assessed by averaging the number of items administered under each condition (Table 3). When the SEM was 0.25, the correlation between the true θ and the estimates obtained by CAT was 0.979 and 0.967, with an average of 68.66 and 68.94 items administered under the MLE and EAP methods, respectively. When the SEM was 0.30, the correlation was 0.957 and 0.950, and the average number of items administered was 48.79 and 49.07 under MLE and EAP methods, respectively. Thus, the post-hoc simulation results were consistent with the real data study in terms of accuracy and efficiency.

Discussion

Interpretation

This CAT study, employing both real and simulation data, investigated the impact of the SEM on the accuracy (correlation between true θ and CAT estimates) and efficiency (mean number of items administered in CAT) of CAT. The Rasch model was used as the underlying model for data generation because many assessment corporations (e.g., NCLEX-RN and NREMT) have implemented CAT using the Rasch model [7]. Two SEM criteria were employed to explore the accuracy and efficiency of CAT for both simulation and real data. The results using simulation data provided similar accuracy and efficiency to those of the real data, which can help generalize the findings from this study.

Comparison with previous studies

CAT for real data has a variable length for individual examinees. All examinees must respond to at least 60 test items, and the successive estimates are checked to determine whether the confidence interval (CI) around the estimate contains the passing score for the examination [8]. The CI stopping rule is commonly used in licensure settings to make classification of pass or fail decisions with fewer items in CAT. However, it tends to be less efficient in the near-cut regions of the ability scale, as the CI often fails to be narrow enough for an early termination decision prior to reaching the maximum test length [9,10]. Thus, combining SEM with a fixed-length component resulted in an efficient test where only examinees with relatively high or low abilities exist [2]. In a previous CAT simulation study, the efficacy of 3 variable-length stopping rules—standard error, minimum information, and change in θ—was evaluated both individually and in combination with constraints on the minimum and maximum number of items. These rules were also compared to a fixed-length stopping rule. Each rule was assessed using 2 different termination criteria (SEM=0.35 versus SEM=0.30) within the framework of a polytomous IRT model. The termination criterion of SEM=0.30 performed better than SEM=0.35 in terms of balancing accuracy with efficiency [2].

Limitation

Only the Rasch model was used in this study. Future research should apply other models, such as the 2-parameter logistic model and the 3-parameter logistic model, to extend the findings.

Generalizability

Both SEM criteria values performed well; the 0.25 criterion yielded more precise estimates but slightly increased the test length. A researcher’s choice between a higher or lower SEM termination criterion should depend on whether efficiency or precision is prioritized. If reducing the testing burden is paramount, a higher criterion should be adopted to shorten the average test length. Conversely, a lower criterion should be used if optimal measurement precision and accuracy are more important. However, the differences between these criteria were minimal, and both provided an excellent balance between efficiency and measurement quality.

Conclusion

This study demonstrates that 2 termination criteria in CAT achieved a good balance between accuracy and efficiency. They performed effectively within the Rasch model, with support from both real data and post-hoc simulation results. These consistent findings across various data sources underscore the effectiveness of an ideal termination criterion. However, future research should examine this criterion with other models and populations to confirm its broader applicability.

Notes

Authors’ contributions

Conceptualization: DGS. Data curation: JWC, JHK. Methodology: JWC, DGS. Formal analysis/validation: DGS, JWC. Project administration: DGS. Funding acquisition: DGS. Writing–original draft: DGS. Writing–review & editing: JWC, JHK.

Conflict of interest

Dong Gi Seo has been the CEO of CAT Korea since 2019 and Jeongwook Choi has worked at CAT Korea since 2020. Otherwise, no potential conflicts of interest relevant to this article were reported.

Funding

This study was supported by a research grant from Hallym University (HRF-202404-009).

Data availability

Data files are available from Harvard Dataverse: https://doi.org/10.7910/DVN/R5STH3

Dataset 1. Estimated item parameters for the computerized adaptive testing in R, which were used for generating simulated data.

jeehp-21-18-dataset1.csv

ACKNOWLEDGMENTS

None.

Supplementary materials

Supplementary files are available from Harvard Dataverse: https://doi.org/10.7910/DVN/R5STH3
Supplement 1. A sample of the R code to generate the responses for computerized adaptive testing.
jeehp-21-18-suppl1.txt
Supplement 2. Item response process for each person in computerized adaptive testing when the standard error of the estimate was set to 0.25, including 5,937 total responses for all students.
jeehp-21-18-suppl2.xlsx
Supplement 3. Item response process for each person in computerized adaptive testing when the standard error of estimate was set to 0.3, including 4,182 total responses for all students.
jeehp-21-18-suppl3.xlsx
Supplement 4. Audio recording of the abstract.

References

1. Dodd BG. The effect of item selection procedure and stepsize on computerized adaptive attitude measurement using the rating scale model. Appl Psychol Meas. 1990; 14:355–366. https://doi.org/10.1177/0146621690014004.
2. Stafford RE, Runyon CR, Casabianca JM, Dodd BG. Comparing computer adaptive testing stopping rules under the generalized partial-credit model. Behav Res Methods. 2019; 51:1305–1320. https://doi.org/10.3758/s13428-018-1068-x.
3. Seo DG, Choi J. Introduction to the LIVECAT web-based computerized adaptive testing platform. J Educ Eval Health Prof. 2020; 17:27. https://doi.org/10.3352/jeehp.2020.17.27.
4. Magis D, Raiche G. Random generation of response patterns under computerized adaptive testing with the R package catR. J Stat Softw. 2012; 48:1–31. https://doi.org/10.18637/jss.v048.i08.
5. R Development Core Team. R: a language and environment for statistical computing [Internet]. R Foundation for Statistical Computing;2008; [cited 2024 Jun 10]. Available from: http://www.R-project.org.
6. Seo DG, Choi J. Post-hoc simulation study of computerized adaptive testing for the Korean Medical Licensing Examination. J Educ Eval Health Prof. 2018; 15:14. https://doi.org/10.3352/jeehp.2018.15.14.
7. Seo DG. Overview and current management of computerized adaptive testing in licensing/certification examinations. J Educ Eval Health Prof. 2017; 14:17. https://doi.org/10.3352/jeehp.2017.14.17.
8. Reckase MD. Designing item pools to optimize the functioning of a computerized adaptive test. Psychol Test Assess Model. 2010; 52:127–141.
9. Luo X, Kim D, Dickison P. Projection-based stopping rules for computerized adaptive testing in licensure testing. Appl Psychol Meas. 2018; 42:275–290. https://doi.org/10.1177/0146621617726790.
10. Combs TJ, English KW, Dodd BG, Kang HA. Computer adaptive test stopping rules applied to the flexilevel shoulder functioning test. J Appl Meas. 2019; 20:66–78.

Fig. 1.
The number of items administered and exposed in computerized adaptive testing (standard error of measurement=0.25).
jeehp-21-18f1.tif
jeehp-21-18f2.tif
Table 1.
Number (percent) of candidates who passed or failed (cut-score=0) based on SEM=0.25 and 0.30
Decision SEM=0.3
Pass Fail Total
SEM=0.25 Pass 30 2 32
Fail 4 47 51
Total 34 49 83

SEM, standard error of measurement.

Table 2.
The number of items and proportion administered and exposed to examinees with respect to item difficulty ranges (SEM=0.25)
Difficulty ranges Items administered
Items exposed
No. Proportion No. Proportion
θ <-5 6 0.006 25 0.004
-5≤ θ <-4 28 0.028 125 0.021
-4≤ θ <-3 48 0.047 287 0.048
-3≤ θ <-2 61 0.060 478 0.080
-2≤ θ <-1 160 0.158 712 0.120
-1≤ θ <0 252 0.249 1,787 0.301
0≤ θ <1 224 0.221 1,824 0.307
1≤ θ <2 131 0.129 610 0.103
2≤ θ <3 57 0.056 55 0.009
3≤ θ <4 24 0.024 25 0.004
4≤ θ <5 12 0.012 5 0.001
5< θ 9 0.009 5 0.001
Total 1,012 1 5,938 1

SEM, standard error of measurement.

Table 3.
Correlation and number of items with respect to the SEM
SEM Correlation between (θ,θ^),
Mean no. of items administered
MLE EAP MLE EAP
0.10 0.995 0.992 466.15 462.20
0.15 0.990 0.989 187.12 187.42
0.20 0.979 0.974 105.57 105.34
0.25 0.979 0.967 68.66 68.94
0.30 0.957 0.950 48.79 49.07

SEM, standard error of measurement; MLE, maximum likelihood estimation; EAP, expected a posteriori.

TOOLS
Similar articles