

 PDF
PDF Citation
 Print
Print


INTRODUCTION
Cardiovascular disease (CVD) is a significant global health issue that warrants widespread attention from clinicians, researchers, and public health officials [1]. Post initial cardiovascular (CV) events, clinical emphasis is commonly placed on intensive therapeutic interventions and secondary prevention strategies, which are aimed at minimizing the risk of event recurrence and mitigating the associated complications [2]. Nevertheless, primary prevention has gained increasing attention, particularly among adults devoid of prior CVD events, and studies have been conducted on the primary prevention and prediction of future CVD [3,4]. Numerous predictors have been validated for their ability to predict long-term CV outcomes in healthy adults, and several scoring systems have been developed accordingly [5-8]. However, a persistent requirement remains for predictive scores that can be readily applied in clinical settings. Important risk factors for predicting the development of CVD include metabolic syndrome, non-alcoholic fatty liver disease (NAFLD), and insulin resistance (IR), each of which has corresponding indices [8-10].
Metabolic syndrome is strongly associated with an increased risk of CVDs [11,12]. Central obesity, hyperglycemia, hypertension, and dyslipidemia are important metabolic syndrome components that contribute directly to the pathophysiology of CVD [13,14]. These components are included in the criteria for diagnosing metabolic syndrome presented by the Adult Therapy Program III (ATP-III) [13]; however, this definition is limited as it is dichotomous and does not include the concept of severity. To address this limitation, metabolic syndrome severity scores have been proposed for sex and racial/ethnic groups [15,16]. In addition, IR, an important mechanism of metabolic syndrome, increases the risk of CVD by promoting the development of atherosclerosis and endothelial dysfunction [10,17]. NAFLD is also associated with metabolic syndrome and has an important pathophysiological association with IR [18,19]. NAFLD and IR have a significant impact on CV outcomes, and indices reflecting NAFLD and IR have shown to predict CV risks in previous studies [20-28].
In the present study, we evaluated the usefulness of the indices for metabolic syndrome, NAFLD, and IR as predictive tools for the overall CV risk in middle-aged Korean adults using large-scale cohort data.
METHODS
Study population
Study data were obtained from the Ansan-Ansung cohort, a prospective cohort of 10,030 patients. These patients were enrolled between June 2001 and January 2003, aged 40 to 69 years, residing in two cities in Korea, with follow-up data of up to 18 years. This cohort was part of the Korean Genome Epidemiology Study, which aimed to investigate the genetic and environmental etiology of prevalent metabolic and CVD. This study was funded by the Korean National Research Institute of Health, Korean Centers for Disease Control and Prevention, and Ministry of Health and Welfare. Detailed information on the study methods has been reported in a previous publication [29]. In summary, comprehensive health examinations, on-site interviews, and laboratory tests were conducted during each visit to the survey sites. Nine successive assessments adhering to the entire cohort protocol were performed following the baseline assessment with scheduled biennial revisits until 2018.
Of the 10,030 patients initially enrolled, 9,639 had baseline data available for baseline body mass index (BMI), waist circumference, and laboratory test results (aspartate transaminase [AST], alanine aminotransferase [ALT], triglyceride [TG], gamma-glutamyl transferase [GGT], fasting insulin, and fasting glucose levels). Additionally, among the patients without missing values, 9,337 were not diagnosed with major adverse cardiac and cerebrovascular events (MACCE), including CV death, myocardial infarction (MI), coronary artery disease (CAD), stroke, heart failure (HF), and peripheral artery disease (PAD) (Fig. 1).
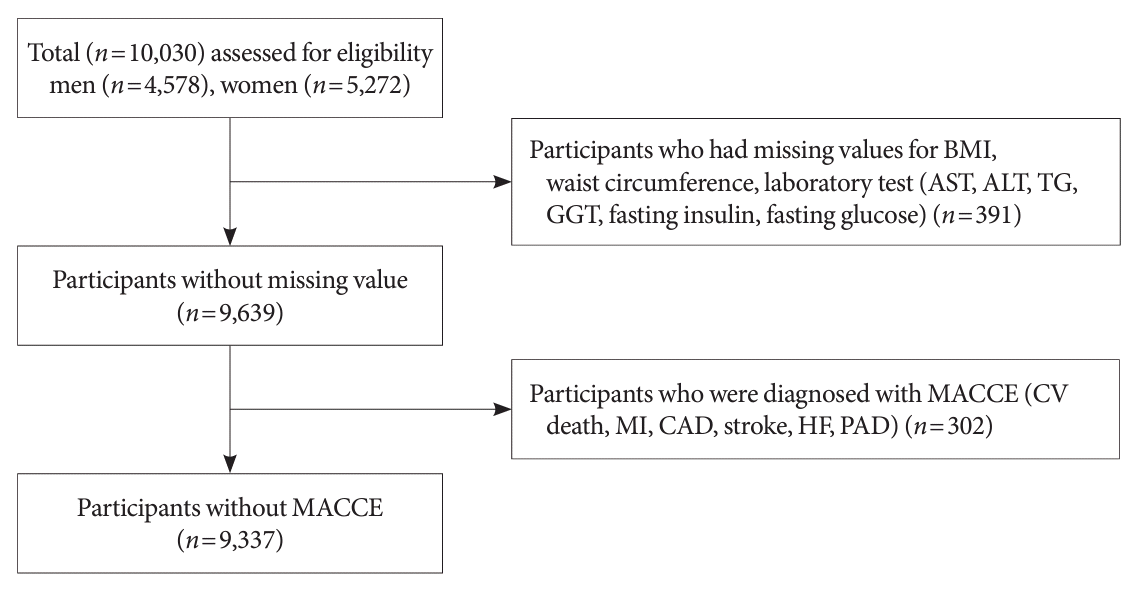
Fig. 1.
Study population. BMI, body mass index; AST, aspartate aminotransferase; ALT, alanine aminotransferase; TG, triglyceride; GGT, gamma-glutamyl transferase; MACCE, major adverse cardiac and cerebrovascular events; CV, cardiovascular; MI, myocardial infarction; CAD, coronary artery disease; HF, heart failure; PAD, peripheral artery disease.
![]()
The study protocol adhered to the principals of the Declaration of Helsinki and was reviewed and approved by the Korean National Research Institute of Health and Institutional Review Board of Hanyang University Guri Hospital (IRB No. GURI-2023-06-020). Written informed consent by the patients was waived due to a retrospective nature of our study.
Data collection
Patient demographic and clinical characteristics that were extracted included age, sex, BMI, waist circumference, systolic blood pressure (SBP), diastolic blood pressure (DBP), income level, education level, smoking status, alcohol consumption status, physical activity, and medical history of traditional CV risk. In addition, key laboratory findings related to metabolic syndrome, including the estimated glomerular filtration rate and fasting glucose, glycosylated hemoglobin, total cholesterol, TG, high-density lipoprotein cholesterol (HDL-C), and low-density lipoprotein cholesterol levels. In order to compute the 10-year risk score for atherosclerotic cardiovascular disease (ASCVD), we also gathered data on the use of antihypertensive therapy [30].
Study outcomes
The primary outcome was the incidence of MACCE identified during the follow-up (median, 15.5 years; interquartile range [IQR], 8.3 to 15.8). MACCE were defined as the composite outcome consisting of CV death, MI, CAD, stroke, HF, and PAD. Information on CV related death, MI, CAD, stroke, HF, and PAD during follow-up was obtained. CV related death was defined according to the International Classification of Diseases 10th Revision (ICD-10) codes I20–I82 (including ischemic heart disease, HF, ventricular arrhythmia, pulmonary thromboembolism, and ischemic and hemorrhagic stroke) using the Korean national database for the causes of death registered in the Korean National Statistics Office. Additionally, data were collected using an on-site interview questionnaire to ascertain the incidence of recent MI, CAD, stroke, HF, and PAD during biennial visits. MI was defined as a clinical emergency where the patient recalled experiencing a heart attack episode that necessitated hospitalization or revascularization [31]. CAD was defined as requiring hospitalization or revascularization, excluding any incidents of MI recalled by the patient. Stroke was defined as a clinical emergency where the patient remembered experiencing sudden paralysis, language impairment, or stroke that required hospitalization. HF was defined as any clinical event that the patient recalled requiring hospitalization. PAD was defined as a clinical event that the patient recalled requiring revascularization.
Metabolic index calculation
We calculated the indices for metabolic syndrome, including the metabolic syndrome component (0–5), metabolic syndrome severity score, and metabolic syndrome severity Z-score. For NAFLD, we calculated indices including the hepatic steatosis index, fatty liver index, NAFLD liver fat score, and fibrosis-4 index. For IR, we calculated the indices including the TG index, homeostatic model assessment of insulin resistance (HOMA-IR), and metabolic score for IR (METS-IR).
Components of metabolic syndrome were investigated according to the modified National Cholesterol Education Program, Adult Treatment Panel III (NCEP ATP-III) criteria [13], including the following: (1) abdominal obesity (waist circumference >90 cm for men and >85 cm for women according to the Korean Society of Obesity) [32]; (2) hypertriglyceridemia (serum TG concentration of ≥150 mg/dL); (3) low HDL-C (serum HDL-C <40 mg/dL for men or <50 mg/dL for women); (4) hypertension (SBP >130 mm Hg, DBP >85 mm Hg or treatment with antihypertensive drugs); and (5) high fasting blood glucose (fasting serum glucose >100 mg/dL or previous diagnosis of type 2 diabetes mellitus). The metabolic syndrome severity score considers the weighted contribution of each of the five traditional metabolic syndrome components based on sex- and age-specific criteria; this formulation method has been previously reported in a study [15]. In this study, a formula validated for the Koreans was used [7,33] and the metabolic syndrome severity score was expressed as a Z-score.
The formula for the hepatic steatosis index, which is a validated index for detecting NAFLD, included 8×ALT/AST ratio+ BMI. Additional points (+2) were given if the patient had diabetes mellitus or was female [34]. The fatty liver index, which consists of BMI, waist circumference, TG, and GGT, is a validated index used in clinical practice for identifying hepatic steatosis [35]. The equation for this index is as follows:
e0.953×loge (TG)+0.319×BMI+0.718×loge (GGT)+0.053×waist circumference–15.74581+e0.953×loge (TG)+0.319×BMI+0.718×loge (GGT)+0.053×waist circumference–15.7458 ×100
The NAFLD liver fat score, which is also a validated index for identifying NAFLD was calculated as follows: –2.89+1.18×metabolic syndrome (yes=1/no=0)+0.45×type 2 diabetes mellitus (yes=2/no=0)+0.15×insulin (mU/L)+0.04×AST (U/L)–0.94×AST/ALT. The fibrosis-4 index is a validated index for predicting hepatic fibrosis was calculated by multiplying age with AST level (U/L) [36]. The triglyceride-glucose index (TyG) was calculated as ln (fasting TG×fasting glucose/2) [37]. The HOMA-IR was calculated using the following formula: (fasting insulin [U/L]×fasting glucose [mg/dL])/405 [33]. The METS-IR is a metabolic index that quantifies IR [38] and was calculated using the following formula:
Statistical analyses
All categorical data were expressed as frequencies and percentages, and continuous variables were presented as means, standard deviations, medians, and IQR. Univariate analysis followed by multivariate Cox proportional hazards regression analyses was performed to evaluate the MACCE predictability for each metabolic index during follow-up, after adjusting for individual risk factors. Model 1 was adjusted for age (per 1 year) and sex, and model 2 was adjusted for the variables in model 1 as well as BMI, smoking status, alcohol consumption status, physical activity (per 1 METs-hr/wk), income level, and education level. In addition to the adjustments for the variables in model 2, model 3 was further adjusted for medical history, including hypertension, diabetes mellitus, dyslipidemia, and chronic kidney disease. The analysis was conducted by classifying the cutoff values and tertiles 1, 2, and 3 for each index. To determine the optimal cutoff value for each metabolic index in predicting MACCE, we conducted time-dependent receiver operating characteristic (ROC) curve analyses. Additionally, we measured the area under the receiver operating characteristic curve (AUC) to evaluate the predictability of MACCE for metabolic, NAFLD, and IR index, and the DeLong test was used to compare the performance between each index. Furthermore, we evaluated the predictability of MACCE using the established cut-off values for detecting liver fibrosis and hepatic steatosis as suggested in the NAFLD guidelines (hepatic steatosis index, fatty liver index, NAFLD liver fat score, and fibrosis-4 index) [34,39-41]. To evaluate the additional value of combining the metabolic syndrome severity Z-score and other metabolic indices, we analyzed the changes in the additive predictive value when adding other NAFLD or IR indices to the metabolic syndrome severity score with the highest AUC. Statistical significance was set at P<0.05. All analyses were performed using the open-source statistical software R version 4.2.2 (www.R-project.org, accessed on 31 October 2022) and R-studio version 2022.12.0+353 (www.rstudio.com, accessed on 03 December 2022). Various statistical packages, including tableone, timeROC, ggplot2, and rms were used for the analyses.
RESULTS
Baseline characteristics
A total of 9,337 patients with an average age of 52 years were analyzed, among whom, 4,407 (47.2%) were male patients, and 50% had an income level above the median. The prevalence of previously diagnosed CV risk factors was low; specifically, 955 patients (10.2%) had hypertension, 200 patients (2.1%) had diabetes mellitus, and 33 patients (0.4%) had hyperlipidemia. Table 1 presents the various metabolic indices, including the metabolic syndrome severity Z-score, metabolic syndrome severity score, hepatic steatosis index, fatty liver index, NAFLD liver fat score, fibrosis-4 index, TyG index, HOMA-IR, and METS-IR. The mean metabolic syndrome severity score was 0.575±1.007, and the mean metabolic syndrome severity Z-score was –0.000 00003030413±0.9999465. Additionally, 2,448 (26.2%) patients had three or more components of the metabolic syndrome, with 744 (8.0%) having four components and 181 (1.9%) having five components.
Table 1.
Baseline characteristics
Values are presented as mean±standard deviation or number (%).
IQR, interquartile range; METS, metabolic score; eGFR, estimated glomerular filtration rate; HDL-C, high-density lipoprotein cholesterol; LDL-C, low-density lipoprotein cholesterol; NAFLD, nonalcoholic fatty liver disease; TyG, triglyceride glucose index; HOMA-IR, homeostatic model assessment for insulin resistance; METS-IR, metabolic score for insulin resistance.
![]()
MACCE predictability for each metabolic index
The median follow-up period was 15.5 years (IQR, 8.3 to 15.8). Of the 9,337 patients, 1,130 (12.1%) experienced MACCE during the follow-up period, with 623 (6.7%) experiencing MACCE specifically during the 10-year follow-up period. Table 2 presents the quantitative evaluation of the 10-year MACCE risk by categorizing each metabolic index into cutoff and tertile values. All indices revealed significant hazard ratios (HRs) for predicting MACCE at values greater than the cutoff point. However, the results of the HRs varied after adjusting for each variable in models 1, 2, and 3. The metabolic syndrome severity Z-score, metabolic syndrome severity score, hepatic steatosis index, and NAFLD liver fat score significantly predicted MACCE at values greater than the cutoff point and in the second and third tertiles. Among them, the metabolic syndrome severity score and metabolic syndrome severity Z-score had the highest HRs (HR, 1.794; 95% confidence interval [CI], 1.507 to 2.135 [model 3]; HR, 1.730; 95% CI, 1.463 to 2.044 [model 3]). In addition, the HRs significantly increased in predicting MACCE as the number of metabolic syndrome components increased. In particular, even with one metabolic component, MACCE showed a 37% increase after 10 years (HR, 1.563; 95% CI, 1.108 to 1.705). Moreover, when the metabolic components increased to four and five, the HRs for model 3 were 1.981 (95% CI, 11.536 to 2.554) and 2.546 (95% CI, 1.771 to 3.661) respectively, indicating an association with the number of components. However, the fibrosis-4 index did not significantly predict MACCE, even when the index value exceeded the tertile after adjusting for multiple variables. Furthermore, the fatty liver index, TyG index, HOMA-IR, and METS-IR scores were only able to significantly predict MACCE when the score increased above the tertile after adjusting for multiple variables. Building on the analysis, further evaluation of MACCE predictability was conducted using the established cut-off values for detecting liver fibrosis and hepatic steatosis, as suggested in the NAFLD guidelines. This additional analysis, presented in Supplementary Table 1, includes the hepatic steatosis index, fatty liver index, NAFLD liver fat score, and fibrosis-4 index. While the results varied across the indices and models, a general trend emerged where higher index values were associated with increased HRs for MACCE. However, as the result of analysis using the cut-off value derived from the timeROC curve and tertile value, the fibrosis-4 index did not significantly predict MACCE even if it exceeded the cut-off value presented in the guidelines for fibrosis detection.
Table 2.
Comprehensive index for predicting MACCE using the Cox-regression analysis
| Variable |
Hazard ratios (95% confidence interval) |
|||
|---|---|---|---|---|
| Unadjusted | Model 1a | Model 2b | Model 3c | |
| Metabolic syndrome component | ||||
| ≥3 | 1.938 (1.720–2.183) | 1.624 (1.438–1.834) | 1.463 (1.274–1.679) | 1.309 (1.135–1.510) |
| Metabolic syndrome component | ||||
| 0 | Reference | Reference | Reference | Reference |
| 1 | 1.662 (1.349–2.047) | 1.436 (1.165–1.770) | 1.397 (1.125–1.735) | 1.374 (1.108–1.705) |
| 2 | 2.088 (1.697–2.569) | 1.654 (1.342–2.038) | 1.610 (1.289–2.011) | 1.563 (1.259–1.940) |
| 3 | 2.733 (2.212–3.376) | 2.093 (1.690–2.591) | 1.935 (1.531–2.446) | 1.819 (1.453–2.276) |
| 4 | 3.520 (2.783–4.451) | 2.441 (1.923–3.098) | 2.236 (1.710–2.924) | 1.981 (1.536–2.554) |
| 5 | 4.617 (3.282–6.496) | 3.319 (2.351–4.686) | 3.090 (2.132–4.479) | 2.546 (1.771–3.660) |
| Metabolic syndrome severity Z-score | ||||
| Cut-off value of score | ||||
| >–0.046 | 1.974 (1.748–2.230) | 1.645 (1.455–1.861) | 1.539 (1.330–1.781) | 1.489 (1.306–1.698) |
| Tertiles of score | ||||
| Tertile 1 (–2.612 to –0.473) | Reference | Reference | Reference | Reference |
| Tertile 2 (–0.473 to 0.363) | 1.577 (1.338–1.859) | 1.363 (1.156–1.608) | 1.376 (1.160–1.633) | 1.321 (1.113–1.569) |
| Tertile 3 (0.363 to 9.359) | 2.451 (2.102–2.858) | 1.931 (1.653–2.256) | 2.000 (1.703–2.348) | 1.730 (1.463–2.044) |
| Metabolic syndrome severity score | ||||
| Cut-off value of score | ||||
| >0.997 | 1.990 (1.770–2.237) | 1.816 (1.599–2.063) | 1.695 (1.461–1.967) | 1.513 (1.298–1.764) |
| Tertiles of score | ||||
| Tertile 1 (–2.306 to 0.116) | Reference | Reference | Reference | Reference |
| Tertile 2 (0.116 to 0.922) | 1.234 (1.049–1.451) | 1.261 (1.068–1.487) | 1.343 (1.131–1.593) | 1.298 (1.093–1.541) |
| Tertile 3 (0.922 to 10.309) | 2.166 (1.870–2.510) | 2.008 (1.708–2.359) | 2.083 (1.762–2.463) | 1.794 (1.507–2.135) |
| Hepatic steatosis index | ||||
| Cut-off value of score | ||||
| >31.295 | 1.217 (1.075–1.377) | 1.416 (1.247–1.607) | 1.292 (1.087–1.537) | 1.204 (1.011–1.434) |
| Tertiles of score | ||||
| Tertile 1 (17.185 to 30.778) | Reference | Reference | Reference | Reference |
| Tertile 2 (30.778 to 34.700) | 1.078 (0.929–1.251) | 1.248 (1.074–1.451) | 1.296 (1.109–1.514) | 1.199 (1.025–1.403) |
| Tertile 3 (34.700 to 55.771) | 1.294 (1.121–1.494) | 1.603 (1.383–1.857) | 1.702 (1.461–1.983) | 1.464 (1.250–1.715) |
| Fatty liver index | ||||
| Cut-off value of score | ||||
| >30.421 | 1.647 (1.465–1.852) | 1.531 (1.360–1.723) | 1.454 (1.245–1.698) | 1.421 (1.253–1.611) |
| Tertiles of score | ||||
| Tertile 1 (0.600 to 15.390) | Reference | Reference | Reference | Reference |
| Tertile 2 (15.390 to 40.114) | 1.405 (1.202–1.643) | 1.235 (1.056–1.445) | 1.240 (1.054–1.458) | 1.167 (0.991–1.374) |
| Tertile 3 (40.114 to 99.117) | 1.878 (1.619–2.179) | 1.681 (1.447–1.953) | 1.752 (1.500–2.045) | 1.523 (1.298–1.787) |
| NAFLD liver fat score | ||||
| Cut-off value of score | ||||
| >1.576 | 1.657 (1.472–1.864) | 1.531 (1.360–1.725) | 1.443 (1.240–1.681) | 1.393 (1.227–1.582) |
| Tertiles of score | ||||
| Tertile 1 (–5.032 to –0.806) | Reference | Reference | Reference | Reference |
| Tertile 2 (–0.806 to 3.585) | 1.424 (1.217–1.667) | 1.265 (1.080–1.482) | 1.246 (1.058–1.468) | 1.183 (1.003–1.395) |
| Tertile 3 (3.585 to 38.000) | 1.982 (1.707–2.300) | 1.780 (1.531–2.069) | 1.835 (1.572–2.143) | 1.588 (1.352–1.865) |
| Fibrosis-4 index | ||||
| Cut-off value of score | ||||
| >1.164 | 1.765 (1.571–1.984) | 0.980 (0.860–1.117) | 1.047 (0.915–1.198) | 1.073 (0.938–1.228) |
| Tertiles of score | ||||
| Tertile 1 (0.281 to 0.856) | Reference | Reference | Reference | Reference |
| Tertile 2 (0.856 to 1.193) | 1.257 (1.073–1.472) | 0.850 (0.721–1.002) | 0.869 (0.733–1.030) | 0.872 (0.735–1.033) |
| Tertile 3 (1.193 to 50.836) | 2.022 (1.747–2.341) | 0.888 (0.748–1.053) | 0.968 (0.811–1.154) | 0.996 (0.835–1.187) |
| TyG index | ||||
| Cut-off value of score | ||||
| >8.716 | 1.499 (1.334–1.685) | 1.384 (1.231–1.556) | 1.292 (1.139–1.465) | 1.212 (1.067–1.376) |
| Tertiles of score | ||||
| Tertile 1 (7.148 to 8.370) | Reference | Reference | Reference | Reference |
| Tertile 2 (8.370 to 8.878) | 1.418 (1.215–1.655) | 1.211 (1.037–1.414) | 1.121 (0.954–1.319) | 1.099 (0.935–1.293) |
| Tertile 3 (8.878 to 11.716) | 1.781 (1.535–2.065) | 1.545 (1.330–1.793) | 1.399 (1.192–1.641) | 1.288 (1.095–1.514) |
| HOMA-IR | ||||
| Cut-off value of score | ||||
| >1.566 | 1.370 (1.218–1.540) | 1.462 (1.299–1.645) | 1.377 (1.213–1.563) | 1.306 (1.150–1.484) |
| Tertiles of score | ||||
| Tertile 1 (0.018 to 1.235) | Reference | Reference | Reference | Reference |
| Tertile 2 (1.235 to 1.923) | 0.981 (0.844–1.139) | 1.071 (0.921–1.244) | 1.085 (0.929–1.268) | 1.079 (0.924–1.261) |
| Tertile 3 (1.923 to 59.107) | 1.331 (1.156–1.532) | 1.445 (1.253–1.666) | 1.365 (1.170–1.593) | 1.273 (1.089–1.487) |
| METS-IR | ||||
| Cut-off value of score | ||||
| >35.311 | 1.440 (1.275–1.627) | 1.462 (1.294–1.652) | 1.425 (1.198–1.695) | 1.404 (1.232–1.600) |
| Tertiles of score | ||||
| Tertile 1 (19.605 to 33.507) | Reference | Reference | Reference | Reference |
| Tertile 2 (33.507 to 39.308) | 1.126 (0.967–1.311) | 1.176 (1.009–1.370) | 1.243 (1.060–1.456) | 1.173 (0.999–1.376) |
| Tertile 3 (39.308 to 71.416) | 1.520 (1.317–1.755) | 1.595 (1.381–1.841) | 1.707 (1.470–1.983) | 1.487 (1.274–1.736) |
MACCE, major adverse cardiovascular and cerebrovascular events; NAFLD, nonalcoholic fatty liver disease; TyG, triglyceride-glucose index; HOMA-IR, homeostatic model assessment of insulin resistance; METS-IR, metabolic score for insulin resistance.
![]()
Fig. 2 presents the time-dependent ROC curve for MACCE and the MACCE predictive power of each index. The 10-year ASCVD score was observed to be the most effective index for predicting MACCE over 10 years in a general population, with an AUC value of 0.716 and a sensitivity and specificity of 0.768 and 0.546, respectively. The metabolic syndrome severity Z-score had an AUC value of 0.619, a cut-off value of –0.046, and a sensitivity and specificity of 0.661 and 0.522, respectively, for predicting MACCE over 10 years. The metabolic syndrome severity Z-score revealed an AUC value close to that of the 10-year ASCVD score for predicting MACCE. Other scores or indices related to NAFLD, in the order of fibrosis-4 index (AUC, 0.594), NAFLD liver fat score (AUC, 0.588), fatty liver index (AUC, 0.585), and hepatic steatosis index (AUC, 0.528), also exhibited AUC levels <0.6 for MACCE prediction (Fig. 2). Additionally, indices related to IR, in the order of TyG index, METS-IR, and HOMA-IR, revealed an AUC of <0.6. The 10-year ASCVD score and metabolic syndrome severity Z-score were significantly different from all other indices, except for the fibrosis-4 index, when comparing the AUC values of each index. A comparison of the indices is presented in Supplementary Table 2. Similarly, the predictive power of MACCE for each metabolic index demonstrated a consistent pattern in time-dependent ROC curves throughout 14 and 16 years of follow-up period (Supplementary Fig. 1).
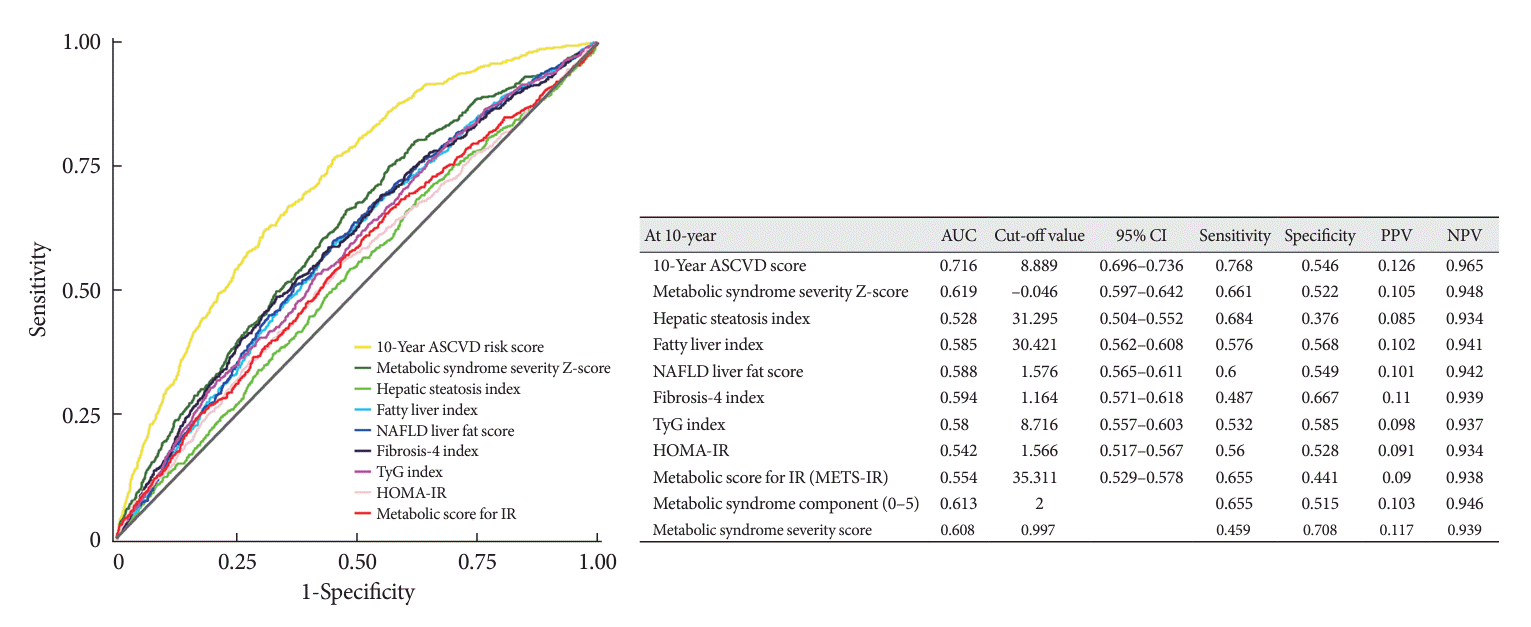
Fig. 2.
Time-dependent receiver operating characteristic (ROC) curve for major adverse cardiac and cerebrovascular events (MACCE) for each index. ASCVD, atherosclerotic cardiovascular disease; NAFLD, non-alcoholic fatty liver disease; TyG, triglycerides; HOMA-IR, homeostatic model assessment of insulin resistance; AUC, area under the receiver operating characteristic curve; CI, confidence interval; PPV, positive predictive value; NPV, negative predictive value.
![]()
Additional value of combining the metabolic syndrome severity Z-score and other metabolic indices
Among the metabolic indices, both the hepatic steatosis index and METS-IR revealed a significant increase in AUC for predicting MACCE when added to the metabolic syndrome severity Z-score, indicating an additive value (Fig. 3). Combining the metabolic syndrome severity Z-score and hepatic steatosis index resulted in an AUC of 0.634, which was significantly higher than the AUC of metabolic syndrome severity Z-score alone (P<0.001). Combining the metabolic syndrome severity Z-score and METS-IR resulted in an AUC value of 0.641 (P<0.001). Combining the metabolic syndrome severity Zscore, hepatic steatosis index, and METS-IR resulted in an AUC of 0.641, which revealed significantly better MACCE predictability than that obtained from all other combinations, except for the combination of the metabolic syndrome severity Z-score and METS-IR (P values are presented in Supplementary Table 3).
DISCUSSION
Among the Korean population aged 40 to 69 years, with unknown MACCE, 2,448 (26.2%) experienced metabolic syndrome according to the modified NCEP ATP-III criteria, of which 1,130 (12.1%) experienced MACCE during the follow-up period and 623 (6.7%) experienced MACCE specifically during the 10-year follow-up period. Metabolic syndrome severity score and Z-score were strongly associated with risk of MACCE occurrence. The hepatic steatosis index and NAFLD liver fat score also demonstrated an independent association with the risk of MACCE occurrence; however, other NAFLD and IR indices varied depending on whether they were in the second or third tertile range, after adjusting for confounding factors. Additionally, when comparing the predictive value of the 10-year ASCVD risk score and the indices for metabolic syndrome, NAFLD, and IR indices for MACCE over 10 years, the 10-year ASCVD risk score demonstrated superior predictive power compared to those of the other indices. The metabolic severity Z-score, with an AUC of 0.619, was observed to have the closest predictive power to the 10-year ASCVD risk score compared to that of the other predictors. Among the NAFLD indices, fibrosis-4 index, demonstrated the highest predictive power for MACCE, followed by the IR index. Additionally, the TyG index demonstrated the highest predictive power among the IR indices, although its AUC was <0.6. Moreover, the combination of the hepatic steatosis index and METS-IR with the metabolic syndrome severity Z-score demonstrated an additional value in predicting MACCE. This combination demonstrated significantly improved predictability for MACCE compared to that of the other combinations.
Metabolic syndrome is an important health concern in the general population, and its prevalence is increasing worldwide [1,11,42]. The 2021 Metabolic Syndrome Fact Sheet in Korea highlights a dramatic increase in the prevalence of metabolic syndrome since 2015, with approximately 23% of adults aged ≥19 years and approximately 50% of adults aged ≥65 years reported to have developed metabolic syndrome [43]. The diagnostic criteria for metabolic syndrome have traditionally been based on the ATP-III criteria, and metabolic syndrome is identified only when abnormalities beyond the cut-offs for the three yes-or-no components are present [13]. To provide personalized treatment for individuals with metabolic syndrome, continuous variables are needed to evaluate CV outcomes in patients with metabolic syndrome. Moreover, considering the challenge of applying uniform criteria across different races, metabolic syndrome severity score formulas have been proposed to classify patients based on their sex and race [15,44]. Recently, a metabolic syndrome severity score has been developed in Korea using data from the Korean National Health and Nutrition Examination Survey, which incorporates severity scores developed in the Western population [7,33]. These metabolic syndrome severity scores can be an independent predictors of CVD in Korean middle-aged adults [7]. In our study, we determined that metabolic syndrome indices, including the metabolic syndrome severity score and metabolic syndrome components, were useful in predicting the 10-year MACCE. As the metabolic syndrome diagnostic criteria used in our study were based on the Asian criteria (modified NCEP ATP-III criteria) [13], our findings aligned with those of previous studies demonstrating a strong association between metabolic syndrome severity score and the risk of developing coronary heart disease, MI, and stroke [7,45]. According to the results of our study, which categorized metabolic syndrome indices into cut-off values and tertiles to predict MACCE using HRs, we observed significant association between the metabolic syndrome severity Z-score, metabolic syndrome severity score, and metabolic syndrome components with an increased risk of MACCE, as their values exceeded the cut-off or upper tertile even after adjusting for prognostic variables. These results highlight the predictive power of these metabolic syndrome-related indices for MACCE over a 10-year period. Notably, even with the presence of one metabolic syndrome component, the risk of MACCE increased by 37% over a 10-year period. Moreover, the risk of MACCE increases with an increase in the number of metabolic syndrome components. Interestingly, the predictive power of the dichotomous criterion for metabolic syndrome component was not inferior to that of the metabolic syndrome severity Z-score, with an AUC of 0.613 and a sensitivity and specificity of 0.655 and 0.515, respectively, suggesting the need to investigate and manage individual risk factors for metabolic syndrome.
The 10-year ASCVD score is a well-known predictor of adverse CV events. In our study, it was the most useful indicator for predicting MACCE events (AUC, 0.716) in the general population, with a sensitivity and specificity of 0.768 and 0.546, respectively. Nonetheless, the metabolic syndrome severity score exhibited the closest predictive power to the 10-year ASCVD score, and no previous research has conducted a comparative study of these two scores for adverse CV outcomes. Due to the complexity of the 10-year ASCVD risk score calculation, which includes variables such as sex, age, total cholesterol, HDL-C, SBP, use of antihypertensive therapy, diabetes mellitus, and smoking history, its application is challenging in busy clinical settings. In contrast, the metabolic syndrome severity score and number of metabolic syndrome components may provide a straightforward screening tool for predicting long-term CV outcomes in patients with relatively low-risk conditions. These findings underscore the significance of the metabolic syndrome severity score as a valuable tool for assessing and evaluating metabolic syndrome.
NAFLD and IR are involved in the pathophysiology of metabolic syndrome. They share common underlying process and are important factors in the development of adverse CV outcomes [9,46]. Several indices for assessing NAFLD and IR include the hepatic steatosis index, fatty liver index, NAFLD liver fat score, fibrosis-4 index, TyG index, HOMA-IR, and METS-IR. Previous studies have demonstrated that these indices, reflecting NAFLD and IR, can predict CV risk [18-27]. However, our study revealed that all these indices had lower power than metabolic syndrome indices in predicting 10-year MACCE, with some indices demonstrating significant predictive ability only when the values exceeded the upper tertile for predicted the 10-year MACCE. The hepatic steatosis index and NAFLD liver fat score also demonstrated statistically significant HRs; however, these values were lower than those of the metabolic severity score. The fatty liver index, TyG index, HOMA-IR, and METS-IR demonstrated independent predictive significance only in the upper tertile group, and their HR values were smaller than those of the metabolic severity score. Additionally, when evaluating the additional value of the combination of the metabolic syndrome severity Z-score and other metabolic indices, the predictive power for MACCE significantly increased by incorporating the hepatic steatosis index and METS-IR to the metabolic syndrome severity Z-score. Combining NAFLD, IR indices and metabolic syndrome severity Z-score could serve as a screening tool for predicting CV outcomes in the general population. Furthermore, evaluation of their additive value could offer substantial background information for the development of a more precise risk-scoring system, thereby contributing to the advancement in clinical practice.
Each index for metabolic syndrome, NAFLD, and IR has its own characteristics and limitations. In specific patient populations including those with hypertension, diabetes mellitus, dyslipidemia, obesity, and conditions like NAFLD and IR, the metabolic syndrome severity score may exhibit superior predictive ability compared to those of other metabolic syndrome indicators. Nevertheless, the predictive accuracy is lower when compared to validated scoring systems, such as the ASCVD score. This result suggested that despite the growing interest in NAFLD and IR as emerging indices, their application as standalone predictors in the actual clinical setting for predicting CVD could have limitations. However, these indices hold significance in stratifying high-risk groups for primary prevention. Therefore, further research is necessary to develop a more realistic scoring system and predictive tools using these indices, as well as to explore the role of these metabolic indices in stratifying high-risk groups for CVD in populations with hypertension, diabetes mellitus, dyslipidemia, and obesity.
This study has several limitations. First, our analysis focused on the predictive power of various metabolic, NAFLD, and IR indices for a 10-year MACCE, even though the Ansan-Ansung cohort data encompasses a median follow-up period of 15.5 years (IQR, 8.3 to 15.8). This was done because it allows a direct comparison with the 10-year ASCVD risk score. Moreover, previous studies did not conduct a comparative analysis between different indices of metabolic syndromes, IR, and fatty liver for predicting CVD; thus justifying the adjustment of the time period for analysis. Additionally, we presented a time-dependent ROC curve for MACCE of each index at 14- and 16-year follow-ups in the Supplementary Fig. 1, except for the 10-year ASCVD risk score. Second, this study had certain limitations due to the inadequate consideration of potential confounding factors, which could have affected the relationship between metabolic indices and MACCE. Furthermore, the observed associations may have been influenced by factors, such as genetic predisposition, socioeconomic status, dietary habits, and medication use, which were not sufficiently accounted for in the present study. Third, although the NAFLD indices—hepatic steatosis index, fatty liver index, NAFLD liver fat score, and fibrosis-4 index—have validated cut-off values in the guidelines for detecting liver fibrosis and hepatic steatosis, our study employed a different approach for predicting MACCE. We utilized the cut-off value and the tertile value derived from the timeROC curve analysis. This approach acknowledges that the optimal cut-off values of the same index may vary depending on the predicted outcomes. Finally, the number of CV outcomes, except CV mortality, may have been underestimated due to exclusion from subsequent assessments, which is a limitation of the cohort data. However, the utilization of the Korean national database to determine the cardiac-related cause of death ensured that the number of patient who died was accurately reflected in this study.
In conclusion, the metabolic syndrome severity score and its components, along with certain indices for NAFLD and IR, demonstrated predictive value for long-term CV events in a middle-aged Korean population. Although the 10-year ASCVD risk score demonstrated the highest predictive power, the metabolic syndrome severity score exhibited the closest predictive ability among the metabolic indices assessed. Moreover, incorporating the representative indices of NAFLD and IR into the metabolic syndrome severity score may create a more realistic scoring system that considers the distinct characteristics and limitations of each index.
 XML Download