INTRODUCTION
MATERIALS AND METHODS
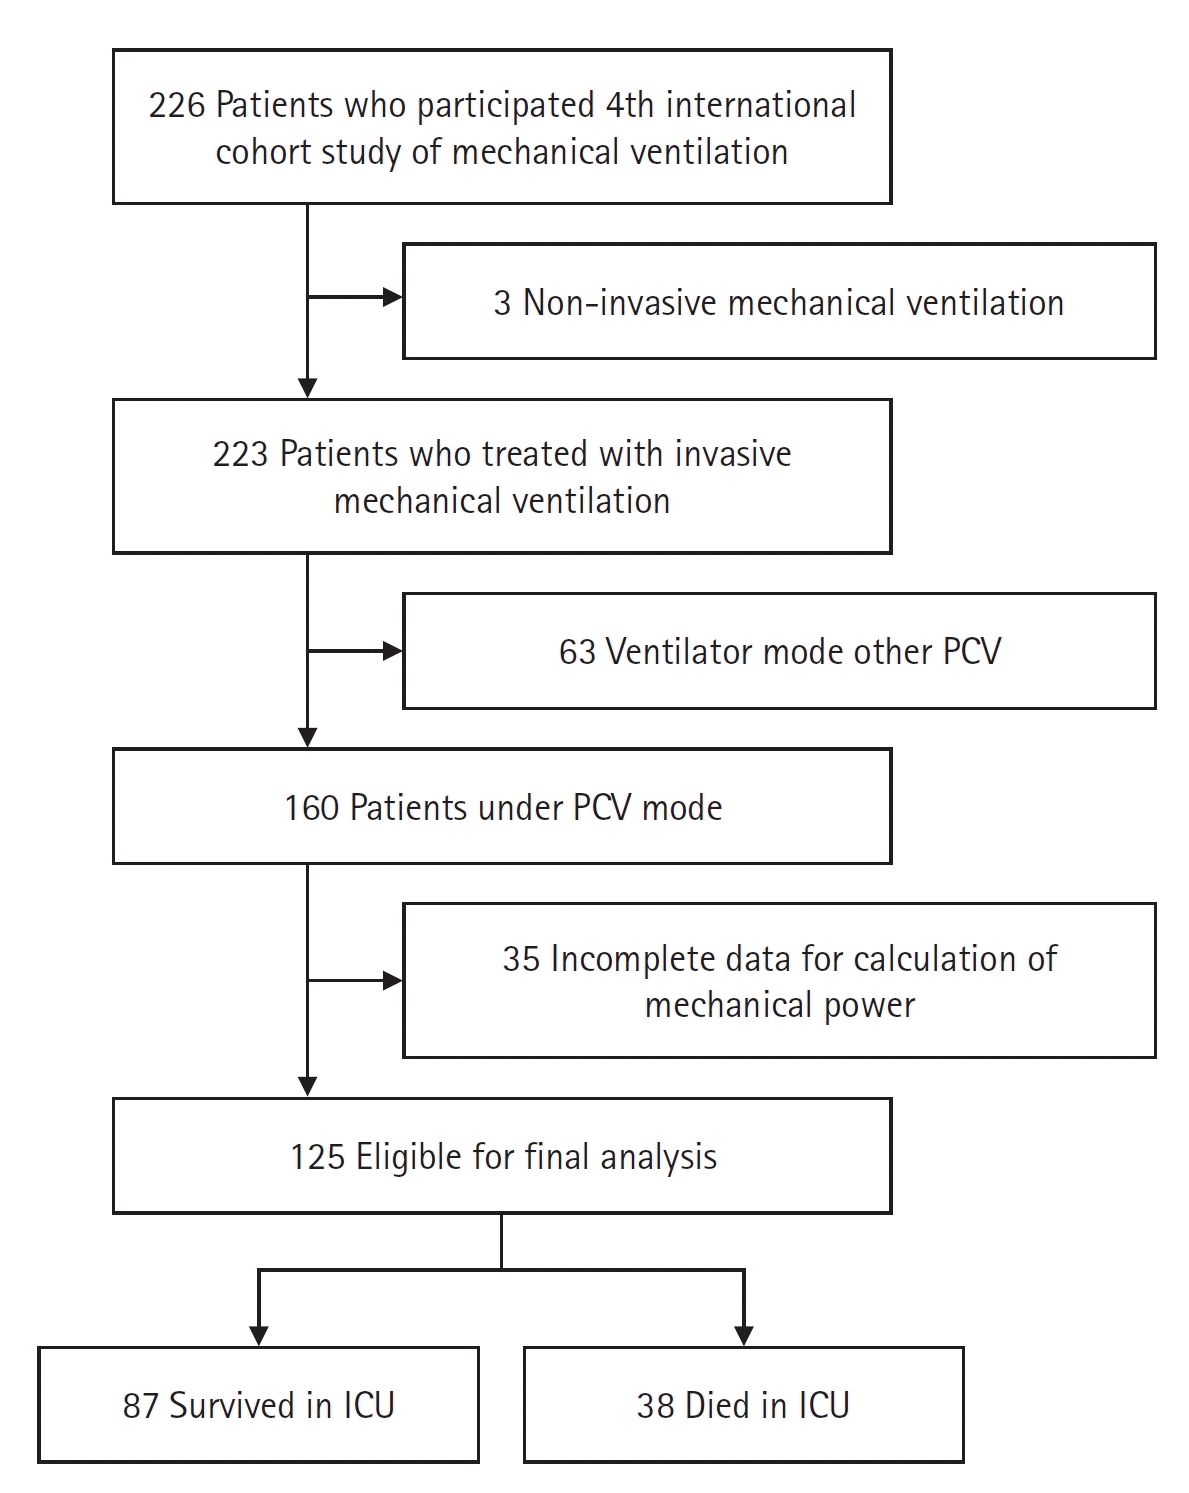
Design and Population
Data Collection Time
Calculation of MP
Statistical Analysis
RESULTS
Table 1.
| Variable | All (n=125) | Survivor (n=87) | Non-survivor (n=38) | P-value |
|---|---|---|---|---|
| Age (yr) | 68 (57–78) | 68 (58–78) | 66 (55–75) | 0.425 |
| Male | 83 (66.4) | 58 (66.7) | 25 (65.8) | 0.924 |
| Weight (kg) | 60.0 (50.0–68.0) | 60.0 (49.0–68.0) | 60.0 (53.0–68.5) | 0.531 |
| Height (cm) | 165.0 (158.0–170.0) | 164.0 (157.0–170.0) | 165.5 (159.8–170.0) | 0.503 |
| BMI (kg/m2) | 22.0 (19.0–24.0) | 22.0 (19.0–25.0) | 22.0 (20.0–24.0) | 0.851 |
| SAPS II | 50 (40–61) | 50 (42–63) | 48.5 (36–60) | 0.205 |
| Primary reason for mechanical ventilationa) | 0.435 | |||
| Acute on chronic respiratory failure | 8 (7.3) | 5 (6.7) | 3 (8.6) | |
| COPD | 4 (3.6) | 3 (4) | 1 (2.9) | |
| Asthma | 2 (1.8) | 2 (2.7) | 0 | |
| Other chronic respiratory disease | 2 (1.8) | 0 | 2 (5.7) | |
| Acute respiratory failure | 91 (82.7) | 60 (80) | 31 (88.6) | |
| ARDS | 6 (5.5) | 2 (2.7) | 4 (11.4) | |
| Postoperative | 0 | 0 | 0 | |
| Congestive heart failure | 11 (10.0) | 9 (12.0) | 2 (5.7) | |
| Aspiration | 14 (12.7) | 12 (16) | 2 (5.7) | |
| Pneumonia | 30 (27.3) | 16 (21.3) | 14 (40) | |
| Sepsis | 20 (18.2) | 12 (16) | 8 (22.9) | |
| Trauma | 1 (0.9) | 1 (1.3) | 0 | |
| Cardiac arrest | 5 (4.5) | 5 (6.7) | 0 | |
| Other acute respiratory failure | 4 (3.6) | 3 (4) | 1 (2.9) | |
| Coma | 9 (8.2) | 8 (10.7) | 1 (2.9) | |
| Neuromuscular disease | 2 (1.8) | 2 (2.7) | 0 | |
| pHb) | 7.36 (7.29–7.45) | 7.38 (7.29–7.46) | 7.34 (7.27–7.41) | 0.230 |
| PaCO2 (mm Hg)b) | 39.0 (31.0–46.0) | 38.0 (31.0–51.0) | 40.0 (31.0–43.3) | 0.642 |
| PaO2 (mm Hg)b) | 87.0 (68.5–116.5) | 85.0 (67.0–120.0) | 89.5 (77.8–114.5) | 0.239 |
| PaO2/FiO2 ratiob) | 157 (106–230) | 165 (114–256) | 137 (95–211) | 0.105 |
| Analgesicb) | 98 (78.4) | 63 (72.4) | 35 (92.1) | 0.014 |
| Sedativeb) | 86 (68.8) | 57 (65.5) | 29 (76.3) | 0.231 |
| NMBAb) | 19 (15.2) | 10 (11.5) | 9 (23.7) | 0.081 |
Values are presented as median (interquartile range) or number (%).
BMI: body mass index; SAPS: Simplified Acute Physiology Score; COPD: chronic obstructive pulmonary disease; ARDS: acute respiratory distress syndrome; PaCO2: partial pressure of carbon dioxide; PaO2: partial pressure of oxygen; FiO2: fraction of inspired oxygen; NMBA: neuromuscular blocking agent.
Table 2.
| Variable | All (n=125) | Survivor (n=87) | Non-survivor (n=38) | P-value |
|---|---|---|---|---|
| Mechanical power (J/min) | 21.7 (14.3–26.6) | 17.6 (12.7–23.7) | 26.3 (20.7–33.9) | <0.001 |
| VT/PBW (ml/kg) | 7.2 (6.2–8.7) | 7.0 (6.0–8.1) | 8.2 (6.6–9.2) | 0.025 |
| PEEP (cm H2O)a) | 5.0 (5.0–8.0) | 5.0 (5.0–8.0) | 7.0 (5.0–8.0) | 0.176 |
Table 3.
| Variable |
Univariable analysis |
Multivariable analysis |
||
|---|---|---|---|---|
| OR (95% CI) | P-value | OR (95% CI) | P-value | |
| Age (yr) | 0.989 (0.963–1.016) | 0.423 | 0.992 (0.961–1.026) | 0.652 |
| Male | 0.962 (0.430–2.150) | 0.924 | 1.109 (0.441–2.789) | 0.826 |
| BMI (kg/m2) | 1.009 (0.915–1.113) | 0.850 | - | - |
| SAPS II | 0.985 (0.963–1.008) | 0.205 | - | - |
| Primary reason for mechanical ventilation, acute respiratory ailure | 1.937 (0.592–6.337) | 0.274 | - | - |
| pHa) | 0.127 (0.004–3.683) | 0.230 | ||
| PaCO2 (mm Hg)a) | 0.978 (0.948–1.009) | 0.158 | 0.975 (0.938–1.013) | 0.191 |
| PaO2 (mm Hg)a) | 1.003 (0.996–1.010) | 0.426 | - | - |
| PaO2/FiO2 ratioa) | 0.997 (0.993–1.001) | 0.129 | 1.000 (0.995–1.004) | 0.844 |
| Analgesica) | 4.444 (1.249–15.816) | 0.021 | 3.568 (0.834–15.256) | 0.086 |
| Sedativea) | 1.696 (0.711–4.043) | 0.233 | - | - |
| NMBAa) | 2.390 (0.882–6.474) | 0.087 | 1.935 (0.606–6.178) | 0.265 |
| Mechanical power (J/min)a) | 1.105 (1.053–1.159) | <0.001 | 1.090 (1.029–1.155) | 0.003 |
| VT/PBWa) | 1.239 (1.022–1.502) | 0.029 | 1.079 (0.835–1.395) | 0.561 |
| PEEP (cm H2O)a) | 1.086 (0.920–1.283) | 0.329 | - | - |
Variables with P-value less than 0.2 in univariable analysis and clinical variables with important meanings (age, sex) were included in the multivariable analysis.
OR: odds ratio; CI: confidence interval; BMI: body mass index; SAPS: Simplified Acute Physiology Score; PaCO2: partial pressure of carbon dioxide; PaO2: partial pressure of oxygen; FiO2: fraction of inspired oxygen; NMBA: neuromuscular blocking agent; VT/PBW: tidal volume per predicted body weight; PEEP: positive end-expiratory pressure.


 PDF
PDF Citation
 Print
Print


 XML Download