

 PDF
PDF Citation
 Print
Print


INTRODUCTION
Sleep is an essential habit for maintaining physical and mental health, and it plays a critical role in daily life. Adequate sleep during adolescence is crucial for physical development, emotional development, and cognitive development [1]. The National Sleep Foundation in the United States recommends 8–10 hours of sleep for adolescents [2], however, according to the 2021 Korea Youth Risk Behavior Survey, the average weekday sleep duration for Korean adolescents is 6.2 hours [3]. Chronic sleep deprivation in adolescents can lead to decreased academic performance, emotional instability, depression, and aggression [4]. Several studies have reported a link between sleep deprivation in adolescents and suicidal tendencies [45].
The duration of sleep also was associated with dietary habits and nutritional intake. A study conducted among adults with age over 40 years has shown that sleep duration has negative correlations with calorie intake and percentage of caloric intake from fats but positive correlations with physical activity and carbohydrate intake [6]. However, one study comparing nutrient adequacy ratio (NAR) and mean adequacy ratio (MAR) according to sleep duration in adolescents using 2007–2016 Korea National Health and Nutrition Examination Survey data has shown no significant differences among middle school students. On the other hand, an increase in sleep duration among high school students could lead to increases of NAR and MAR for protein, riboflavin, and vitamin C [7]. Most existing studies on the relationship between sleep duration, mental health, and nutritional intake have categorized total daily sleep duration into various groups for comparison. However, research paper comparing mental health and dietary habits of adolescents based on bedtime has not been reported yet.
Adolescent mental health showed differences depending on regional factors [8]. Residential areas possess distinct environmental, structural, and functional characteristics that can affect mental and physical health of community members [9]. Environmental factors such as green spaces in the area can positively impact mental health [10]. Physical and social environments in the area can also affect adolescents' mental health [8]. Therefore, this study hypothesized that differences in sleep timing and its effects on dietary behavior and mental health could vary according to the residential area. There is a need to compare correlation between bedtime, dietary habits, and mental health among middle school students based on residential areas. Due to variations in bedtime influenced by grade level among middle school students, it is appropriate to compare bedtime, dietary habits, and mental health within the same grade. Therefore, this study focused on second-grade middle school students. Thus, the aim of this study was to compare dietary habits and mental health among middle school students in different regions based on bedtime, providing evidence that supports the importance of appropriate bedtime for Korean middle school students regarding their healthy dietary habits and mental well-being.
SUBJECTS AND METHODS
Study population and data source
The Korea Youth Risk Behavior Survey is an annual online self-report survey conducted by the Korea Centers for Disease Control and Prevention. It targets students from the first year of middle school to the third year of high school in South Korea. This study used data from the Korea Youth Risk Behavior Surveys conducted from 2020 to 2022. The surveys conducted from 2020 to 2022 were carried out in August to October of each respective year. On the day of the survey, each responsible teacher assigned one computer per sampled student. Starting from the 2020 survey, in some schools where conducting surveys in computer labs was difficult, the surveys were conducted in classrooms under the supervision of the responsible teacher using mobile devices (tablet PCs, smartphones). It was conducted under the exemption from review by the Institutional Review Board for Bioethics at Dongduk Women's University (DDWU 2309-03). In the pilot study analyzing the 2020 data, as the grade level in middle school increased, bedtime became later. Thus, we targeted second-year middle school students. From a total of 29,145 participants, 25,681 were selected after excluding 3,464 who had missing data for the question of "What time did you usually go to bed and wake up in the past 7 days?". Participants who reported waking up before 4 a.m. or after 9 a.m. on weekdays and those who reported going to bed between 4 a.m. and 8 p.m. were treated as missing values.
Sleep timing and regional classification
Sleep timing, the variable of ‘Time gone to sleep on weekdays’, was categorized into ‘Before 23:00’, ‘23:00–24:00’, ‘24:00–01:00’, ‘01:00–02:00’, and ‘After 02:00’. In the pilot study analyzing the 2020 data, the difference in bedtime distribution between ‘large cities’ and ‘small-to-medium cities’ was not significant. Therefore, participants residing in ‘large cities’ and ‘small-to-medium cities’ were classified as ‘urban’ while those residing in ‘rural areas’ were classified as ‘rural’. The final study population comprised 12,119 urban male students, 11,683 urban female students, 971 rural male students, and 908 rural female students.
General characteristics
General characteristics such as height, weight, smoking status, alcohol consumption, and physical activity were compared according to sleep timing in urban and rural areas. Smoking status was determined based on responses to the following question: "How many days have you smoked cigarettes in the past 30 days?". Those who responded ‘At least once a month’ were considered smokers. Alcohol consumption was determined based on responses to the following question: "How many days have you consumed alcohol in the past 30 days?". Those who responded ‘At least once a month’ were considered drinkers. Physical activity was categorized as ‘none in the past 7 days’, ‘1–3 days a week’, and ‘4 or more days a week’ based on responses to the following question: "How many days did you engage in physical activity that increased your heart rate or made you breathe hard for a total of at least 60 minutes in the past 7 days?".
Academic factors
Academic performance, weekday smartphone use, weekend smartphone use, time spent sitting for academic purposes, and time spent sitting for non-academic purposes were compared according to sleep timing in urban and rural areas. Academic performance was classified into ‘High’, ‘Medium’, and ‘Low’ based on the question, "How would you rate your academic performance in the past 12 months?".
Dietary behavior
Dietary behavior was analyzed based on frequency of breakfast, fast-food consumption, carbonated drink consumption, sweetened beverage consumption, and daily water intake in the past 7 days. Breakfast frequency was categorized as ‘Did not eat in the past 7 days’, ‘1–4 days a week’, ‘5–6 days a week’, and ‘7 days a week’. Fast-food consumption was categorized as ‘Did not eat in the past 7 days’, ‘1–2 times a week’, and ‘3 or more times a week’. The frequency question on carbonated drink intake was removed from the survey items in 2022, while the frequency question on sweetened beverages was investigated excluding energy drinks and carbonated drinks until 2021, but starting from 2022, it included both energy drinks and carbonated drinks, resulting in a change in variables. Therefore, only data from 2020–2021 were used for analysis. Frequency for the question was categorized as 'None', '1–2 times a week', '3–4 times a week', '5 or more times a week'.
Mental health
Perceived stress, sleep quality, suicidal ideation, suicidal plans, suicidal attempts, average sleep duration, experiences of sadness and despair, and generalized anxiety disorder were compared according to sleep timing in urban and rural areas. Perceived stress was categorized as ‘Feel it very much’, ‘Feel it a lot’, and ‘Feel it a little’ based on the question: “How much stress do you usually feel?”. Sleep quality was categorized as ‘Sufficient’, ‘Moderate’, and ‘Insufficient’ based on the question: "Do you think the sleep you have had in the past 7 days was sufficient for fatigue recovery?". Suicidal ideation, plans, and attempts were categorized as ‘None in the past 12 months’ and ‘Yes in the past 12 months’ based on their respective questions. Experiences of sadness and despair were categorized as ‘None in the past 12 months’ and ‘Yes in the past 12 months’. Generalized anxiety disorder was categorized as ‘Normal’, ‘Mild’, and ‘Moderate or more’ based on scores assigned to seven items.
Statistical analysis
The Korea Youth Risk Behavior Survey data were collected using a complex sample design method. Therefore, stratification (strata), clustering (cluster), and weighting (w) were applied for the analysis. SAS statistical software version 9.4 (SAS Institute Inc., Cary, NC, USA) was used for all analyses, which were performed separately by gender and compared between urban and rural areas. Categorical variables were analyzed using Rao-Scott χ2 test. Continuous variables are presented as mean ± SE and analyzed using analysis of variance. Tukey's test was used for post hoc analysis. All statistical significance levels were set at P < 0.05.
RESULTS
General characteristics
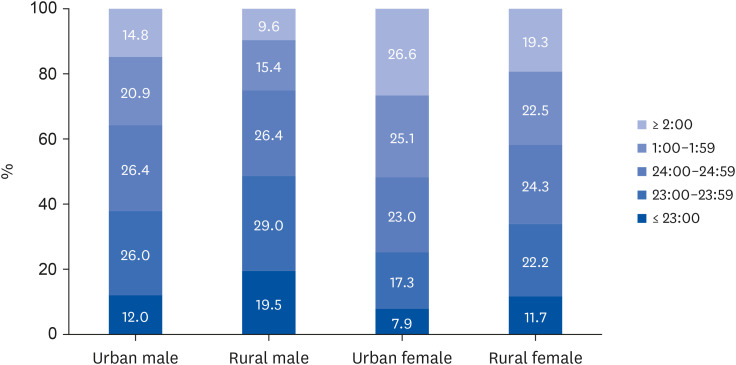
Results for distribution of bedtime among urban and rural middle school students are shown in Fig. 1. The proportion of students going to bed between 1–2 a.m. and after 2 a.m. was the highest in urban female students, followed by that in rural female students, urban male students, and rural male students. Female students tended to sleep later than male students and urban students tended to sleep later than rural students.
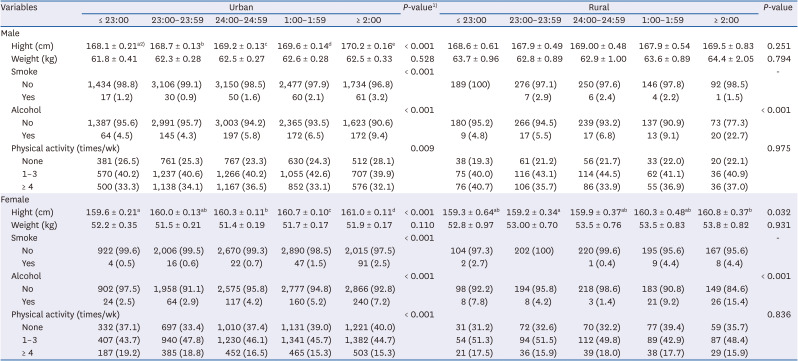
General characteristics of urban and rural middle school students according to their bedtime are shown in Table 1. Height was significantly higher in those with later bedtime for both male and female students in urban areas and rural female students (P < 0.001, P < 0.001, and P = 0.032, respectively). The proportion of smokers increased with later bedtime in both urban male and female students (P < 0.001). Alcohol consumption also increased with later bedtime in both urban and rural areas (P < 0.001). In particular, those who went to bed after 2 a.m. had the highest proportion of alcohol consumption, with consumption rate being higher in rural area than in urban area. In urban areas, both males and females who had a bedtime after 2 a.m. had the highest proportion of not engaging in physical activity (P = 0.009 and P < 0.001, respectively). There were no significant differences in body weight according to bedtime, height among rural males, smoking status in rural areas, and physical activity rates in rural areas.
Table 1
General characteristics of urban and rural middle school students according to their bedtime
Academic factors
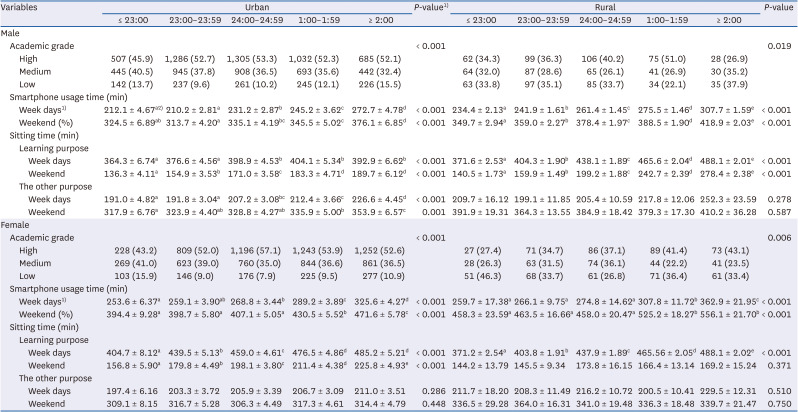
Academic factors of urban and rural middle school students according to bedtime are summarized in Table 2. In urban areas, both male and female students who went to bed between midnight and 1 a.m. had the highest academic performance (P < 0.001). In rural areas, male students who went to bed between 1 a.m. and 2 a.m. had the highest academic performance (P = 0.019), while female students who went to bed after 2 a.m. had the highest academic performance (P = 0.006). Furthermore, rural areas had higher smartphone usage time compared to urban areas, and females had higher smartphone usage time than males. The amount of time spent sitting for studying purposes on weekdays and weekends was significantly higher in the group with later bedtime except for rural females on weekends (P < 0.001). In urban areas, males who had a later bedtime had significantly more time spent sitting for purposes other than studying on weekdays and weekends (P < 0.001 and P = 0.001, respectively). There were no significant differences observed in the amount of time spent sitting for studying purposes on weekends among rural females, as well as in the amount of time spent sitting for purposes other than studying among urban females and rural males and females.
Table 2
Academic factors of urban and rural middle school students according to bedtime
Dietary behavior
Dietary behaviors of urban and rural middle school students according to bedtime are shown in Table 3. Significant differences were observed in dietary behaviors according to sleep timing in urban areas compared to rural areas. In both urban and rural areas, the frequency of breakfast consumption significantly increased with earlier bedtime for both males and females (P < 0.001). In urban areas, the frequency of fast-food consumption was significantly increased with later bedtime for both males and females (P < 0.001). In rural areas, the frequency of fast-food consumption among males was the highest for those who had fast food three or more times a week in the group with a later bedtime (P = 0.046). In urban areas, the proportion of individuals who consumed carbonated beverages five or more times a week was the highest in the group with a later bedtime for both males and females (P < 0.001). Frequencies of consuming sweet-tasting drinks among urban males, urban females, and rural females were the highest in the group with bedtime after 2 a.m. (P < 0.001, P < 0.001, and P = 0.043, respectively). There were no significant differences observed in the frequency of fast-food consumption, carbonated beverage consumption, and sweetened drink consumption among rural females, as well as in the frequency of sweetened drink consumption among rural males, according to bedtime.
Table 3
Dietary behaviors of urban and rural middle school students according to bedtime
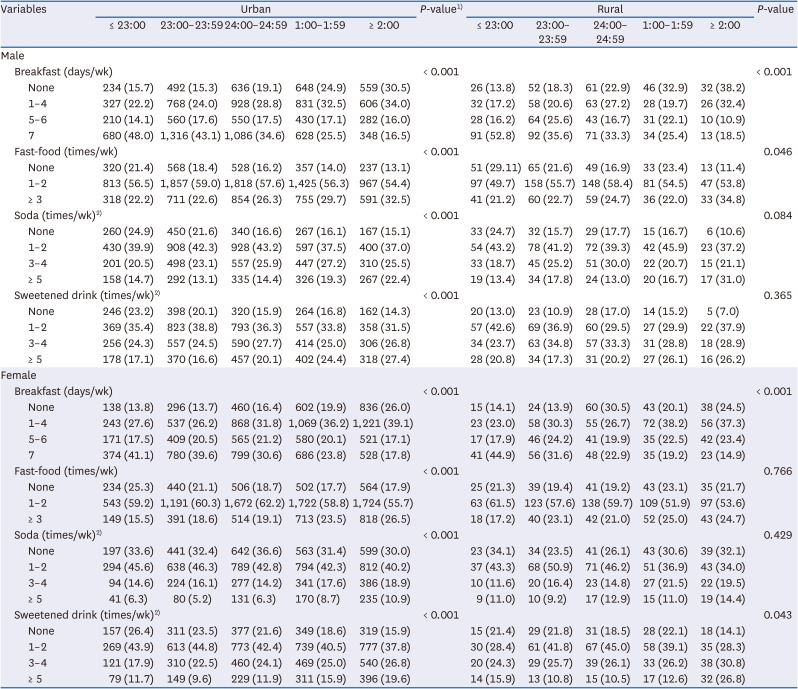
Values are presented as number (%).
1)The P-values by analysis of variance for continuous variables and Rao-Scott χ2 test for categorical variables.
2)These variables were only surveyed in 2020 and 2021, resulting in different sample sizes. The sample sizes were 8,138, 7,748, 664, and 622 for urban male, urban female, rural male, and rural female, respectively.
Mental health
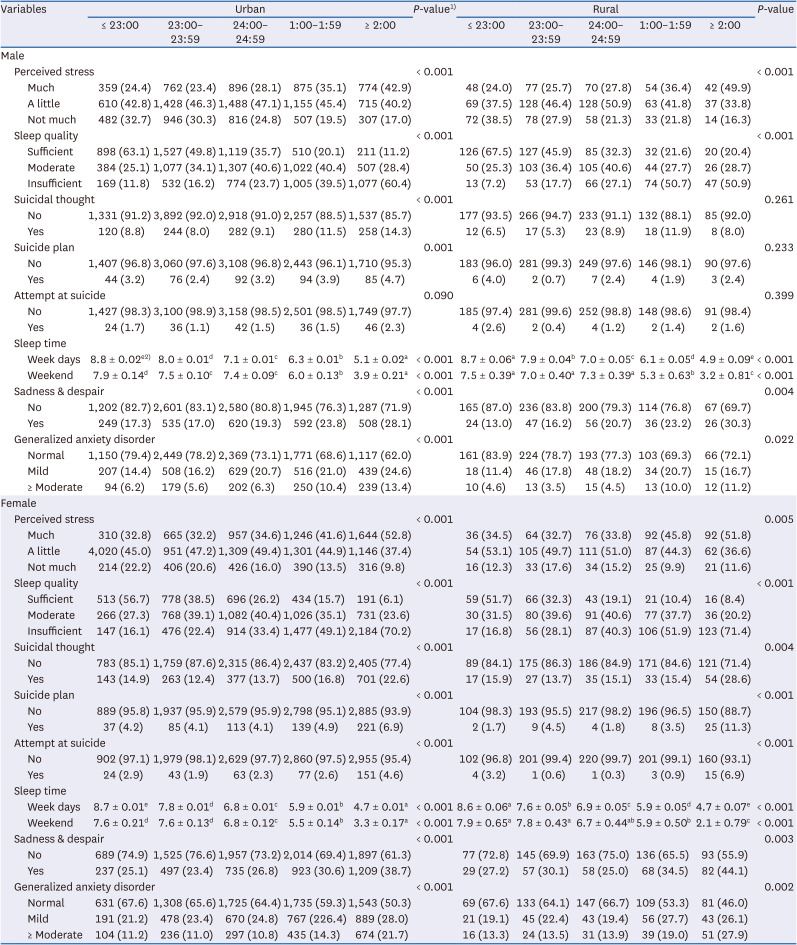
Results of analyzing mental health of urban and rural middle school students according to bedtime are shown in Table 4. The level of perceived stress was significantly higher in the late bedtime group in both urban and rural areas for both genders. The more the bedtime was delayed, the lower the degree of fatigue recovery through sleep for both males and females in urban and rural areas (P < 0.001). In urban areas, the proportion of males who had suicidal ideation and a suicide plan in the past 12 months was the highest in the group with a later bedtime (P < 0.001 and P = 0.001, respectively). The proportion of females in urban and rural areas who had suicidal ideation, a suicide plan, and a suicide attempt was the highest in the group with a later bedtime. On weekdays and weekends, the amount of sleep time decreased significantly with later bedtime for both males and females regardless of urban or rural area (P < 0.001). The experience of sadness or despair was significantly higher in the group with bedtime after 2 a.m. for all groups. The score for generalized anxiety disorder was also significantly higher in the group with a later bedtime for all groups. There were no significant differences in suicide attempts among urban and rural males, or in suicidal ideation or suicide planning among rural males according to bedtime.
Table 4
Mental health of urban and rural middle school students according to bedtime
DISCUSSION
This study aimed to compare dietary behaviors and mental health among second-year middle school students in urban and rural areas based on their bedtime utilizing data from the Korea Youth Risk Behavior Survey conducted from 2020 to 2022. Urban students generally went to bed later than rural students and female students had later bedtimes than male students. Previous research has shown that girls have more bedtime resistance issues than boys and that children in rural areas tend to go to bed and wake up earlier than those in urban areas [11]. Another domestic study involving adolescents revealed that female students had a shorter average sleep duration during weekdays than male students [12]. This contrasts with a study conducted in Mexico [13], which found no significant difference in sleep duration between urban and rural areas.
Smoking rates among urban students were higher for both genders when bedtime was delayed. Both urban and rural areas showed an increase in alcohol drinking rates as bedtime was delayed. Previous research has indicated that extreme sleep deprivation leads to higher daily smoking and drinking rates, followed by those who oversleep [1]. Such findings suggest that late bedtime is associated with smoking and drinking. When comparing drinking statuses between regions, rural areas exhibited a noticeably higher rate, which is in line with prior studies that suggest rural youth are more likely to engage in drinking due to fewer recreational activities [1415].
Academic performance differed by area and gender depending on bedtime. Urban students who went to bed before 11 p.m. had lower academic performance compared to those who went to bed later. Among rural students, boys who went to bed between 1 a.m. and 2 a.m. had high academic performance, while girls who went to bed after 2 a.m. had high academic performance. In a study conducted with American adolescents, a later bedtime was associated with lower academic outcomes [16]. The correlation between bedtime and academic performance appears to be influenced by various factors such as society, culture, and region.
Smartphone usage time significantly increased as bedtime was delayed, with females showing more extended usage than males. In addition, students in rural areas tended to spend more time using smartphones compared to those in urban areas. This is consistent with a prior study involving 54,603 adolescents that reported problematic experiences related to smartphone usage were more frequent among females [17].
When bedtime was delayed, fewer students had breakfast, particularly those going to bed after 1 a.m. This aligns with prior research indicating that inadequate sleep is associated with skipping breakfast. A study conducted by Tambalis et al. [18] on 177,091 Greek adolescents aged 8–17 has reported that inadequate sleep is associated with skipping breakfast. A previous study conducted on Korean adults has also shown a higher prevalence of breakfast skipping among those with less than 6 hours of sleep than in those with more than 6 hours of sleep [19]. Considering positive effects of breakfast on memory, learning, and mental health during adolescence [20], it seems necessary to educate and encourage adolescents to have regular breakfast and go to bed at least before 1 o'clock.
Consumption of fast food, carbonated drinks, and sugary beverages also increased when bedtime was delayed. The increase was more pronounced in urban students. A previous study targeting adolescents aged 8–17 years found that inadequate sleep duration was associated with unhealthy eating habits such as fast food and snack consumption [18]. The group with later bedtime showed a higher consumption of fast food, carbonated beverages, and sweetened drinks, which could be related to breakfast skipping. In a study by Bae [21] on adolescents aged 12–18 years, students who skipped breakfast had a higher frequency of consuming processed foods and exhibited a pattern of inadequate intake of essential nutrients needed for growth. These findings highlight the potential associations of late bedtime with breakfast skipping and unhealthy dietary patterns.
In both urban and rural areas, a significant association was found between later bedtime and higher perceived stress level. Particularly, students who went to bed after 1 a.m. showed higher stress levels than those who went to bed before 1 a.m. A study conducted on high school students also revealed a significant decrease in the prevalence of stress-related symptoms when sleep duration was increased [7]. Suicidal ideation and plans were significantly more prevalent among urban students and rural female students with later bedtime. Especially, suicidal ideation, plans, and attempts were significantly increased in students who went to bed after 2 a.m. A previous study utilizing the 7th Korea Youth Risk Behavior Survey in 2011 reported that sleep insufficiency in adolescents leads to a decrease in emotional well-being and an increase in health-risk behaviors [1]. The prevalence of moderate to severe generalized anxiety disorder was also increased when bedtime was delayed. It was higher in the group that went to bed after 1 a.m., reaching the highest rate in those who went to bed after 2 a.m. Similar results were found in previous studies. Roane and Taylor [22] have performed a longitudinal study with 8,076 adolescents and young adults and revealed that insomnia symptoms during adolescence are associated with alcohol use, marijuana use, illicit drug use, depression, suicidal ideation, and suicide attempts, suggesting that they are significant risk factors for adult depression.
According to the Health Plan 2030 [23], the target smoking rate for male middle school students in 2030 is 3%. However, the smoking rate in urban male students who went to bed after 2 a.m. was 3.18%, which exceeded the target rate. For female middle school students, the target smoking rate is 1.2%. However, smoking rates in urban female students who went to bed after 1 a.m. (1.54%) and 2 a.m. (2.49%) as well as in rural female students who went to bed before 11 p.m. (2.7%), after 1 a.m. (4.4%), and after 2 a.m. (4.4%) were higher than the target rate. In both urban and rural areas, the smoking rate was significantly higher for those who went to bed after 1 a.m. Risky drinking rate among adolescents according to the Health Plan 2030 is based on the proportion of current drinkers among middle and high school students who consume an average of at least moderate amounts of alcohol (5 or more glasses of soju for males, 3 or more glasses for females) in the past 30 days. However, since this study's drinking variable was based on the presence of drinking rather than the specific amount consumed, it was difficult to make an accurate comparison. Nevertheless, considering the higher drinking rates among those with late bedtimes, it could be inferred that early bedtime is desirable for reducing risky drinking rates among adolescents.
This study has two limitations. First, it is a cross-sectional study using the Korea Youth Risk Behavior Survey. Thus, causal relationships between bedtime and various factors could not be determined. Second, it did not clarify whether observed differences were due to regional or socio-economic factors. Nevertheless, this study was significant in that it used a large-scale sample of middle school students extracted by cluster and analyzed students' health status based on their bedtime, unlike previous studies that used sleep time as the criterion. Additionally, it compared health status of adolescents in different regions. Considering factors such as smoking, alcohol drinking, dietary habits, and mental health, it could be inferred that it is necessary for middle school students to go to bed at least before 1 a.m. Results of this study are expected to serve as basic data for providing guidelines for healthy growth of middle school students.
 XML Download