

 PDF
PDF Citation
 Print
Print


INTRODUCTION
Diabetes mellitus (DM), a chronic progressive disease, is a life-threatening disease that increases the individual and social burden of patients with various complications [1], and in 2021, the prevalence of diabetes in Korea was reported to be 16.3% (19.4% for men and 13.4% for women) over the age of 30 and has been continuously increasing for 10 yrs since 2012 [2]. Diabetes is increasing exponentially worldwide, and the incidence of diabetes among people aged 20 to 79 is expected to increase by 46% from 2021 to 2045, and 90% of confirmed cases of diabetes is type 2 DM (T2DM) [1]. However, only 25% of patients with diabetes in Korea achieved < 6.5% of the glycemic control target of hemoglobinA1c (HbA1c) [2]. The ultimate aim of diabetes treatment is to practice self-management, such as continuous lifestyle modification to increase glycemic control rate, prevent diabetes-related complications, and maintain a healthy life [3]. The United Kingdom Prospective Diabetes Study, a prospective study of T2DM, found that a 1% reduction in HbA1c levels reduces microvascular complications by 37% and myocardial infarction by 14% [4]. Although the degree varies from study to study, active and strict glycemic control has been reported as the most effective way in preventing diabetes-related complications and hampers the progression of complications [5].
Considering that the prevalence of obesity in young adults in their 30s is increasing in Korea recently [1] and more than 30% of people are in the prediabetes stage [5], the importance of lifestyle modification for the prevention and management of diabetes has been underscored. For an effective diabetes management, controllable factors in daily life, such as diet, exercise, drinking, and smoking, must be identified [6]. In particular, since the coronavirus disease 2019 (COVID-19) pandemic, numerous studies have demonstrated that diabetes is associated with an increased risk of severe COVID-19 outcomes, further increasing the need for strategies to maintain a healthy lifestyle [789].
The Korean Diabetes Association (KDA) practice guidelines [5] state that an ideal intake ratio of carbohydrates, proteins, and fats is nonexistent and that treatment should be individualized considering the total energy intake and nutrient quality according to treatment goals. For patients with diabetes, carbohydrate intake reduction is effective in improving glycemic control [101112], and various meal patterns that satisfy individual needs and preferences can be employed [13]. However, extreme carbohydrate restriction to reduce weight and improve glycemic control increases the risk of hypoglycemia in patients using oral hypoglycemic agents (OHA) or insulin and is difficult to sustain in the long term [5]. Thus, it is important to reevaluate and individualize regularly.
This study was conducted to identify related factors according to the glycemic control status of patients with diabetes using the recently released 8th Korea National Health and Nutrition Examination Survey (KNHANES) data (2019–2021). Thus, to provide basic data for medical nutritional therapy (MNT), we will analyze the effect of carbohydrate intake ratio on total energy intake on glycemic control and suggest an appropriate carbohydrate intake ratio.
SUBJECTS AND METHODS
Data analysis and research participants
This study utilized data from the KNHANES VIII conducted from 2019 to 2021 and included health surveys, health examination surveys, and nutrition surveys. Among the 18,904 participating respondents, data from participants aged 30 yrs or older and had diabetes (fasting glucose ≥ 126 or HbA1c ≥ 6.5%, taking diabetes medication, injecting insulin, or diagnosed by a doctor) were analyzed. A total of 2,233 respondents (men, 1,094; women, 1,139) were used in the analysis, excluding pregnant, lactating women, and extreme energy eaters with daily energy intake < 500 kcal or > 5,000 kcal. According to the KDA 2023 practice guidelines [5], an HbA1c level of < 6.5% is the glycemic control target for participants with diabetes, and participants were divided into a good glycemic control group and a poor glycemic control group if it was 6.5% or higher. This study was approved by the Ethics Committee of Kyungpook National University (IRB KNU-2023-0413).
General characteristics
To examine the general characteristics, sex, age, education level, occupation, marital status, household type, and income level were included as variables. Sex was classified into man and woman, and age was classified into 5 groups: 30–39, 40–49, 50–59, 60–69, and ≥ 70. Education level was classified into elementary school graduation or lower, middle school graduation, high school graduation, and university graduation or higher. The occupation was stratified as manager, expert and related worker, office worker as “office worker,” service and sales worker as “service worker,” agriculture, forestry and fisheries skilled worker, equipment and machinery operation and assembly worker, simple labor worker as “manufacturing worker,” and unemployed (housewife, student, etc.) as “unemployed.” Marital status was classified into “having a spouse” (including cohabitation) and “no spouse” (single, separated, divorced, or widowed). Household type was classified into single-person households and multiperson households with 2 or more people, and income level was divided into low, moderately low, moderately high, and high through quartiles.
Dietary behavior and health-related characteristics
Dietary behavior
We used dietary survey data to determine eating habits (frequency of eating out, frequency of vegetable consumption, and frequency of fruit consumption), meal quality (frequency of breakfast, lunch, and dinner), nutritional attitude (nutritional education, awareness of nutrition labeling, and utilization of nutrition labeling), and presence of a companion when eating (or eating alone) to analyze dietary behavior. Eating habits were evaluated using the frequency of eating out, consumption of vegetables containing kimchi, consumption of vegetables excluding kimchi, and fruit consumption. The frequency was classified as at least once a day (once or twice a day), 1–6 times a week, and ≤ 3 times a month (rarely). Meal quality was evaluated through measurement of the degree of meal skipping using the frequency of breakfast, lunch, and dinner over the past year. The state of skipping meals was classified into 3 categories meal frequency 1–2 times a week, 3–4 times a week, and 5–7 times a week.
Nutritional attitude was used by classifying nutritional education, awareness of nutrition labeling, and utilization of nutrition labeling as “yes” or “no.” Regarding whether or not a person ate with a companion during breakfast, lunch, and dinner and whether or not they ate alone was classified as “yes” or “no.” This was categorized into cases of eating with a companion for more than one meal per day and eating alone.
Health behavior
To analyze health behavior, weight change over 1 year, subjective health status, and physical activity variables were used in the health survey. In addition, smoking, drinking, and presence of hypertension, hypercholesterolemia, hypertriglyceridemia, and obesity were used in the examination. Weight change over 1 year was categorized into no change, weight loss, and weight gain. Subjective health status was divided into 3 levels: good (very good and good), average, and bad (bad and very bad). Regarding physical activity, the participants were classified into “practicing group” and “nonpracticing group.” Participants who performed aerobic physical activity for more than 2 h and 30 min or strength training for more than 2 days a week were classified into the practicing group, and those who did not were classified into the nonpracticing group. To compare between aerobic exercise and strength training, variables for the number of walking days and strength training days were additionally used, and the number of walking days was classified as daily (more than 6 days a week), 3 to 5 times a week, 1 to 2 times a week, and never. The number of strength training days was categorized as 3 or more times a week, 1 to 2 days a week, or never. When inquired regarding drinking experience in the past year, “drinking” was defined as consuming more than one drink per month. Smoking was defined currently smoking, including “smoking every day” and “smoking sometimes.” Hypertension is defined as a systolic blood pressure (SBP) ≥ 140 mmHg or diastolic blood pressure ≥ 90 mmHg or taking an antihypertensive medication. Hypercholesterolemia was classified as having a total blood cholesterol level of ≥ 240 mg/dL or taking a cholesterol medication, and hypertriglyceridemia was classified as having a blood triglyceride level of ≥ 200 mg/dL. A body mass index (BMI) of < 18.5 kg/m2 is underweight, 18.5 to 22.9 kg/m2 is normal, 23.0 to 24.9 kg/m2 is overweight, and 25.0 to 29.9 kg/m2 is class I obesity, 30.0 to 34.9 kg/m2 is class II obesity, and ≥ 35.0 kg/m2 is class III obesity.
Analysis of food intake
In the food intake analysis, food intake data from the nutritional survey were used to investigate the intake of total energy, macronutrients, and micronutrients. In addition, dietary fiber and sugar intake, which may affect glycemic control, were analyzed. Among the 2020 Dietary Reference Intakes for Koreans (KDRIs) [14], total energy intake was evaluated using the estimated energy requirements (EER), macro and micronutrients are assessed using the estimated average requirement (EAR), dietary fiber was investigated based on the adequate intake (AI), and sugars were examined according to the recommended nutrient intake (RNI).
Statistical analysis
The SPSS 25.0 (Statistical Package for Social Science; SPSS Inc., Armonk, NY, USA) program was used for the statistical analysis of this study. A cross-analysis of the complex sample analysis is performed to assess factors, such as the participant, sex, age, education level, occupation, marital status, household type, income level, eating habits, meal quality, nutritional attitude, eating alone, weight change, subjective health status, physical activity, drinking, smoking, hypertension, hypercholesterolemia, hypertriglyceridemia, obesity. Significance was tested using Rao–Scott corrected χ2. Quantitative variables such as energy intake, nutrient intake, macronutrient intake ratio among the total energy intake, and nutrient intake ratio comparison with the KDRIs were compared by calculating Wald F values using complex sample general linear model (analysis of variance).
Univariate logistic regression analysis was conducted to analyze the correlation between the dietary behavior characteristics of participants with diabetes and carbohydrate intake ratio. After adjusting for sociodemographic characteristics, dietary behavior and health behaviors that showed significant differences, multivariate logistic regression analysis was conducted to obtain the adjusted odds ratio (OR), and the 95% confidence intervals (CIs) were presented. The adjustment variables used were age, sex, diabetes duration, frequency of fruit consumption, frequency of lunch, and frequency of dinner. Statistical significance was set at P < 0.05.
RESULTS
General characteristics
Table 1 presents the analysis results according to the general characteristics of the study participants and glycemic control. Among the participants, 56.5% were men and 43.5% were women, with 25.4% and 24.0% having good glycemic control, respectively. Regarding age, 4.4% of the participants were in their 30s, 12.6% in their 40s, 24.4% in their 50s, and 26.6% in their 60s, and those who were in their 70s and older accounted for the highest percentage at 32.0%. The age group with the highest rate of good glycemic control was in their 30s at 32.5%, and the lowest rate was in their 40s at 19.8%. The education level was as follows: 30.8% graduated from high school, 28.6% graduated from elementary school or lower, 26.3% graduated from college or higher, and 14.3% graduated from middle school. Concerning occupation, the lowest rate in the group with diabetes was service industry at 10.7%, followed by the office workers at 15.4%, manufacturing industry at 29.1%, and unemployed at 44.8%. In the marital status survey, a high percentage of participants was married (76.3%), while 23.7% were single, divorced, widowed, or separated. Majority of the participants (83.8%) responded that they were living with family or a partner, and 16.2% comprised single-person households. The income level revealed the following results: low, 27.0%; moderately low, 25.3%; moderately high, 24.1%; and high, 23.6%. The duration of diabetes was more than 10 yrs, accounting for the largest proportion at 42.5%. Thereafter, 5–9 yrs accounted for 22.3%, 1–2 yrs for 16.2%, 3–4 yrs for 13.9%, and < 1 year for 5.0%. Majority of cases were managed with OHA alone (85.5%), whereas 13.7% and 0.8% were managed with OHA and insulin injection in combination and nonpharmacological treatments (exercise and diet), respectively. Among the general characteristics, except for the variable of age groups (P = 0.036) and diabetes duration (P < 0.001), no variables revealed statistically significant differences depending on glycemic control.
Table 1
General characteristics of the participants according to glycemic control
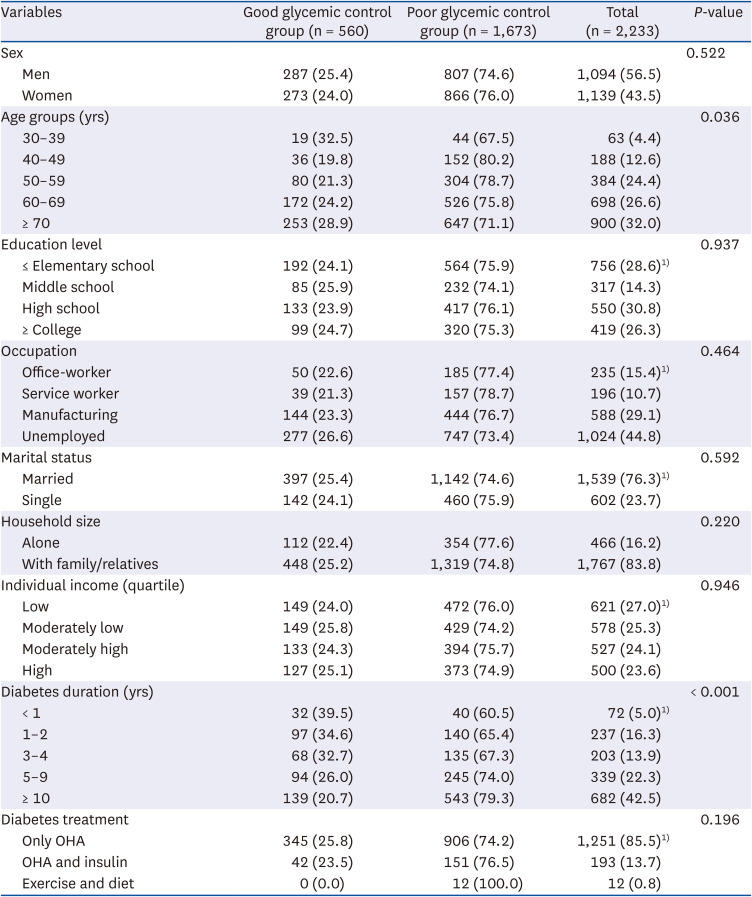
The data were analyzed using the complex sample module. All values are presented as unweighted number (weighted %).
The study sample was stratified into 2 groups based on glycemic control (defined as hemoglobinA1c < 6.5% or above).
P-values were obtained using the Rao–Scott modified χ2 test.
OHA, oral hypoglycemic agent
1)Sum of frequencies differs from total due to missing values.
Dietary behaviors according to glycemic control
Table 2 presents the analysis results of the study participants’ dietary behavior and glycemic control. The frequency of eating out that was analyzed to evaluate eating habits was 1–6 times a week in 43.3% cases, ≤ 3 times a month in 41.4%, and more than once a day in 15.3%. The frequency of vegetable consumption more than once a day, including and excluding kimchi, was over 95% (99.2% and 97.6%, respectively). Conversely, the frequency of fruit consumption was 46.4% for 1 to 6 times a week and 38.7% for more than once a day. As a result of analyzing the frequency of breakfast, lunch, and dinner to evaluate the quality of meals, the rate of meal consumption 1–2 times a week was 16.3% for breakfast, which was the highest rate of skipping meals compared to 5.6% for lunch and 1.9% for dinner. The rate at which nutritional education was received was analyzed to assess nutritional attitude and was observed to be only 6.4%. The rate of awareness of nutrition labels was 62.2%, whereas the rate of utilizing nutrition labels was 32.9%. The rate of eating alone at least once per day was analyzed to be 20.3%. All variables of dietary behavior failed to show statistical significance between the groups; however, the frequencies of fruit consumption (P = 0.015), lunch consumption (P = 0.048), and dinner consumption (P = 0.044) revealed significant differences (P < 0.05).
Table 2
Dietary behaviors of the participants according to glycemic control
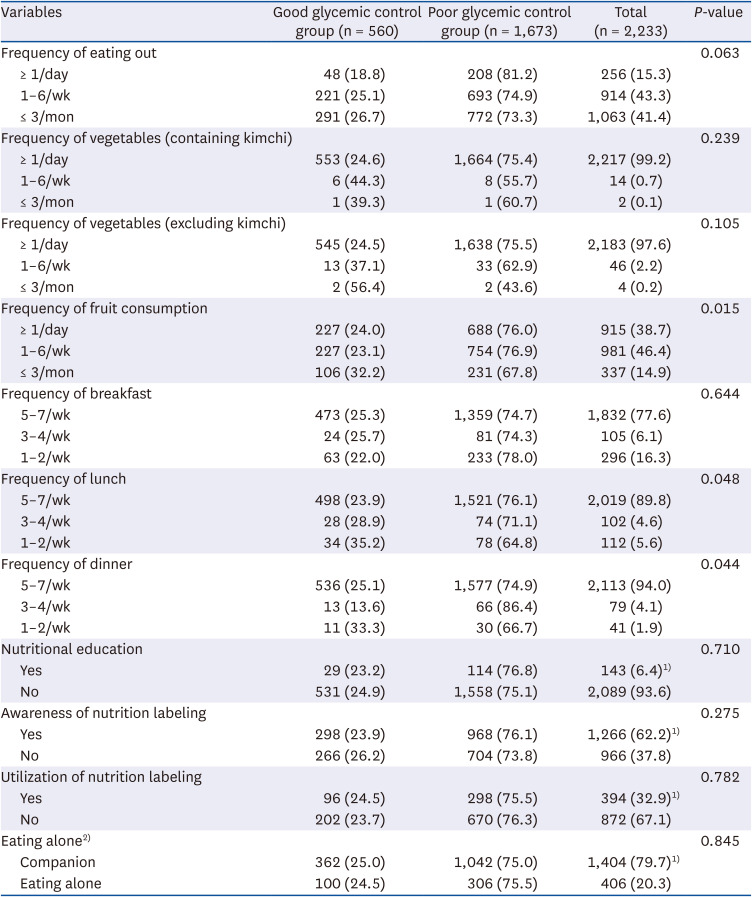
The data were analyzed using the complex sample module. All values are presented as unweighted number (weighted %).
The study sample was divided into 2 groups based on glycemic control (defined as hemoglobinA1c < 6.5% or above).
P-values were obtained using the Rao–Scott modified χ2 test.
1)Sum of frequencies differs from total due to missing values.
2)Eating alone was categorized into cases of eating without companion for more than one meal per day.
Health behaviors according to glycemic control
Table 3 presents the analysis results of the study participants’ health behavior and glycemic control. As for weight change, no change over 1 year was the highest at 63.8%, followed by a decrease and increase in weight at 20.1% and 16.1%, respectively. Subjective health status was moderate at 49.3%, poor at 31.7%, and good at 19.0%. In total participants, the practicing group was 36.3%, whereas the nonpracticing group was 63.7%, and no significant difference was observed between the groups in the detailed variables of walking days and strength training days. Regarding alcohol consumption, 46.2% drank more than one drink per month and 53.8% consumed less than one drink per month. The current smoking rate, which was examined as a smoking status variable, accounted for 21.6% in total participants. Those with hypertension accounted for 58.3%, prehypertension for 22.4%, hypercholesterolemia for 47.3%, and hypertriglyceridemia 21.3%. In terms of variables for those with obesity, 1.1% were underweight and 22.2% had normal weight, whereas overweight and obesity accounted for a high proportion at 76.7%, with class III obesity accounting for 2.0%. All variables of health behavior failed to show statistical significance between the groups (P < 0.05).
Table 3
Health behavior of the participants according to glycemic control
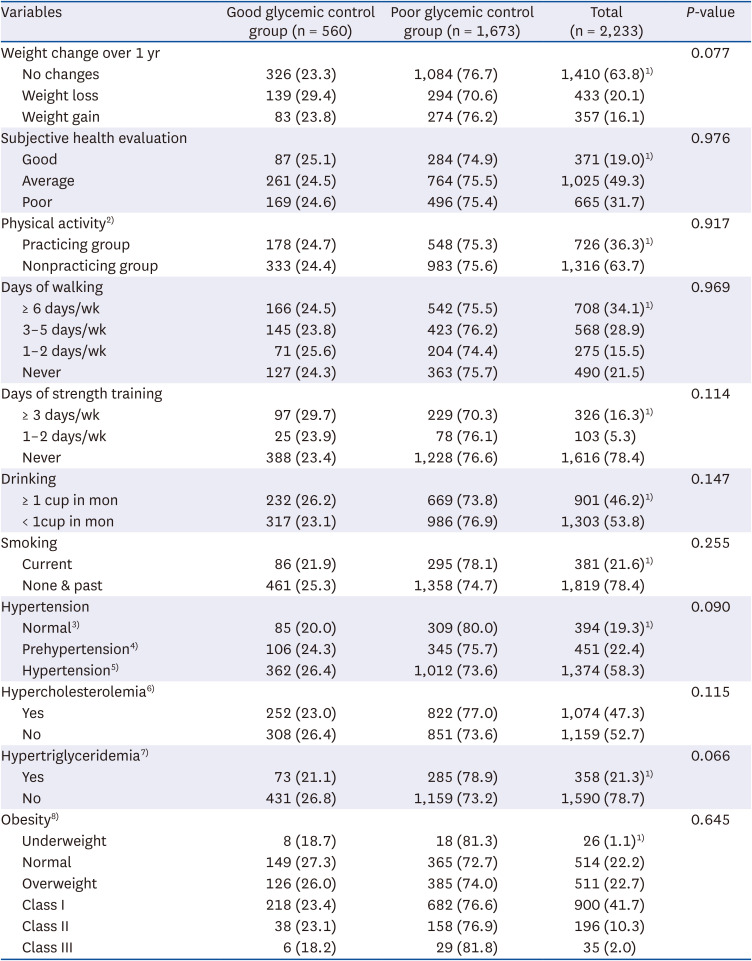
The data were analyzed using the complex sample module. All values are presented as unweighted number (weighted %).
The study sample was divided into 2 groups based on glycemic control (defined as hemoglobinA1c < 6.5% or above).
P-values were obtained using the Rao–Scott modified χ2 test.
SBP, systolic blood pressure; DBP, diastolic blood pressure; BMI, body mass index.
1)Sum of frequencies differs from total due to missing values.
2)Aerobic physical activity for more than 2 h and 30 min or strength training for more than 2 days a week were classified into the practicing group, and those who did not were classified into the nonpracticing group.
3)Normal is defined as an SBP < 120 mmHg and DBP < 80 mmHg.
4)Prehypertension is defined as 120 mmHg ≤ SBP < 140 mmHg or 80 mmHg ≤ DBP < 90 mmHg.
5)Hypertension is defined as an SBP ≥ 140 mmHg or DBP 90 ≥ mmHg or on an antihypertensive medication.
6)Hypercholesterolemia is defined as total cholesterol ≥ 240 mg/dL or on medication.
7)Hypertriglyceridemia is defined as blood triglyceride ≥ 200 mg/dL.
8)For weight, underweight is defined as BMI < 18.5; normal, 18.5–22.9; overweight, 23.0–24.9; class I obesity, 25.0–29.9; class II obesity, 30.0–34.9; class III obesity, ≥ 35.0.
Food intakes according to glycemic control
The results of the energy intake and nutrient intake analysis according to glycemic control are shown in Table 4, and the ratio of macronutrients to total energy intake is summarized in Table 5. Additionally, the results of comparing the proportion of participants consuming more than or less than the EER, EAR, AI, and RNI based on the 2020 KDRIs are shown in Table 6. Significant difference was observed in the total energy between the good and poor glycemic control groups in men (good, 2,054.61 ± 65.91 kcal; poor, 2,088.58 ± 36.31 kcal, P = 0.008). And significant difference was found in terms of protein (good, 53.04 ± 2.08 g; poor, 53.79 ± 1.04 g, P = 0.004), vitamin B1 (good, 0.94 ± 0.04 mg; poor, 0.92 ± 0.02 mg, P = 0.033), and niacin intake (good, 8.98 ± 0.44 mg; poor, 9.44 ± 0.21 mg, P = 0.042) between the groups in women.
Table 4
Energy and nutrient intake of the participants according to glycemic control
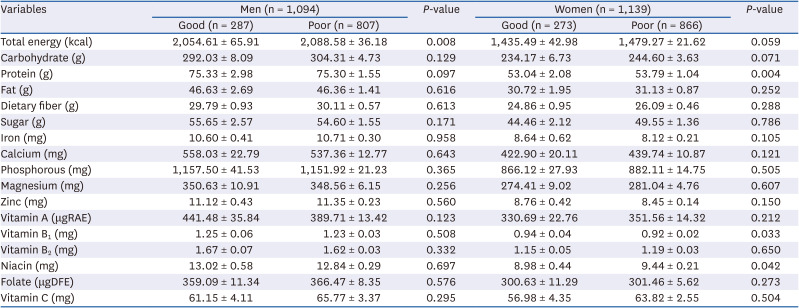
Table 5
Percentage of macronutrients by total energy intake of the participants according to glycemic control
Values are expressed as mean ± SE.
The study sample was divided into 2 groups based on glycemic control (defined as hemoglobinA1c < 6.5% or above).
P-values were obtained by Wald F statistics. Analysis of variance adjusted age.
1)% of carbohydrate intake ratio in total energy intake = {[carbohydrate intake (g) × 4 (kcal)]/total energy intake (kcal)} × 100.
2)% of protein intake ratio in total energy intake = {[protein intake (g) × 4 (kcal)]/total energy intake (kcal)} × 100.
3)% of fat intake ratio in total energy intake = {[fat intake (g) × 9 (kcal)]/total energy intake (kcal)} × 100.
Table 6
Rate of energy1) and nutrients2) by KDRIs of the participants according to glycemic control
The data were analyzed using the complex sample module. All values are presented as unweighted number (weighted %).
The study sample was divided into 2 groups according to glycemic control (defined as an hemoglobinA1c < 6.5% or above).
P-values were obtained by Wald F statistics. Analysis of variance adjusted age.
KDRI, Dietary Reference Intake for Korean; EER, estimated energy requirements; EAR, estimated average requirements; AI, adequate intake; RNI, recommended nutrient intake.
1)Energy intake ratio compared to EER recommended by the KDRIs.
2)Nutrient intake ratio compared to EAR, AI, and RNI recommended by the KDRIs.
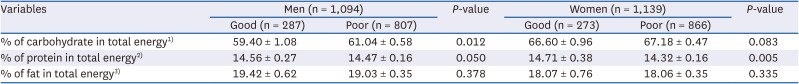
A significant difference was found in the ratio of carbohydrate intake to the total energy consumed between the good and poor glycemic control groups in men (good, 59.40 ± 1.08%; poor, 61.04 ± 0.58%, P = 0.012); however, no difference was observed in women (P = 0.083). And significant difference was found in the ratio of protein intake to the total energy consumed between the good and poor glycemic control groups in women (good, 14.71 ± 0.38%; poor, 14.32 ± 0.16%, P = 0.005); however, no difference was observed in men (P = 0.050). Furthermore, there was no significant difference in fat intake ratios in total energy intake for both men and women adjusted age.
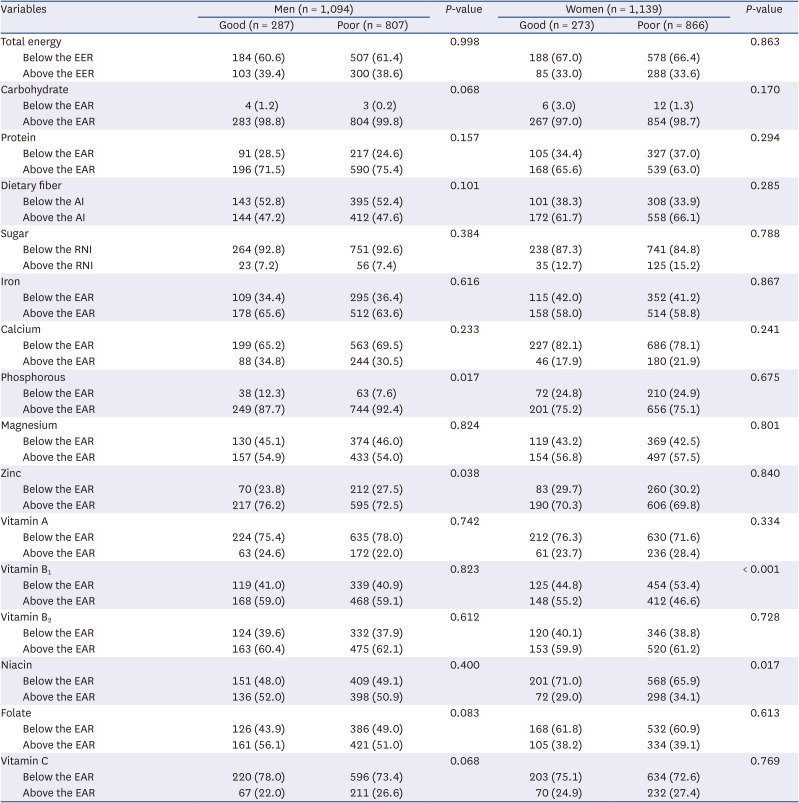
The nutrient that exhibited statistically significant results between the groups in the EAR intake fraction of macro and micronutrients was phosphorus (P = 0.017) and zinc (P = 0.038) in men, but there was a significant difference between the good and poor glycemic control groups in women was vitamin B1 (P < 0.001) and niacin (P = 0.017). The nutrient with the highest intake rate compared with KDRIs was carbohydrate (97.0–99.8%), with no significant differences between sexes with adjusted age. The rate of intake below the EER accounted for > 60% in all groups, and the rate of intake below the EAR was high for calcium (65.2–82.1%), vitamin A (71.6–78.0%), and vitamin C (72.6–78.0%). For niacin and folic acid, the rates of men consuming more than the EAR were 50.9–52.0% and 51.0–56.1%, respectively, demonstrating great difference from the 29.0–34.1% and 38.2–39.1% in women. The proportion of dietary fiber intake above AI was higher in women (61.7–66.1%) than in men (47.2–47.6%), and the RNI for sugars was < 20% of the total energy consumed in men (92.6–92.8%) compared with that in women (84.8–87.3%).
Risk of poor glycemic control according to carbohydrate intake ratio among total energy intake
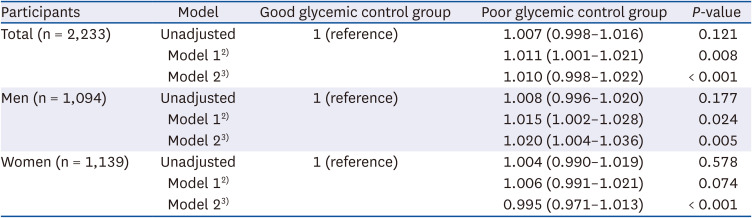
Table 7 reveals the results of the complex sample logistic regression analysis conducted to determine the effect of carbohydrate intake ratio of total energy intake on the dependent variable, that is, glycemic control, which is the aim of this study. The degree of glycemic control, which is the dependent variable, uses the good glycemic control group as the reference category, and when the carbohydrate intake ratio, which is the independent variable, increases by 1%, the OR for the poor glycemic control group with an HbA1c ≥ 6.5 are derived. In the unadjusted crude model, when carbohydrate intake ratio in total energy intake increased by 1%, the likelihood of poor glycemic control increased by 1.007-fold (95% CI, 0.998–1.016; P = 0.121). In model 1, which uses age and sex as adjustment variables, an increase of up to 1.011-fold is possible (95% CI, 1.001–1.021; P = 0.008). Furthermore, in model 2, which added variables such as diabetes duration, frequency of fruit consumption, frequency of lunch, and frequency of dinner, the risk of poor glycemic control increased by 1.010-fold as the carbohydrate intake ratio increased (95% CI, 0.998–1.022; P < 0.001). In the crude model for men, when the carbohydrate intake ratio increased by 1%, the likelihood of poor glycemic control increased by 1.008-fold (95% CI, 1.996–1.020; P = 0.177). Adjusted model 1 had a greater likelihood of poor glycemic control (OR 1.015; 95% CI, 1.002–1.028; P = 0.024), which was statistically significant. The possibility of poor glycemic control was high in adjusted model 2, statistical significance was observed (OR, 1.020; 95% CI, 1.004–1.036; P = 0.005). The crude model and adjusted model 1 demonstrated a lower likelihood of poor glycemic control in women than in men (OR, 1.004; 1.006), and there was no significant difference (P = 0.578, P = 0.074). In adjusted model 2, the possibility of poor glycemic control decreased as the carbohydrate intake ratio in total energy intake increased by 1% in women (OR, 0.995; 95% CI, 0.971–1.013; P < 0.001).
Table 7
OR1) and 95% CI according to % of carbohydrate in total energy
OR, odds ratio; CI, confidence interval; n, unweighted number.
1)OR was derived from the multivariate logistic regression analysis.
2)Model 1 is adjusted for age and sex.
3)Model 2 is adjusted for diabetes duration, frequency of fruit consumption, frequency of lunch, frequency of dinner + variables in model 1.
DISCUSSION
This study was conducted using KNHANES VIII (2019–2021) data to identify factors affecting glycemic control in patients with type 2 diabetes aged 30 yrs or older in Korea and provide basic data for MNT. KNHANES is a nationally representative cross-sectional survey designed to evaluate the health behaviors, health status, and food and nutrient intake of Koreans [15], and data were collected via health surveys, health examinations, and nutritional surveys.
Regarding the general characteristics of the participants, the 70s age group had the highest rate of patients with diabetes (32.0%). The 30s age group had the highest rate of participants with good glycemic control (32.5%), and there was significant difference among the groups (P = 0.036). Previous studies have reported that the probability of poor glycemic control decreases as age increases [16].
Although there was no significant difference in occupational classification in this study, several studies have demonstrated that age and occupation can affect glycemic control. There are studies showing that the level of self-management of housewives is higher than that of service workers [17], and there is a study reporting that lack of time and increased stress in 40s, during which there is an active social life, can affect poor glycemic control [16]. In a study by Jeong et al. [18], which examined the health and nutritional status related to sedentary time among people aged 30 to 59 yrs, it was reported that office workers had the longest sedentary time and that the rate of diabetes diagnosis was significantly higher than that of other occupations. These results indicate that the development of individualized intervention programs that consider occupation and life cycle characteristics is necessary.
In the variable of diabetes duration, glycemic control becomes more difficult as the duration increases (P < 0.001). According to the KDA practice guideline, as the duration of diabetes increases, insulin secretion from the pancreas decreases, and insulin resistance may worsen with age. Glycemic control becomes more difficult even with combination therapy with various drugs, including insulin [5].
In the lunch and dinner intake frequency variable that demonstrated significant results (P = 0.048, P = 0.044 respectively), the rate of good glycemic control was 23.9% and 25.1% among participants who consumed lunch and dinner more than 5 times a week, whereas the rate of good glycemic control was 28.9% and 13.6% among those who consumed lunch and dinner 3–4 times a week. Park et al. [19], who studied the frequency of meal intake, reported that men who consumed 2 meals a day were more likely to develop metabolic syndrome than men who consumed 3 meals a day. Furthermore, women who eat 2 meals a day and skip breakfast were more likely to have elevated fasting blood sugar and triglyceride levels. In addition, among participants who rarely consumed dinner 1–2 times a week, 33.3% had good glycemic control, which is consistent with the results of a study in which fasting blood sugar levels decreased in women who skipped dinner [20]. These results indicated that fasting time increased because of skipping dinner, resulting in a decrease in fasting blood sugar and HbA1c levels; however, because there was no significant difference in the total energy intake, further research is warranted. The results of this study related to meal frequency are similar to those of Park et al. [19]. Compared with participants with irregular eating habits, participants who ate 3 meals regularly showed nutritional adequacy and healthier body weight, BMI, waist circumference, blood pressure, fasting glucose, total cholesterol, and triglyceride levels [19]. Moreover, studies have shown that reducing meal frequency increases appetite-related hormones, causing weight gain and, as a result, metabolic disorders that can increase cardiovascular risk [21]. According to this evidence, the eating behavior of consuming sufficient energy, macronutrients, and micronutrients through regular meals can contribute not only to glycemic control but also to maintaining good nutritional status, which is the ultimate goal of MNT. In conclusion, meal frequency is related to meal quality, and maintaining regular meals is a means of increasing the likelihood of good glycemic control.
According to a study using data from KNHANES VIII to explore the aspects of single-person eating behavior among adults aged 20 or older, as the frequency of single-person meals increases, the likelihood of high-carbohydrate intake and low protein intake increases [22]. The results analyzed in this study presented no statistically significant differences between glycemic control and eating alone.
According to the survey results, only 6.4% received nutritional education within the past year, and the proportion of those in the group with good glycemic control was only 22.8%. In this study, the nutritional education experience of the KNHANES VIII was lower than the results of the KNHANES V study [23], where 8.4% had nutritional education within 1 year and 20.3% had diabetes management education experience. These results are still insufficient compared to reports recommending that education and support are needed at 4 key points for diabetes self-management: at diagnosis, every year or when treatment goals are not achieved, when complications occur, and during life transitions [24]. A study by Lee et al. [25] also explored the awareness, utilization, and effect of nutrition labels on food selection in participants with diabetes, and the results were 48.8%, 11.4%, and 9.6%, respectively, and the utilization of nutrition labels among participants with diabetes in Korea was only < 50%. According to these results, people who have not received diet therapy education have low nutrition label utilization, and that utilizing nutrition labels as a means to show interest in health and practice proper eating habits will be helpful in managing a healthy diet for patients with diabetes [25]. In this study, the rate of good glycemic control among participants who were aware of nutrition labels (23.9%) was not significantly different from the rate of good glycemic control (26.2%) among those who were unaware of nutrition labels. Furthermore, the rate of good glycemic control among participants who received nutritional education (23.2%) was not significantly different from the rate of good glycemic control (24.9%) among those who did not receive education. This was a survey of simple nutritional education, not diabetes management education. There is no comparative data since no diabetes management education survey has been conducted since 2012. Thus, additional investigation is warranted to determine whether diabetes management education is provided, education location, reeducation rate, and education time. Diabetes is a chronic disease that requires not only drug treatment but also self-management [23]. The KDA practice guidelines [5] recommend that patients with diabetes should receive individualized MNT education, and that MNT should be taught by a registered dietitian with diabetes education qualifications. Individualized MNT by a registered dietitian has consistently shown various benefits, including glycemic control improvement, weight reduction, and blood pressure control [13]. Most diabetes practice guidelines recommend active MNT implementation, and recent systematic literature reviews and meta-analyses also support this [26]. Furthermore, MNT provided by a registered dietitian is cost-effective [1327]. With this compelling evidence, patients with diabetes need individualized MNT according to their medical situation, control goals, and individual preferences [5]. Additionally, the active participation of patients and guardians in the nutritional intervention process is recommended, including nutritional status assessment and meal planning, and that reevaluation and repeated education should be conducted in parallel [5].
Among the health behavior variables, there was no significant difference. But, results from the DIRECT study showed a negative correlation between weight loss and diabetes remission in overweight or obese patients with diabetes. Therefore, patients who are overweight or have obesity accompanied by diabetes need to control their weight [28]. And there was no significant difference in the rate of the group with good or poor glycemic control in physical activity. But, several studies have reported the relationship between regular exercise and improved glycemic control. The consensus report by the American Diabetes Association and the European Association for the Study of Diabetes reveals that physical activity can have a significant impact on the cardiometabolism of T2DM [29]. Additionally, a study by Delevatti et al. [30] reported that regular aerobic exercise improved glycemic control in adult patients with T2DM, reducing the time of hyperglycemia and HbA1c. The effect of aerobic exercise on improving glycemic control can be maximized by continuing exercise for more than 45 min after a meal [30]. In a meta-analysis of exercise methods for patients with T2DM, exercise combining aerobic and strength training exhibited a more significant improvement in glycemic control than exercise alone [31]. Thus, regular exercise after meals is essential for glycemic control and can ultimately affect the reduction of cardiovascular complications and mortality [32]; thus, the development of an individualized exercise program for diabetes self-management is warranted. Furthermore, in previous studies [1633], in patients with diabetes comorbid with hypertriglyceridemia, the likelihood of being in the poor glycemic control group increased by 1.82- and 2.78-fold, respectively, based on the good glycemic control group. In patients with T2DM, hypertriglyceridemia worsens when glycemic control is poor, and strict glycemic control can lower blood triglyceride concentration [16]. The KDA recommends that in addition to active glycemic control, priority should be on the treatment of secondary factors such as lifestyle modifications, including drinking cessation and weight loss, which can address hypertriglyceridemia [5].
As a result of calculating the ratio of macronutrients to total energy consumed in the food intake survey, the good glycemic control group in men revealed a significantly lower carbohydrate intake ratio than the poor glycemic control group. The diabetes fact sheet (DFS) using KNHANES surveyed from 2016 to 2020 reported that participants with diabetes consumed fewer energy, protein, and fat and had a higher carbohydrate intake rate compared to participants without diabetes [3435]. Although the carbohydrate intake ratio of total energy intake decreased slightly from 68.3% in DFS 2020 to 66.3% in DFS 2021, it is still consumed at a higher rate compared to 64.7% and 62.4% of participants without diabetes [3435]. The KDA practice guidelines [5] recommend that Korean patients with diabetes reduce their carbohydrate intake to 55–65% of the total energy. However, prospective studies are lacking and the intake rate is high compared to other countries [34]; thus, it is recommended to individualize the intake according to the patient’s current condition and metabolic goals [5]. The carbohydrate intake ratio among the total energy examined in this study was calculated to be an average of 59.40 ± 1.08% for men and 66.60 ± 0.96% for women in the good glycemic control group. Furthermore, women have a higher carbohydrate intake rate than men and a higher rate of noncompliance with the KDA practice guidelines. According to statistics on energy intake and appropriate intake status published by Yoon et al. [36], 86.5–95.5% of adults over 30 yrs of age met the EER. However, in this study, because of comparing nutrient intake ratios with KDRIs, more than 60% of all participants demonstrated an intake ratio below EER. This is believed to be related to the results of Salle et al. [37], who suggested that patients with diabetes underreport their food intake as a problem.
Investigating the level of compliance with dietary recommendations among those diagnosed and undiagnosed with T2DM in Korea using KNHANES data from 1998 to 2012, the results reveal that the overall level of compliance with dietary recommendations was low, and one of the lowest recommendations was carbohydrate intake control [38]. The level of adherence to limiting carbohydrate consumption to 50–60% of the total energy was low in both diagnosed and undiagnosed patients with diabetes, with only 10–20% of patients following this guideline [38].
In a meta-analysis of carbohydrate-restricted diets in patients with T2DM, HbA1c, fasting glucose, body weight, triglycerides, and SBP were significantly reduced when decreased to up to 45%, but this was not maintained over the 12-mon follow-up [39]. Additionally, owing to the nature of the traditional Korean diet, reducing carbohydrates below 50% is difficult, and there is a possibility of long-term cardiovascular risk due to a decrease in carbohydrate intake and an increase in fat intake. Thus, further research is needed that includes not only the quantity of carbohydrates, but also the quality and ratio of macronutrients.
In the regression analysis performed in this study, when the carbohydrate intake ratio in total energy intake increased by 1%, the likelihood of poor glycemic control increased by up to 1.011-fold. As a result of evaluating the food patterns of the high-carbohydrate diet of the general Korean population aged 20 or older using the 2013–2015 KNHANES data, it was reported that 58% of men and 60% of women exceeded the recommended carbohydrate intake [40]. Furthermore, a positive correlation between high-carbohydrate diets and metabolic diseases was observed [40]. Therefore, maintaining a carbohydrate intake ratio of 55–65% based on KDRIs [14] and controlling the carbohydrate intake ratio among the total energy consumed may facilitate good glycemic control. In conclusion, maintaining healthy behaviors is essential to achieving the treatment goals of patients with diabetes [25], including diabetes self-management education and support, MNT, physical activity, smoking cessation, and addressing social determinants of health [4142].
There are several limitations in evaluating the eating behavior of participants with diabetes; thus, caution should be exercised when interpreting the data. First, because this study analyzed cross-sectional data, causal relationships could not be evaluated and may not reflect changes in variables. Second, because self-reported information was used in the medical history survey, misclassification of diabetes is possible. Third, 24-h daily recall reports may not reflect the usual dietary intake, and some measurement errors may occur due to the retrospective evaluation of the dietary intake. Thus, additional longitudinal studies are warranted to determine the rationale why patients with diabetes consume more carbohydrates and consume fewer energy than patients without diabetes.
This study confirmed that as the ratio of carbohydrate intake in total energy intake increases, the likelihood of poor glycemic control also increases in patients with diabetes. Therefore, to improve glycemic control in patients with diabetes, controlling the carbohydrate intake may be helpful. As a specific alternative, priority should be given to lifestyle modification such as controlling the carbohydrate intake ratio and combining regular meals and exercise. To attain this, individualized educational programs are needed according to medical situation, control goals, occupation, life cycle, and individual preferences, and patients and guardians must be actively involved in the nutritional intervention process, including nutritional status assessment and meal planning. For long-term management, reevaluation and repeated education by a registered dietitian qualified in diabetes education must be conducted in parallel, and continued motivation for health is necessary.
 XML Download