Journal List > Diabetes Metab J > v.47(6) > 1516084729

Yoo, Han, Kim, Nam, Park, Rhee, and Lee: Differential Impact of Obesity on the Risk of Diabetes Development in Two Age Groups: Analysis from the National Health Screening Program

Abstract

Background

The effect of obesity on the development of type 2 diabetes mellitus (DM) in different age groups remains unclear. We assessed the impact of obesity on the development of DM for two age groups (40-year-old, middle age; 66-year-old, older adults) in the Korean population.

Methods

We analyzed Korean National Health Insurance Service data of 4,145,321 Korean adults with 40- and 66-year-old age without DM, between 2009 and 2014. Participants were followed up until 2017 or until the diagnosis of DM. We assessed the risk of DM based on the body mass index and waist circumference of the participants. Multiple confounding factors were adjusted.

Results

The median follow-up duration was 5.6 years. The association of general and abdominal obesity with the risk of DM development was stronger in the 40-year-old group (general obesity: hazard ratio [HR], 3.566, 95% confidence interval [CI], 3.512 to 3.622; abdominal obesity: HR, 3.231; 95% CI, 3.184 to 3.278) than in the 66-year-old group (general obesity: HR, 1.739; 95% CI, 1.719 to 1.759; abdominal obesity: HR, 1.799; 95% CI, 1.778 to 1.820). In the 66-year-old group, abdominal obesity had a stronger association with the development of DM as compared to general obesity. In the 40-year-old group, general obesity had a stronger association with the risk of DM development than abdominal obesity.

Conclusion

The influence of general and abdominal obesity on the development of DM differed according to age. In older adults, abdominal obesity had a stronger association with DM development than general obesity.

INTRODUCTION

Obesity is an important risk factor for multiple conditions, including diabetes mellitus (DM) and cardiovascular disease [1,2]. It is associated with an estimated 5 to 20 years of decreased life expectancy [3]. The prevalence of obesity has increased over the past 50 years worldwide [4,5], in both middle-aged and older adult populations [6].
Similar to obesity, diabetes has become a serious public health concern [7]. Obesity is considered a major driving factor of the DM epidemic and accounts for 44% of DM cases worldwide [8]. This strong association between DM and obesity has led to the connotation of the term “diabesity” [8].
Age is another important factor in the development of DM [9]. Younger age is a protective factor against DM development, which significantly attenuates the risk of DM, while older adults become more vulnerable to DM [10]. Moreover, obesity in older adults has led to an increase in the incidence of type 2 diabetes mellitus (T2DM), causing high mortality, reduced functional status, and increased risk of institutionalization [11].
Despite the consensus that age, obesity, and risk of DM are significantly related, only a few studies have assessed the incidence of DM based on age and obesity [12,13]. Moreover, while body mass index (BMI) is the most commonly used measure of general obesity, it does not accurately reflect regional adiposity [14,15]. Waist circumference (WC), a more direct measure of abdominal obesity, has been proven to predict obesity-related outcomes and the risk of DM [14,16]. A recent study reported that both BMI and WC could comparatively predict the risk of DM in both sexes [17]. However, to the best of our knowledge, no study has assessed BMI, WC, age, and the risk of DM development altogether.
Wang et al. showed variations in the impact of metabolic risk factors on diabetes risk by age group. Metabolic factors’ population attributable risk of incident diabetes is 73.8% in 40 to 64 years old but decreases thereafter [18]. We hypothesized that abdominal obesity and general obesity would have a differential impact on the risk of diabetes in different age groups. In South Korea, people go through a life transition point health checkup at the age of 40 and 66, representing mid-life and older adults, respectively. Therefore, we conducted this large-scale analysis using the life transition point health checkup data to elucidate the relationship between these factors for two different age groups in the Korean population, i.e., the 40- and 66-year-old groups.

METHODS

Study population

We used the life transition point health checkup data extracted from the National Health Insurance Service (NHIS) record, a large-scale cohort representing the Korean population [19]. NHIS is a nonprofit public insurance group run by the Korean government, covering almost the entire Korean population of approximately 50 million (97.2%) [20].
When Korean individuals attain the age of 40 and 66 years, they undergo a complex health checkup called a life transition point health checkup. Screening involves general screening, lifestyle assessment, laboratory tests, and consultations by doctors [21,22]. NHIS maintains records of all the data, International Classification of Diseases, Tenth Revision (ICD-10) codes, and the treatment administered to the patients [23]. Furthermore, this database provides data, including health screening questionnaires and laboratory findings, which form the Korean National Health Screening (KNHS) database [20]. The present study was approved by the NHIS (NHIS-2020-1-224). Informed consent was waived because all the data were anonymized and de-identified.

Covariates

Bodyweight (kg) and height (cm) were recorded using an electronic scale. WC (cm) was defined as the distance between the midpoint of the rib cage and the iliac crest [19]. Blood pressure was measured using a sphygmomanometer, with at least 5 minutes of rest before measurement. All measurements were performed by trained examiners. BMI was calculated as weight (kg) divided by height (m) squared. Blood samples were collected after at least 8 hours of fasting. A standardized screening questionnaire was used to assess health-related behaviors.
Smoking status was categorized as never smoker, past smoker, or current smoker, according to the National Health Interview Survey definition [24]. Alcohol consumption was categorized into drinking <30 g/day and drinking ≥30 g/day [25]. Participants who engaged in >25 minutes of high-intensity physical activity for ≥3 days per week or >30 minutes of moderate-intensity physical activity for ≥5 days per week were considered physically active [26]. Participants were categorized into the low-income group when their income was in the lowest 25 percentile of the population.

Study design and definition of diseases

We analyzed the data of Koreans who underwent a life transition point health checkup between 2009 and 2014 at 40 and 66 years (n=4,599,190). Our team assessed this database in a previous study [27]. Participants with the following conditions were excluded: missing data on covariates (n=103,780) and history of DM at baseline (n=350,089). Finally, 4,145,321 participants were included in the present study, with 2,905,752 participants in the 40-year-old group and 1,239,569 in the 66-year-old group. Participants were followed until 2017 or until newly developed DM was detected (Supplementary Fig. 1).
The development of DM was assessed using the NHIS claims record and KNHS record at the end of 2017. Newly developed DM was defined as fasting blood glucose of ≥126 mg/dL in KNHS after 2009 or antidiabetic medication claim history with ICD-10 code E11–14 after 2009 [28,29]. To exclude participants with DM at baseline, participants with fasting blood glucose of ≥126 mg/dL in KNHS before 2009 or claims history for ICD-10 code E11–14 before 2009 were excluded. The risk of DM development was assessed based on the BMI and WC of the participants.
We divided the participants into five groups according to their BMI (<18.5 [underweight]; 18.5≤ BMI <23 [normal, reference]; 23≤ BMI <25 [pre-obese]; 25≤ BMI <30 [obese class I]; 30≤ BMI [obese class II]; kg/m2), as per the Korean Society for the Study of Obesity (KSSO)’s classification for obesity and a previous study [20,30]. In addition, participants were divided into six groups by WC (men: <80.0, 80.0–84.9, 85.0–89.9, 90.0–94.9, 95.0–99.9, and ≥100.0 cm; women: <75.0, 75.5–79.9, 80.0–84.9, 85.0–89.9, 90.0–94.9, and ≥95.0 cm). We used 85.0–89.9 and 80.0–84.9 cm as the reference for men and women, respectively [31]. As East Asians have higher body fat percentages compared with non-Asians at the same level of BMI, BMI of ≥25 (kg/m2) was defined as general obesity following World Health Organization recommendation and 2018 KSSO guideline [30,32]. WC of >90 cm for men and >85 cm for women were defined as abdominal obesity [31].
Hypertension was considered to be present if one of the following criteria was met: systolic blood pressure of ≥140 mm Hg or diastolic blood pressure of ≥90 mm Hg and presence of ICD codes I 10–15 with a history of antihypertensive medication claim. Hyperlipidemia was defined if one of the following criteria was met: laboratory data (total cholesterol level ≥240 mg/dL) or ICD code E78 with a claim history of dyslipidemia medication. Chronic kidney disease (CKD) was defined as an estimated glomerular filtration rate of <60 mL/min/1.73 m2 by the Modification of Diet in Renal Disease method [33].

Statistical analysis

Continuous variables were expressed as mean±standard deviation or geometric means (95% confidence interval [CI]) based on the distribution of variables. Categorical variables are expressed as frequency (%). The incidence was calculated per 1,000 person-years. We used Student’s t-test and Mann-Whitney test to compare continuous variables and the chi-square test to compare categorical variables.
Hazard ratios (HRs) and 95% CI were calculated using the Cox proportional hazards model. The multivariable model was adjusted for model 1: age, sex; model 2: age, sex, smoking status, drinking status, physical activity, and income; and model 3: age, sex, smoking status, drinking status, physical activity, income, hypertension, dyslipidemia, and CKD. Participants were divided into the men and women groups, and the same analysis was conducted. Subgroup analysis was performed using the Cox proportional hazards model.
As a sensitivity analysis, model 4 was created. Model 4 was further adjusted for a family history of diabetes, in addition to model 3. Participants with missing family history variables were additionally removed for model 4 analysis (excluded, n=1,392,168, 33.6%; total n=2,753,153 included for the model 4 analysis). In addition, model 4 was divided into the normoglycemia group (fasting glucose level <100 mg/dL) and the impaired fasting glucose group (fasting glucose level 100 to 125 mg/dL). Two-sided P values of <0.05 were considered statistically significant. All statistical analyses were performed using SAS version 9.4 (SAS Institute Inc., Cary, NC, USA).

RESULTS

Baseline characteristics

Table 1 shows the baseline characteristics of the participants. The median follow-up duration was 5.62±1.84 years. The men participants were 49.54% in the 40-year-old group and 45.25% in the 66-year-old group. The prevalence of hypertension, dyslipidemia, and CKD was significantly higher in the 66-year-old group (P<0.001). The mean BMI was 23.54±3.36 kg/m2 in the 40-year-old group and 24.17±2.99 kg/m2 in the 66-year-old group (P<0.001). The mean WC was 78.69±9.43 and 82.55±8.15 cm in the 40- and 66-year-old groups, respectively. Current smoking, alcohol consumption, and physical activity rates were higher in the 40-year-old group than in the 66-year-old group (P<0.001). The 66-year-old group had a higher lower income rate than the 40-year-old group (P<0.001).

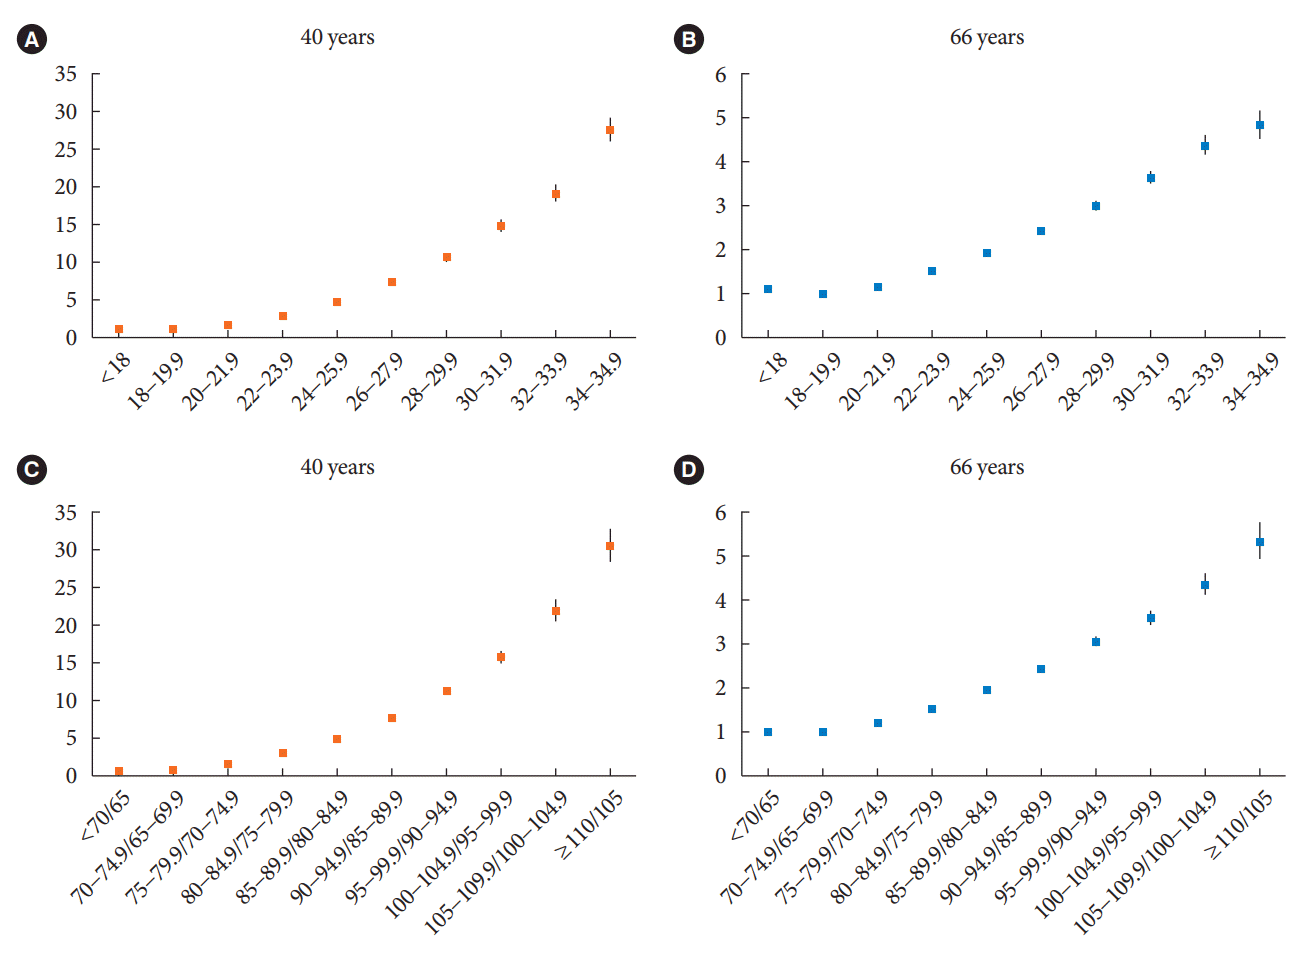
Risk of DM development according to age

Table 2 shows the multivariate analysis results. The presence of general or abdominal obesity was significantly associated with an increased risk of developing DM (model 3, age 40 years: general obesity [HR, 3.556; 95% CI, 3.512 to 3.622], abdominal obesity [HR, 3.231; 95% CI, 3.184 to 3.278]; model 3, age 66 years: general obesity [HR, 1.739; 95% CI, 1.719 to 1.759], abdominal obesity [HR, 1.799; 95% CI, 1.778 to 1.820]).
In both the 40- and 66-year-old groups, BMI and risk of development of DM showed a linear association (Ptrend <0.001) (Fig. 1). The same trend was observed for WC and the risk of development of DM (Ptrend <0.001).
Table 3 shows the risk of DM development according to age and sex. In all age and sex groups, as BMI and WC increased, the risk of DM increased (Ptrend <0.001). Overall, the strength of association of BMI and WC with DM development was greater in the 40-year-old women population than in the 40-year-old men population. In the 66-year-old group, the strength of association of BMI and WC with the risk of DM development was similar for both sexes.
Sensitivity analysis was performed with further adjustment with a family history of diabetes. Overall, the significance and the trend of association showed a similar result in both normoglycemia and impaired fasting glucose groups (Supplementary Tables 1 and 2).

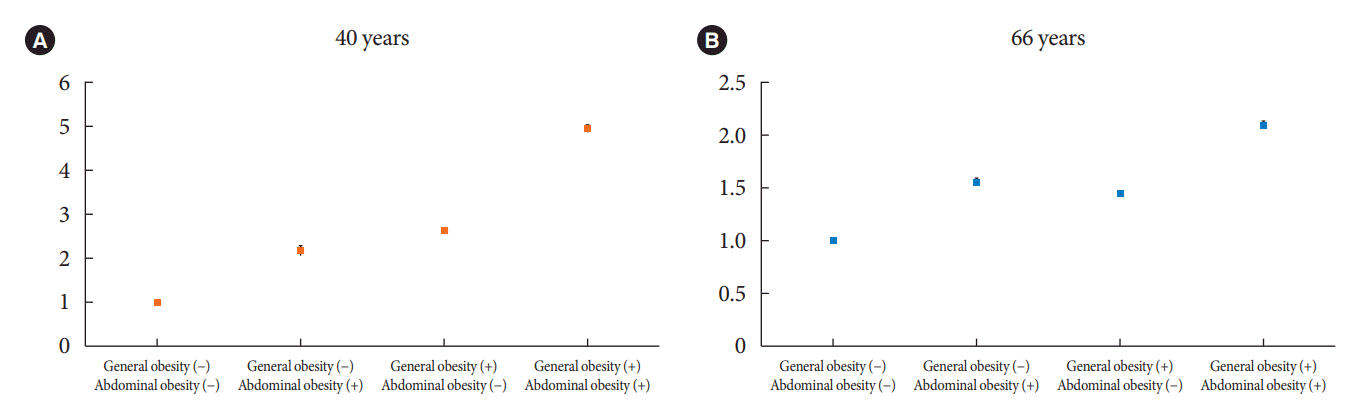
Risk of DM development according to the presence or absence of general and abdominal obesity

Abdominal obesity in the 66-year-old group had a stronger numerical association with DM development than general obesity. At the same time, general obesity had a greater association with the development of DM than abdominal obesity in the 40-year-old group (age 40 years: general obesity [–]/abdominal obesity [–], reference; general obesity [–]/abdominal obesity [+], HR 2.175; general obesity [+]/abdominal obesity [–], HR 2.624; general obesity [+]/abdominal obesity [+], HR 4.935; age 66 years: general obesity [–]/abdominal obesity [–], reference; general obesity [–]/abdominal obesity [+], HR 1.549; general obesity [+]/abdominal obesity [–], HR 1.445; obesity [+]/abdominal obesity [+], HR 2.089) (Fig. 2, Supplementary Table 3).

Subgroup analysis

First, we analyzed the factors that can affect the relationship between BMI and the risk of DM development. In the 40-year-old group, income level did not show any significant interaction with the development of DM (Pinter=0.552), while all other factors showed significant interactions (Pinter<0.001); however, in the 66-year-old group, physical activity level (Pinter=0.055) and income level (Pinter=0.260) showed no significant interactions, while other factors showed significant interactions with the risk of development of DM (CKD, P=0.016; all other factors, Pinter<0.001).
The same analysis was performed for WC and the risk of DM development for both groups. In the 40-year-old group, physical activity was not significantly interact with the risk of DM development (Pinter=0.243), while all other factors showed significant interactions with WC and the risk of DM development (CKD, Pinter=0.013; all other factors, Pinter<0.001). In the 66-year-old group, physical activity level and income level did not show any significant interactions (physical activity, Pinter=0.453; income level, Pinter=0.245), while all other factors showed significant interactions between WC and risk of DM development (CKD, Pinter=0.009; all other factors, Pinter<0.001) (Supplementary Tables 4 and 5).

DISCUSSION

Our findings showed that general obesity and abdominal obesity had a significant linear relationship with the risk of DM development in both the 40- and 66-year-old groups. Both general and abdominal obesity had a stronger numerical association with DM development in the 40-year-old group as compared to that in the 66-year-old group. Abdominal obesity had a greater numerical association with DM development than general obesity in the 66-year-old group, whereas general obesity had a stronger numerical association with DM development than abdominal obesity in the 40-year-old group. Lastly, both general and abdominal obesity had a greater association with DM development in women than in men for the 40-year-old group, but the strength of association was similar in both men and women participants for the 66-year-old group. These findings were consistent after adjusting for confounding factors. Our study is unique as we compared the different impacts of BMI and WC in different age groups and sex in one single large cohort.
Ohn et al. [34] showed that poor insulin β-cell function and the inability to compensate for the declining insulin sensitivity with aging contributed to the development of DM in the Korean population. Due to this physiological change, the incidence and susceptibility to T2DM increased with age [35]. Nevertheless, the prevalence of T2DM is increasing in young individuals, and the increasing prevalence of obesity is speculated to be the underlying cause [12].
Chen et al. [12] assessed the relationship between BMI and risk of DM development according to age in 211,833 Chinese individuals and demonstrated a linear relationship between BMI and the risk of DM development. In the same study, the effect of BMI was greater in younger adults than in older individuals [12]. Another study on Australian women showed that BMI in young adults was positively associated with the development of T2DM in the future, suggesting a cumulative effect of obesity [36]. The impact of obesity on the incidence of DM gradually declined with age, indicating that older adults were less affected by the increased risk of DM posited by weight gain than younger adults [37]. Our study is consistent with previous studies on the association of BMI and risk of DM development for different age groups.
WC has been consistently associated with the risk of DM development [38,39]. A previous study on 61,587 Chinese adults showed an increased risk of DM development in an abdominal obesity population [37]. Our study shows a similar association. Similar to BMI and DM development risk, the impact of high WC was greater in the 40-year-old age group than in the 66-year-old age group. These findings suggest that not only general obesity, but also abdominal obesity might have a stronger effect on the risk of DM development in younger age group than in the older adults group. In addition, in the 66-year-old group, WC might have a stronger impact on the risk of DM development than BMI.
There is a controversy regarding the optimal cut off values in WC to predict metabolic risk in Asian older adults, as each previous study suggested different cut off values [40,41]. Regardless, the studies suggest increased metabolic risk in older adults with increased WC [40,41]. Aging promotes the redistribution of lipids from subcutaneous fat to the abdominal visceral compartment [42]. This age-related fat redistribution may explain our findings. In conclusion, we suggest that abdominal obesity might be associated with the development of DM more strongly than general obesity in older adults.
Notably, high BMI and WC had a stronger association with the risk of DM development in women than in men for the 40-year-old group; however, this difference was attenuated in the 66-year-old group. Women have a higher percentage of body fat and are more prone to the negative effects of the accumulation of fat [37]. In women, fat tends to deposit in the subcutaneous areas, whereas in men, fat accumulates in the visceral areas [43]. However, after menopause, the effect of estrogen fades in women, causing the redistribution of fat from the peripheral subcutaneous fat to visceral areas [44]. A similar distribution pattern of fat in men and postmenopausal women may explain the similar strength of associations between WC, BMI, and risk of DM development in the men and women of the 66-year-old group.
Our study has several strengths. First, we included a large number of participants to represent the Korean population of the community. A previous study that assessed the relationship among BMI, age and risk of DM development was limited because of its relatively weak representation [12]. Second, we evaluated both relatively young and older adult populations. Previous studies have mainly investigated older adult populations [12]. Third, we assessed both general and abdominal obesity and the risk of DM. By incorporating WC into our assessment, our results demonstrated that different components of obesity could differentially affect the development of DM. Fourth, we assessed men and women separately to determine the difference in the impact of general and abdominal obesity on the development of DM for both sexes.
Despite the aforementioned strengths, our study had several limitations. First, although our results supported the potential relationship among age, BMI, WC, and the risk of DM development, this could not be confirmed due to the retrospective nature of the study. In addition, registration bias and selection bias should be considered. Second, parts of our data used self-reported information by participants, which could cause information bias. Third, our study incorporated a single ethnic group, the Korean population. Fourth, we assessed only two age groups, i.e., 40 and 66 years. Other age groups might show different associations. Fifth, conditions that may interfere with serum glycemia, such as corticosteroid use and pancreatopathies were not evaluated. Sixths, even though we screened diabetes with multiple methods, glycosylated hemoglobin data at screening and during the follow-up was unavailable. Lastly, our study did not assess the body composition, visceral adiposity index, or muscle mass of study participants, which could affect fat accumulation and DM development [45,46]. To mitigate this limitation, we assessed the physical activity of participants, which could indirectly reflect the muscular mass of the participants [47,48].
In conclusion, general and abdominal obesity increase the risk of diabetes, regardless of age and sex. In addition, the influence of general and abdominal obesity on the development of diabetes differed according to age and sex. Future prospective study is needed to confirm the differential impact of obesity according to age and sex. Nevertheless, our results support the importance of early intervention for obesity to prevent diabetes.

SUPPLEMENTARY MATERIALS

Supplementary materials related to this article can be found online at https://doi.org/10.4093/dmj.2022.0242.

Supplementary Table 1.

Hazard ratios for diabetes development in 40-year-old group according to the fasting glucose level, after further adjustment with a family history of diabetes
dmj-2022-0242-Supplementary-Table-1.pdf

Supplementary Table 2.

Hazard ratios for diabetes development in 66-year-old group according to the fasting glucose level, after further adjustment with a family history of diabetes
dmj-2022-0242-Supplementary-Table-2.pdf

Supplementary Table 3.

Risk of diabetes mellitus development according to the presence or absence of general and abdominal obesity
dmj-2022-0242-Supplementary-Table-3.pdf

Supplementary Table 4.

Subgroup analysis for general obesity
dmj-2022-0242-Supplementary-Table-4.pdf

Supplementary Table 5.

Subgroup analysis for abdominal obesity
dmj-2022-0242-Supplementary-Table-5.pdf

Supplementary Fig. 1.

Flow diagram of study participants.
dmj-2022-0242-Supplementary-Fig-1.pdf

Notes

CONFLICTS OF INTEREST

No potential conflict of interest relevant to this article was reported.

AUTHOR CONTRIBUTIONS

Conception or design: T.K.Y., Y.H.K., G.E.N., E.J.R., W.Y.L.

Acquisition, analysis, or interpretation of data: K.D.H., S.H.P.

Drafting the work or revising: T.K.Y., S.H.P., E.J.R., W.Y.L.

Final approval of the manuscript: T.K.Y., S.H.P., E.J.R., W.Y.L.

FUNDING

None

ACKNOWLEDGMENTS

This study was conducted as part of the task force team activity of the Korean Society for the Study of Obesity (KSSO). We acknowledge KSSO, NHIS, and their employees for providing the cohort data for the current research.

REFERENCES

1. Czernichow S, Renuy A, Rives-Lange C, Carette C, Airagnes G, Wiernik E, et al. Evolution of the prevalence of obesity in the adult population in France, 2013-2016: the Constances study. Sci Rep. 2021; 11:14152.
crossref
2. Bae JC, Cho NH, Kim JH, Hur KY, Jin SM, Lee MK. Association of body mass index with the risk of incident type 2 diabetes, cardiovascular disease, and all-cause mortality: a community-based prospective study. Endocrinol Metab (Seoul). 2020; 35:416–24.
crossref
3. Bluher M. Obesity: global epidemiology and pathogenesis. Nat Rev Endocrinol. 2019; 15:288–98.
crossref
4. Meldrum DR, Morris MA, Gambone JC. Obesity pandemic: causes, consequences, and solutions: but do we have the will? Fertil Steril. 2017; 107:833–9.
5. Nam GE, Kim YH, Han K, Jung JH, Rhee EJ, Lee WY, et al. Obesity fact sheet in Korea, 2020: prevalence of obesity by obesity class from 2009 to 2018. J Obes Metab Syndr. 2021; 30:141–8.
crossref
6. Mathus-Vliegen EM. Obesity and the elderly. J Clin Gastroenterol. 2012; 46:533–44.
crossref
7. Khan MA, Hashim MJ, King JK, Govender RD, Mustafa H, Al Kaabi J. Epidemiology of type 2 diabetes: global burden of disease and forecasted trends. J Epidemiol Glob Health. 2020; 10:107–11.
crossref
8. Leitner DR, Fruhbeck G, Yumuk V, Schindler K, Micic D, Woodward E, et al. Obesity and type 2 diabetes: two diseases with a need for combined treatment strategies: EASO can lead the way. Obes Facts. 2017; 10:483–92.
crossref
9. Zheng Y, Ley SH, Hu FB. Global aetiology and epidemiology of type 2 diabetes mellitus and its complications. Nat Rev Endocrinol. 2018; 14:88–98.
crossref
10. Wilson PW, Meigs JB, Sullivan L, Fox CS, Nathan DM, D’Agostino RB. Prediction of incident diabetes mellitus in middle-aged adults: the Framingham offspring study. Arch Intern Med. 2007; 167:1068–74.
crossref
11. Kirkman MS, Briscoe VJ, Clark N, Florez H, Haas LB, Halter JB, et al. Diabetes in older adults. Diabetes Care. 2012; 35:2650–64.
crossref
12. Chen Y, Zhang XP, Yuan J, Cai B, Wang XL, Wu XL, et al. Association of body mass index and age with incident diabetes in Chinese adults: a population-based cohort study. BMJ Open. 2018; 8:e021768.
crossref
13. Feller S, Boeing H, Pischon T. Body mass index, waist circumference, and the risk of type 2 diabetes mellitus: implications for routine clinical practice. Dtsch Arztebl Int. 2010; 107:470–6.
14. Choi D, Choi S, Son JS, Oh SW, Park SM. Impact of discrepancies in general and abdominal obesity on major adverse cardiac events. J Am Heart Assoc. 2019; 8:e013471.
crossref
15. Haghighatdoost F, Amini M, Feizi A, Iraj B. Are body mass index and waist circumference significant predictors of diabetes and prediabetes risk: results from a population based cohort study. World J Diabetes. 2017; 8:365–73.
crossref
16. Freemantle N, Holmes J, Hockey A, Kumar S. How strong is the association between abdominal obesity and the incidence of type 2 diabetes? Int J Clin Pract. 2008; 62:1391–6.
crossref
17. Abe M, Fujii H, Funakoshi S, Satoh A, Kawazoe M, Maeda T, et al. Comparison of body mass index and waist circumference in the prediction of diabetes: a retrospective longitudinal study. Diabetes Ther. 2021; 12:2663–76.
crossref
18. Wang T, Zhao Z, Wang G, Li Q, Xu Y, Li M, et al. Age-related disparities in diabetes risk attributable to modifiable risk factor profiles in Chinese adults: a nationwide, population-based, cohort study. Lancet Healthy Longev. 2021; 2:e618–28.
crossref
19. Cho JH, Kwon HM, Park SE, Jung JH, Han KD, Park YG, et al. Protective effect of smoking cessation on subsequent myocardial infarction and ischemic stroke independent of weight gain: a nationwide cohort study. PLoS One. 2020; 15:e0235276.
crossref
20. Rhee EJ, Kwon H, Park SE, Han KD, Park YG, Kim YH, et al. Associations among obesity degree, glycemic status, and risk of heart failure in 9,720,220 Korean adults. Diabetes Metab J. 2020; 44:592–601.
crossref
21. National Health Insurance Service. National Health Insurance System of Korea. Wonju: National Health Insurance Service;2015.
22. National Health Insurance Service. National Health Insurance & Long-Term Care Insurance System in Republic of Korea. Wonju: National Health Insurance Service;2022.
23. Song SO, Jung CH, Song YD, Park CY, Kwon HS, Cha BS, et al. Background and data configuration process of a nationwide population-based study using the Korean National Health Insurance System. Diabetes Metab J. 2014; 38:395–403.
crossref
24. Ryan H, Trosclair A, Gfroerer J. Adult current smoking: differences in definitions and prevalence estimates: NHIS and NSDUH, 2008. J Environ Public Health. 2012; 2012:918368.
25. Traversy G, Chaput JP. Alcohol consumption and obesity: an update. Curr Obes Rep. 2015; 4:122–30.
crossref
26. Lanier JB, Bury DC, Richardson SW. Diet and physical activity for cardiovascular disease prevention. Am Fam Physician. 2016; 93:919–24.
27. Seo MH, Kim YH, Han K, Jung JH, Park YG, Lee SS, et al. Prevalence of obesity and incidence of obesity-related comorbidities in Koreans based on National Health Insurance Service Health Checkup data 2006-2015. J Obes Metab Syndr. 2018; 27:46–52.
28. American Diabetes Association Professional Practice Committee. 2. Classification and diagnosis of diabetes: standards of medical care in diabetes-2022. Diabetes Care. 2022; 45(Suppl 1):S17–38.
29. Hur KY, Moon MK, Park JS, Kim SK, Lee SH, Yun JS, et al. 2021 Clinical practice guidelines for diabetes mellitus of the Korean Diabetes Association. Diabetes Metab J. 2021; 45:461–81.
crossref
30. Seo MH, Lee WY, Kim SS, Kang JH, Kang JH, Kim KK, et al. 2018 Korean Society for the Study of Obesity guideline for the management of obesity in Korea. J Obes Metab Syndr. 2019; 28:40–5.
crossref
31. Lee SY, Park HS, Kim DJ, Han JH, Kim SM, Cho GJ, et al. Appropriate waist circumference cutoff points for central obesity in Korean adults. Diabetes Res Clin Pract. 2007; 75:72–80.
crossref
32. World Health Organization, Regional Office for the Western Pacific. The Asia-Pacific perspective: redefining obesity and its treatment. Sydney: Health Communications Australia;2000.
33. Levey AS, Bosch JP, Lewis JB, Greene T, Rogers N, Roth D. A more accurate method to estimate glomerular filtration rate from serum creatinine: a new prediction equation. Ann Intern Med. 1999; 130:461–70.
crossref
34. Ohn JH, Kwak SH, Cho YM, Lim S, Jang HC, Park KS, et al. 10-Year trajectory of β-cell function and insulin sensitivity in the development of type 2 diabetes: a community-based prospective cohort study. Lancet Diabetes Endocrinol. 2016; 4:27–34.
crossref
35. Gunasekaran U, Gannon M. Type 2 diabetes and the aging pancreatic beta cell. Aging (Albany NY). 2011; 3:565–75.
crossref
36. Luo J, Hodge A, Hendryx M, Byles JE. Age of obesity onset, cumulative obesity exposure over early adulthood and risk of type 2 diabetes. Diabetologia. 2020; 63:519–27.
crossref
37. Wu L, Liu H, Cui Z, Hou F, Gong X, Zhang Y, et al. Fluctuations in waist circumference increase diabetes risk: a 4-year cohort study in 61,587 older adults. Nutr Metab (Lond). 2021; 18:99.
crossref
38. Janiszewski PM, Janssen I, Ross R. Does waist circumference predict diabetes and cardiovascular disease beyond commonly evaluated cardiometabolic risk factors? Diabetes Care. 2007; 30:3105–9.
crossref
39. Siren R, Eriksson JG, Vanhanen H. Waist circumference a good indicator of future risk for type 2 diabetes and cardiovascular disease. BMC Public Health. 2012; 12:631.
crossref
40. Gu Z, Li D, He H, Wang J, Hu X, Zhang P, et al. Body mass index, waist circumference, and waist-to-height ratio for prediction of multiple metabolic risk factors in Chinese elderly population. Sci Rep. 2018; 8:385.
crossref
41. Zhai Y, Zhao WH, Chen CM. Verification on the cut-offs of waist circumference for defining central obesity in Chinese elderly and tall adults. Zhonghua Liu Xing Bing Xue Za Zhi. 2010; 31:621–5.
42. Mancuso P, Bouchard B. The impact of aging on adipose function and adipokine synthesis. Front Endocrinol (Lausanne). 2019; 10:137.
crossref
43. Gavin KM, Bessesen DH. Sex differences in adipose tissue function. Endocrinol Metab Clin North Am. 2020; 49:215–28.
crossref
44. Ambikairajah A, Walsh E, Tabatabaei-Jafari H, Cherbuin N. Fat mass changes during menopause: a metaanalysis. Am J Obstet Gynecol. 2019; 221:393–409.
crossref
45. Maliszewska K, Adamska-Patruno E, Goscik J, Lipinska D, Citko A, Krahel A, et al. The role of muscle decline in type 2 diabetes development: a 5-year prospective observational cohort study. Nutrients. 2019; 11:834.
crossref
46. Wei J, Liu X, Xue H, Wang Y, Shi Z. Comparisons of visceral adiposity index, body shape index, body mass index and waist circumference and their associations with diabetes mellitus in adults. Nutrients. 2019; 11:1580.
crossref
47. Distefano G, Goodpaster BH. Effects of exercise and aging on skeletal muscle. Cold Spring Harb Perspect Med. 2018; 8:a029785.
crossref
48. McGlory C, van Vliet S, Stokes T, Mittendorfer B, Phillips SM. The impact of exercise and nutrition on the regulation of skeletal muscle mass. J Physiol. 2019; 597:1251–8.
crossref

Fig. 1.
Risk of diabetes mellitus (DM) development based on body mass index (BMI). Risk of DM according to BMI in (A) 40 years old and (B) 66 years old, X-axis=BMI (kg/m2); Y-axis=hazard ratio (HR). Risk of DM according to waist circumference (WC) in (C) 40 years old and (D) 66 years old, X-axis=WC, men/women, cm; Y-axis=HR.
dmj-2022-0242f1.tif
Fig. 2.
Risk of diabetes mellitus development based on presence of general and abdominal obesity, (A) 40 years old, (B) 66 years old. X-axis=presence of general obesity or abdominal obesity; Y-axis=hazard ratio. General obesity (+)=body mass index (BMI) ≥25 kg/m2; general obesity (–)=BMI <25 kg/m2; abdominal obesity (+)=waist circumference (WC) ≥90 cm for men and ≥85 cm for women; abdominal obesity (–)=WC <90 cm for men and <85 cm for women.
dmj-2022-0242f2.tif
Table 1.
Baseline characteristics of study participants (n=4,145,321)
Characteristic 40 years 66 years P value
Number 2,905,752 1,239,569
Male sex 1,439,587 (49.5) 560,882 (45.3) <0.0001
BMI, kg/m2 23.54±3.36 24.17±2.99 <0.0001
WC, cm 78.69±9.43 82.55±8.15 <0.0001
Height, cm 165.61±8.44 158.95±8.29 <0.0001
Body weight, kg 64.91±12.46 61.16±9.44 <0.0001
Systolic blood pressure, mm Hg 118.47±13.74 127.78±15.15 <0.0001
Diastolic blood pressure, mm Hg 74.67±10.04 77.76±9.69 <0.0001
Fasting blood glucose, mg/dL 93.75±15.86 97.87±16.2 <0.0001
Total cholesterol, mg/dL 193.56±34.54 199.55±37.74 <0.0001
HDL-C, mg/dL 56.34±16.74 54.35±17.08 <0.0001
LDL-C, mg/dL 112.76±35.96 119.26±39.13 <0.0001
TG, mg/dL 105.8 (105.72–105.87) 117.13 (117.02–117.23) <0.0001
Current smokinga 804,080 (27.7) 155,769 (12.6) <0.0001
Alcohol drinkingb 233,057 (8.0) 58,234 (4.7) <0.0001
Physically activec 479,820 (16.5) 304,313 (24.6) <0.0001
Low incomed 522,199 (18.0) 297,638 (24.0) <0.0001
HTN 334,549 (11.5) 618,878 (49.9) <0.0001
Dyslipidemia 338,285 (11.6) 425,781 (34.4) <0.0001
CKDe 67,008 (2.3) 127,682 (10.3) <0.0001
Abdominal obesityf 459,249 (15.8) 355,044 (28.6) <0.0001
General obesityg 879,501 (30.3) 456,224 (36.8) <0.0001

Values are presented as number (%), mean±standard deviation, or geometric mean (95% confidence interval).

BMI, body mass index; WC, waist circumfer ence; HDL-C, high-density lipoprotein cholesterol; LDL-C, low-density lipoprotein cholesterol; TG, triglyceride; HTN, hypertension; CKD, chronic kidney disease.

a Current smoking: those who were smoking at the time of interview and who had smoked >100 cigarettes in their lifetime,

b Alcohol drinking: drinking ≥30 g/day,

c Physically active ≥25 minutes of high-intensity physical activity for ≥3 days per week or >30 minutes of moderate-intensity physical activity for ≥5 days per week,

d Low income: participant’s income belonged to the lowest 25 percentile of the population,

e CKD: defined by eGFR of <60 mL/min/1.73 m2,

f Abdominal obesity: waist circumference of ≥85 cm for men and 75 cm for women,

g General obesity: BMI of ≥25 kg/m2.

Table 2.
Hazard ratios for diabetes development in different age groups according to BMI and WC
Variable Number DM Incidence rate, 1,000 person-years Model 1 Model 2 Model 3
40-year-old group
BMI (per 1) 1.251 (1.249–1.252) 1.249 (1.247–1.251) 1.214 (1.212–1.216)
General obesitya (BMI ≥25 kg/m2)
No 2,026,251 26,827 2.2984 1 (ref) 1 (ref) 1 (ref)
Yes 879,501 56,766 11.6298 4.412 (4.347–4.479) 4.402 (4.336–4.468) 3.566 (3.512–3.622)
BMI, kg/m2
<18.5 116,685 580 0.8815 0.617 (0.568–0.671) 0.605 (0.556–0.657) 0.622 (0.572–0.676)
18.5–22.9 1,266,476 11,245 1.5377 1 (ref) 1 (ref) 1(ref)
23–24.9 643,090 15,002 4.0534 2.333 (2.276–2.391) 2.355 (2.298–2.414) 2.203 (2.149–2.258)
25–29.9 759,698 40,725 9.5598 5.256 (5.145–5.370) 5.269 (5.157–5.383) 4.419 (4.324–4.516)
≥30 119,803 16,041 25.8282 14.947 (14.587–15.317) 14.761 (14.404–15.126) 10.351 (10.091–10.617)
P for trend <0.001 <0.001 <0.001
WC (per 5) 1.591 (1.585–1.596) 1.584 (1.578–1.589) 1.490 (1.484–1.495)
Abdominal obesityb (WC ≥90/85 cm)
No 2,446,503 45,278 3.2215 1 (ref) 1 (ref) 1 (ref)
Yes 459,249 38,315 15.3379 4.164 (4.107–4.222) 4.104 (4.047–4.162) 3.231 (3.184–3.278)
WC (men/women), cm
<80/75 1,292,629 10,527 1.4104 0.236 (0.230–0.242) 0.236 (0.230–0.242) 0.269 (0.262–0.275)
80–84.9/75–79.9 665,176 15,252 3.9902 0.586 (0.574–0.598) 0.588 (0.576–0.601) 0.629 (0.615–0.642)
85–89.9/80–84.9 488,698 19,499 7.0419
90–94.9/85–89.9 268,210 16,912 11.3561 1.588 (1.555–1.621) 1.576 (1.544–1.609) 1.465 (1.436–1.496)
95–99.9/90–94.9 118,578 10,817 16.9227 2.401 (2.346–2.458) 2.367 (2.312–2.423) 2.043 (1.995–2.092)
≥100/95 72,461 10,586 28.6412 4.203 (4.105–4.304) 4.110 (4.014–4.209) 3.225 (3.148–3.304)
P for trend <0.0001 <0.0001 <0.0001
66-year-old group
BMI (per 1) 1.134 (1.132–1.136) 1.137 (1.135–1.139) 1.117 (1.115–1.119)
General obesitya (BMI ≥25 kg/m2)
No 783,345 59,369 13.7884 1 (ref) 1 (ref) 1 (ref)
Yes 456,224 63,135 25.968 1.902 (1.880–1.923) 1.933 (1.911–1.955) 1.739 (1.719–1.759)
BMI, kg/m2
<18.5 28,362 1,480 9.3677 0.801 (0.760–0.844) 0.770 (0.731–0.811) 0.841 (0.798–0.886)
18.5–22.9 407,126 26,089 11.5967 1 (ref) 1 (ref) 1 (ref)
23–24.9 347,857 31,800 16.7541 1.449 (1.426–1.473) 1.481 (1.456–1.505) 1.383 (1.360–1.406)
25–29.9 415,689 54,590 24.5226 2.136 (2.104–2.167) 2.194 (2.162–2.227) 1.945 (1.916–1.974)
≥30 40,535 8,545 41.6512 3.738 (3.648–3.831) 3.817 (3.724–3.912) 3.155 (3.078–3.235)
P for trend <0.001 <0.001 <0.001
WC (per 5) 1.294 (1.289–1.298) 1.296 (1.292–1.301) 1.254 (1.250–1.259)
Abdominal obesityb (WC ≥90/85 cm)
No 884,525 69,546 14.3296 1 (ref) 1 (ref) 1 (ref)
Yes 355,044 52,958 28.1141 1.980 (1.957–2.002) 1.991 (1.968–2.014) 1.799 (1.778–1.820)
WC (men/women), cm
<80/75 279,645 14,852 9.6115 0.509 (0.499–0.519) 0.500 (0.490–0.510) 0.554 (0.543–0.565)
80–84.9/79.9 293,367 22,826 14.1726 0.750 (0.738–0.763) 0.747 (0.734–0.759) 0.775 (0.762–0.788)
85–89.9/80–84.9 311,513 31,868 18.7736
90–94.9/85–89.9 206,276 26,829 24.211 1.291 (1.270–1.312) 1.292 (1.271–1.313) 1.252 (1.232–1.273)
95–99.9/90–94.9 98,510 15,901 30.6169 1.649 (1.618–1.680) 1.648 (1.616–1.679) 1.550 (1.521–1.580)
≥100/95 50,258 10,228 39.9227 2.173 (2.125–2.222) 2.164 (2.116–2.213) 1.975 (1.931–2.020)
P for trend <0.0001 <0.0001 <0.0001

Risk of DM development was expressed as hazard ratio with (95% confidence interval). Model 1 was adjusted for age and sex; Model 2 was adjusted for age, sex, smoking status, alcohol consumption, physical activity, and income level; Model 3 was adjusted for age, sex, smoking status, alcohol consumption, physical activity, income, hypertension, dyslipidemia, and chronic kidney disease.

BMI, body mass index; WC, waist circumference; DM, diabetes mellitus.

a General obesity: BMI ≥25 kg/m2,

b Abdominal obesity: WC ≥90 cm for men and ≥85 cm for women.

Table 3.
Hazard ratios for diabetes development in different age groups according to BMI, WC, and sex
Variable Number DM Incidence rate, 1,000 person-year Model 1 Model 2 Model 3
40-year-old group
BMI (per 1)
Men 1.243 (1.241–1.246) 1.242 (1.239–1.244) 1.205 (1.202–1.208)
Women 1.259 (1.257–1.262) 1.257 (1.254–1.260) 1.219 (1.216–1.222)
General obesitya (BMI ≥25 kg/m2)
Men
No 840,370 17,418 3.6125 1 (ref) 1 (ref) 1 (ref)
Yes 599,217 42,040 12.7192 3.540 (3.478–3.603) 3.538 (3.476–3.601) 2.881 (2.829–2.934)
Women
No 1,185,881 9,409 1.3735 1 (ref) 1 (ref) 1 (ref)
Yes 280,284 14,726 9.3448 6.819 (6.645–6.998) 6.777 (6.604–6.955) 5.256 (5.117–5.400)
BMI, kg/m2
Men
<18.5 25,549 282 1.9191 0.750 (0.666–0.845) 0.718 (0.637–0.809) 0.766 (0.680–0.863)
18.5–22.9 436,903 6,453 2.5621 1 (ref) 1 (ref) 1 (ref)
23–24.9 377,918 10,683 4.9551 1.937 (1.878–1.998) 1.969 (1.909–2.031) 1.807 (1.752–1.864)
25–29.9 525,991 31,133 10.6246 4.168 (4.058–4.282) 4.201 (4.090–4.316) 3.463 (3.370–3.558)
≥30 73,226 10,907 29.0887 11.555 (11.205–11.917) 11.459 (11.111–11.818) 7.944 (7.694–8.202)
P for trend <0.0001 <0.0001 <0.0001
Women
<18.5 91,136 298 0.5831 0.589 (0.524–0.662) 0.581 (0.517–0.653) 0.598 (0.532–0.672)
18.5–22.9 829,573 4,792 0.9995 1 (ref) 1 (ref) 1 (ref)
23–24.9 265,172 4,319 2.7953 2.788 (2.675–2.905) 2.791 (2.679–2.908) 2.588 (2.483–2.697)
25–29.9 233,707 9,592 7.2135 7.221 (6.975–7.476) 7.193 (6.948–7.447) 5.939 (5.733–6.152)
≥30 46,577 5,134 20.8608 21.110 (20.295–21.959) 20.787 (19.983–21.623) 13.851 (13.287–14.440)
P for trend <0.001 <0.001 <0.001
WC (per 5)
Men 1.549 (1.542–1.556) 1.541 (1.534–1.548) 1.446 (1.439–1.453)
Women 1.653 (1.644–1.662) 1.647 (1.639–1.656) 1.539 (1.530–1.548)
Abdominal obesityb (WC ≥90/85 cm)
Men
No 1,126,905 31,287 4.8632 1 (ref) 1 (ref) 1 (ref)
Yes 312,682 28,171 16.6361 3.446 (3.391–3.501) 3.392 (3.338–3.447) 2.722 (2.676–2.768)
Women
No 1,319,598 13,991 1.8357 1 (ref) 1 (ref) 1 (ref)
Yes 146,567 10,144 12.6061 6.912 (6.737–7.091) 6.817 (6.645–6.994) 4.991 (4.858–5.128)
WC, cm
Men
<80 419,056 5,657 2.3466 0.290 (0.281–0.299) 0.289 (0.280–0.298) 0.337 (0.326–0.347)
80–84.9 386,738 11,009 4.977 0.615 (0.600–0.631) 0.618 (0.603–0.634) 0.661 (0.645–0.677)
85–89.9 321,111 14,621 8.0745 1 (ref) 1 (ref) 1 (ref)
90–94.9 187,252 12,954 12.5149 1.555 (1.518–1.592) 1.542 (1.506–1.578) 1.439 (1.405–1.473)
95–99.9 80,393 8,076 18.7646 2.343 (2.280–2.408) 2.305 (2.244–2.369) 2.007 (1.953–2.063)
≥100 45,037 7,141 31.334 3.944 (3.834–4.057) 3.849 (3.741–3.959) 3.064 (2.977–3.154)
P for trend <0.0001 <0.0001 <0.0001
Women
<75 873,573 4,870 0.9638 0.189 (0.182–0.197) 0.190 (0.183–0.198) 0.218 (0.210–0.227)
75–79.9 278,438 4,243 2.6347 0.517 (0.496–0.538) 0.518 (0.497–0.540) 0.555 (0.532–0.578)
80–84.9 167,587 4,878 5.0906 1 (ref) 1 (ref) 1 (ref)
85–89.9 80,958 3,958 8.7149 1.717 (1.647–1.791) 1.709 (1.639–1.782) 1.574 (1.510–1.642)
90–94.9 38,185 2,741 13.1263 2.598 (2.479–2.722) 2.573 (2.456–2.697) 2.154 (2.055–2.258)
≥95 27,424 3,445 24.3105 4.846 (4.640–5.063) 4.762 (4.559–4.975) 3.508 (3.355–3.669)
P for trend <0.001 <0.001 <0.001
66-year-old group
BMI (per 1)
Men 1.127 (1.124–1.130) 1.135 (1.131–1.138) 1.114 (1.111–1.117)
Women 1.139 (1.136–1.142) 1.139 (1.136–1.141) 1.118 (1.116–1.121)
General obesitya (BMI ≥25 kg/m2)
Men
No 372,352 31,461 15.4186 1 (ref) 1 (ref) 1 (ref)
Yes 188,530 27,002 27.2769 1.768 (1.739–1.797) 1.823 (1.793–1.853) 1.653 (1.626–1.681)
Women
No 410,993 27,908 12.32 1 (ref) 1 (ref) 1 (ref)
Yes 267,694 36,133 25.069 2.033 (2.002–2.065) 2.036 (2.004–2.068) 1.819 (1.790–1.848)
BMI, kg/m2
Men
<18.5 14,978 980 11.7237 0.884 (0.829–0.943) 0.841 (0.789–0.898) 0.907 (0.850–0.968)
18.5–22.9 195,316 14,323 13.2616 1 (ref) 1 (ref) 1 (ref)
23–24.9 162,058 16,158 18.4277 1.389 (1.358–1.421) 1.438 (1.406–1.471) 1.347 (1.317–1.378)
25–29.9 178,104 24,681 26.3015 1.981 (1.941–2.023) 2.077 (2.034–2.120) 1.854 (1.816–1.894)
≥30 10,426 2,321 45.0361 3.388 (3.242–3.540) 3.558 (3.405–3.718) 2.974 (2.844–3.109)
P for trend <0.0001 <0.0001 <0.0001
Women
<18.5 13,384 500 6.7206 0.668 (0.611–0.731) 0.655 (0.599–0.716) 0.724 (0.662–0.792)
18.5–22.9 211,810 11,766 10.0595 1 (ref) 1 (ref) 1 (ref)
23–24.9 185,799 15,642 15.317 1.522 (1.486–1.559) 1.529 (1.493–1.566) 1.428 (1.394–1.462)
25–29.9 237,585 29,909 23.2263 2.307 (2.258–2.356) 2.315 (2.266–2.365) 2.042 (1.998–2.087)
≥30 30,109 6,224 40.5156 4.023 (3.901–4.148) 4.013 (3.891–4.138) 3.279 (3.179–3.383)
P for trend <0.001 <0.001 <0.001
WC (per 5)
Men 1.277 (1.270–1.283) 1.284 (1.277–1.291) 1.244 (1.237–1.250)
Women 1.307 (1.301–1.313) 1.306 (1.300–1.312) 1.262 (1.256–1.268)
Abdominal obesityb (WC ≥90/85 cm)
Men
No 415,340 35,776 15.7715 1 (ref) 1 (ref) 1 (ref)
Yes 145,542 22,687 29.7736 1.886 (1.854–1.917) 1.910 (1.879–1.943) 1.736 (1.707–1.766)
Women
No 469,185 33,770 13.0643 1 (ref) 1 (ref) 1 (ref)
Yes 209,502 30,271 26.9868 2.064 (2.032–2.096) 2.059 (2.027–2.091) 1.852 (1.823–1.881)
WC, cm
Men
<80 133,927 8,219 11.053 0.544 (0.529–0.558) 0.528 (0.514–0.542) 0.581 (0.566–0.597)
80–84.9 141,580 12,255 15.861 0.780 (0.762–0.799) 0.773 (0.755–0.792) 0.801 (0.782–0.820)
85–89.9 139,833 15,302 20.3443 1 (ref) 1 (ref) 1 (ref)
90–94.9 91,309 12,585 26.0027 1.278 (1.248–1.308) 1.282 (1.252–1.312) 1.245 (1.216–1.275)
95–99.9 37,933 6,599 33.6331 1.651 (1.604–1.700) 1.656 (1.609–1.705) 1.565 (1.520–1.611)
≥100 16,300 3,503 42.8295 2.104 (2.028–2.182) 2.104 (2.028–2.182) 1.935 (1.865–2.008)
P for trend <0.0001 <0.0001 <.0001
Women
<75 145,718 6,633 8.2743 0.473 (0.460–0.486) 0.471 (0.458–0.485) 0.523 (0.508–0.538)
75–79.9 151,787 10,571 12.6156 0.720 (0.703–0.738) 0.720 (0.703–0.738) 0.748 (0.730–0.767)
80–84.9 171,680 16,566 17.5238 1 (ref) 1 (ref) 1 (ref)
85–89.9 114,967 14,244 22.8216 1.302 (1.273–1.332) 1.300 (1.271–1.330) 1.257 (1.229–1.286)
90–94.9 60,577 9,302 28.7856 1.642 (1.601–1.684) 1.636 (1.595–1.678) 1.532 (1.493–1.572)
≥95 33,958 6,725 38.5595 2.200 (2.139–2.264) 2.186 (2.124–2.248) 1.977 (1.922–2.034)
P for trend <0.001 <0.001 <0.001

Risk of DM development was expressed as hazard ratio with (95% confidence interval). Model 1 was adjusted for age, sex; Model 2 was adjusted for age, sex, smoking status, alcohol consumption, physical activity, and income level; Model 3 was adjusted for age, sex, smoking status, alcohol consumption, physical activity, income, hypertension, and dyslipidemia.

BMI, body mass index; WC, waist circumference; DM, diabetes mellitus.

a General obesity: BMI ≥25 kg/m2,

b Abdominal obesity: WC ≥90 cm for men and ≥85 cm for women.

TOOLS
Similar articles