Journal List > Cancer Res Treat > v.55(4) > 1516084301

Lee, Zang, Ryu, Han, Kim, Kim, Koh, Lee, Koo, Ko, Sohn, Kim, Park, Nam, and Choi: A Phase 3 Randomized Clinical Trial to Compare Efficacy and Safety between Combination Therapy and Monotherapy in Elderly Patients with Advanced Gastric Cancer (KCSG ST13-10)

Abstract

Purpose

This study evaluated whether combination therapy is more effective than monotherapy in elderly patients with metastatic or recurrent gastric cancer (MRGC) as first-line chemotherapy.

Materials and Methods

Elderly (≥ 70 years) chemo-naïve patients with MRGC were allocated to receive either combination therapy (group A: 5-fluorouracil [5-FU]/oxaliplatin, capecitabine/oxaliplatin, capecitabine/cisplatin, or S-1/cisplatin) or monotherapy (group B: 5-FU, capecitabine, or S-1). In group A, starting doses were 80% of standard doses, and they could be escalated to 100% at the discretion of the investigator. Primary endpoint was to confirm superior overall survival (OS) of combination therapy vs. monotherapy.

Results

After 111 of the planned 238 patients were randomized, enrollment was terminated due to poor accrual. In the full-analysis population (group A [n=53] and group B [n=51]), median OS of combination therapy vs. monotherapy was 11.5 vs. 7.5 months (hazard ratio [HR], 0.86; 95% confidence interval [CI], 0.56 to 1.30; p=0.231). Median progression-free survival (PFS) was 5.6 vs. 3.7 months (HR, 0.53; 95% CI, 0.34 to 0.83; p=0.005). In subgroup analyses, patients aged 70–74 years tended to have superior OS with combination therapy (15.9 vs. 7.2 months, p=0.056). Treatment-related adverse events (TRAEs) occurred more frequently in group A vs. group B. However, among severe TRAEs (≥ grade 3), there were no TRAEs with a frequency difference of > 5%.

Conclusion

Combination therapy was associated with numerically improved OS, although statistically insignificant, and a significant PFS benefit compared with monotherapy. Although combination therapy showed more frequent TRAEs, there was no difference in the frequency of severe TRAEs.

Introduction

Gastric cancer (GC) is the third most common cause of cancer-related deaths worldwide [1]. The incidence rate of GC increases with age, and more than half of the new cases occur in the elderly aged ≥ 65 years [2,3]. For patients with metastatic or recurrent GC (MRGC), fluoropyrimidine plus platinum combination is the most widely accepted first-line chemotherapy regimen based on phase 3 clinical trials [411]. However, most patients enrolled in those trials were younger patients with a median age of 54–64 years.
Elderly patients often present with multiple comorbidities and age-related impaired organ function, which can lead to increased toxicity. In real-world clinical practice, elderly patients are less likely to be offered chemotherapy and tend to receive less intensive treatment [12]. Clinical trials specific to elderly patients are required to guide optimal treatment in this age group. However, only few trials have been designed and conducted specifically for elderly patients with MRGC. In a randomized phase 2 trial of capecitabine vs. S-1 in chemo-naïve patients aged ≥ 65 years with MRGC, both capecitabine and S-1 were found to be active and tolerable [13]. In a small phase 3 trial of 50 patients aged ≥ 70 years with MRGC, capecitabine plus oxaliplatin combination chemotherapy showed a trend of increased survival benefit compared with capecitabine monotherapy as first-line chemotherapy [14]. Currently, there remains uncertainty regarding the optimal chemotherapeutic regimens for these patients. We conducted this randomized phase 3 trial on elderly patients with MRGC to compare efficacy and safety between combination therapy and monotherapy.

Materials and Methods

1. Study design

This open-label, phase 3 trial was conducted at 14 Korean institutions. After obtaining written informed consent, patients were randomly allocated (1:1) to receive either combination therapy (group A) or monotherapy (group B) using computer-generated permutated-block randomization. Three stratification factors were used: age (< 75 vs. ≥ 75 years), Eastern Cooperative Oncology Group (ECOG) performance status (PS) (0–1 vs. 2), and fluoropyrimidine backbones (5-fluorouracil [5-FU] vs. capecitabine vs. S-1).
This study was conducted in compliance with Good Clinical Practice guidelines and the Declaration of Helsinki. The study was approved by the institutional review board at each institution and registered with ClinicalTrials.gov (NCT02114359).

2. Patient eligibility criteria

Patients (≥ 70 years) with histologically confirmed metastatic or recurrent adenocarcinoma of the stomach or gastroesophageal junction were eligible if they met the following inclusion criteria: no previous chemotherapy except adjuvant chemotherapy completed at least 6 months before enrollment; ECOG PS 0–2; the existence of at least one lesion that is measurable, or is non-measurable but evaluable, according to the Response Evaluation Criteria in Solid Tumors (RECIST ver. 1.1); life expectancy ≥ 3 months; sufficient bone marrow, hepatic and renal function. The exclusion criteria were as follows: human epidermal growth factor receptor-2 (HER-2)–positive disease; recent radiotherapy within 2 weeks; recent major surgery within 4 weeks; uncontrolled central nervous system metastasis, or other serious comorbidities.

3. Study treatment

The group A consisted of four regimens: (1) 5-FU/leucovorin/oxaliplatin (FOLFOX); (2) capecitabine/oxaliplatin (CAPOX); (3) S-1/cisplatin; (4) capecitabine/cisplatin. The fluoropyrimidine backbone was selected by the attending investigator before randomization. In each regimen, starting dose of chemotherapeutic agents was about 80% of standard dose. After the first cycle of chemotherapy, it could be escalated to 100% (Table 1); this was at the discretion of the investigator if hematological or non-hematological toxicity of ≥ grade 2 did not occur based on the National Cancer Institute Common Terminology Criteria for Adverse Events (NCI CTCAE ver. 4.03).
The group B consisted of three regimens of fluoropyrimidine only: (1) 5-FU/leucovorin (FL); (2) oral capecitabine; (3) oral S-1. In this monotherapy group, treatment was started with the standard dose (100%).
The dosage and administration of each regimen is detailed in Table 1. Chemotherapy was continued until the occurrence of tumor progression, intolerable adverse events (AEs), or withdrawal of patient’s consent. Dose reductions and/or interruptions during chemotherapy were conducted in response to chemotherapy-related AEs.

4. Assessments

Pretreatment assessment included medical history, physical examination, blood tests, electrocardiogram, chest radiography, and computed tomography (CT) of the abdomen and pelvis (chest CT was also performed if indicated). Tumor response was assessed using CT according to the RECIST, with the first four evaluations performed every 6 weeks and subsequent evaluation every 8 weeks until progressive disease (PD). AEs were graded according to the NCI CTCAE. Quality of life (QOL) was assessed using questionnaires (European Organization for Research and Treatment of Cancer [EORTC] Quality of Life Questionnaires [QLQ]-C30 and QLQ-STO22) [15,16]. These QOL measurements were conducted before the initiation of chemotherapy and thereafter every 6 weeks for the first two measurements, followed by subsequent measurements every 12 weeks, and at the end of the study treatment.

5. Statistical considerations

The primary endpoint of this study was overall survival (OS), defined as the time from randomization to the date of death from any cause. The secondary endpoints included progression-free survival (PFS), overall response rate (ORR), safety, and changes in QOL. PFS was defined as the time from randomization to the date of PD or death from any cause. ORR was defined as the proportion of patients with complete response or partial response among patients with ≥ 1 measurable lesion. The OS and PFS were estimated using the Kaplan-Meier method and between-group difference was assessed using a log-rank test. Cox proportional hazards regression model was used to calculate hazard ratios (HRs).
Regarding sample size calculation, we assumed a median OS of 10 months with combination therapy vs. 7 months with monotherapy. With the following initial assumptions, 247 events were required to achieve at least 80% power, for which 298 patients were necessary: (1) two-sided type I error rate (α)=0.05; (2) follow-up period=12 months; and (3) enrollment period=24 months. Considering a dropout rate of 10%, total of 332 patients was initially set. However, patient enrollment was delayed more than expected, and as the expected enrollment period was extended to 60 months with one-sided α=0.05, the final sample size was changed to 238 patients (119 in each group considering a 10% dropout rate).
Efficacy analyses were primarily conducted on the subjects included in the full-analysis set (FAS) and also on the subjects in the per-protocol set (PPS). The safety set included all subjects who received at least one study treatment after randomization. Statistical analyses were done using SAS ver. 9.4 (SAS Institute Inc., Cary, NC).

Results

1. Patient characteristics

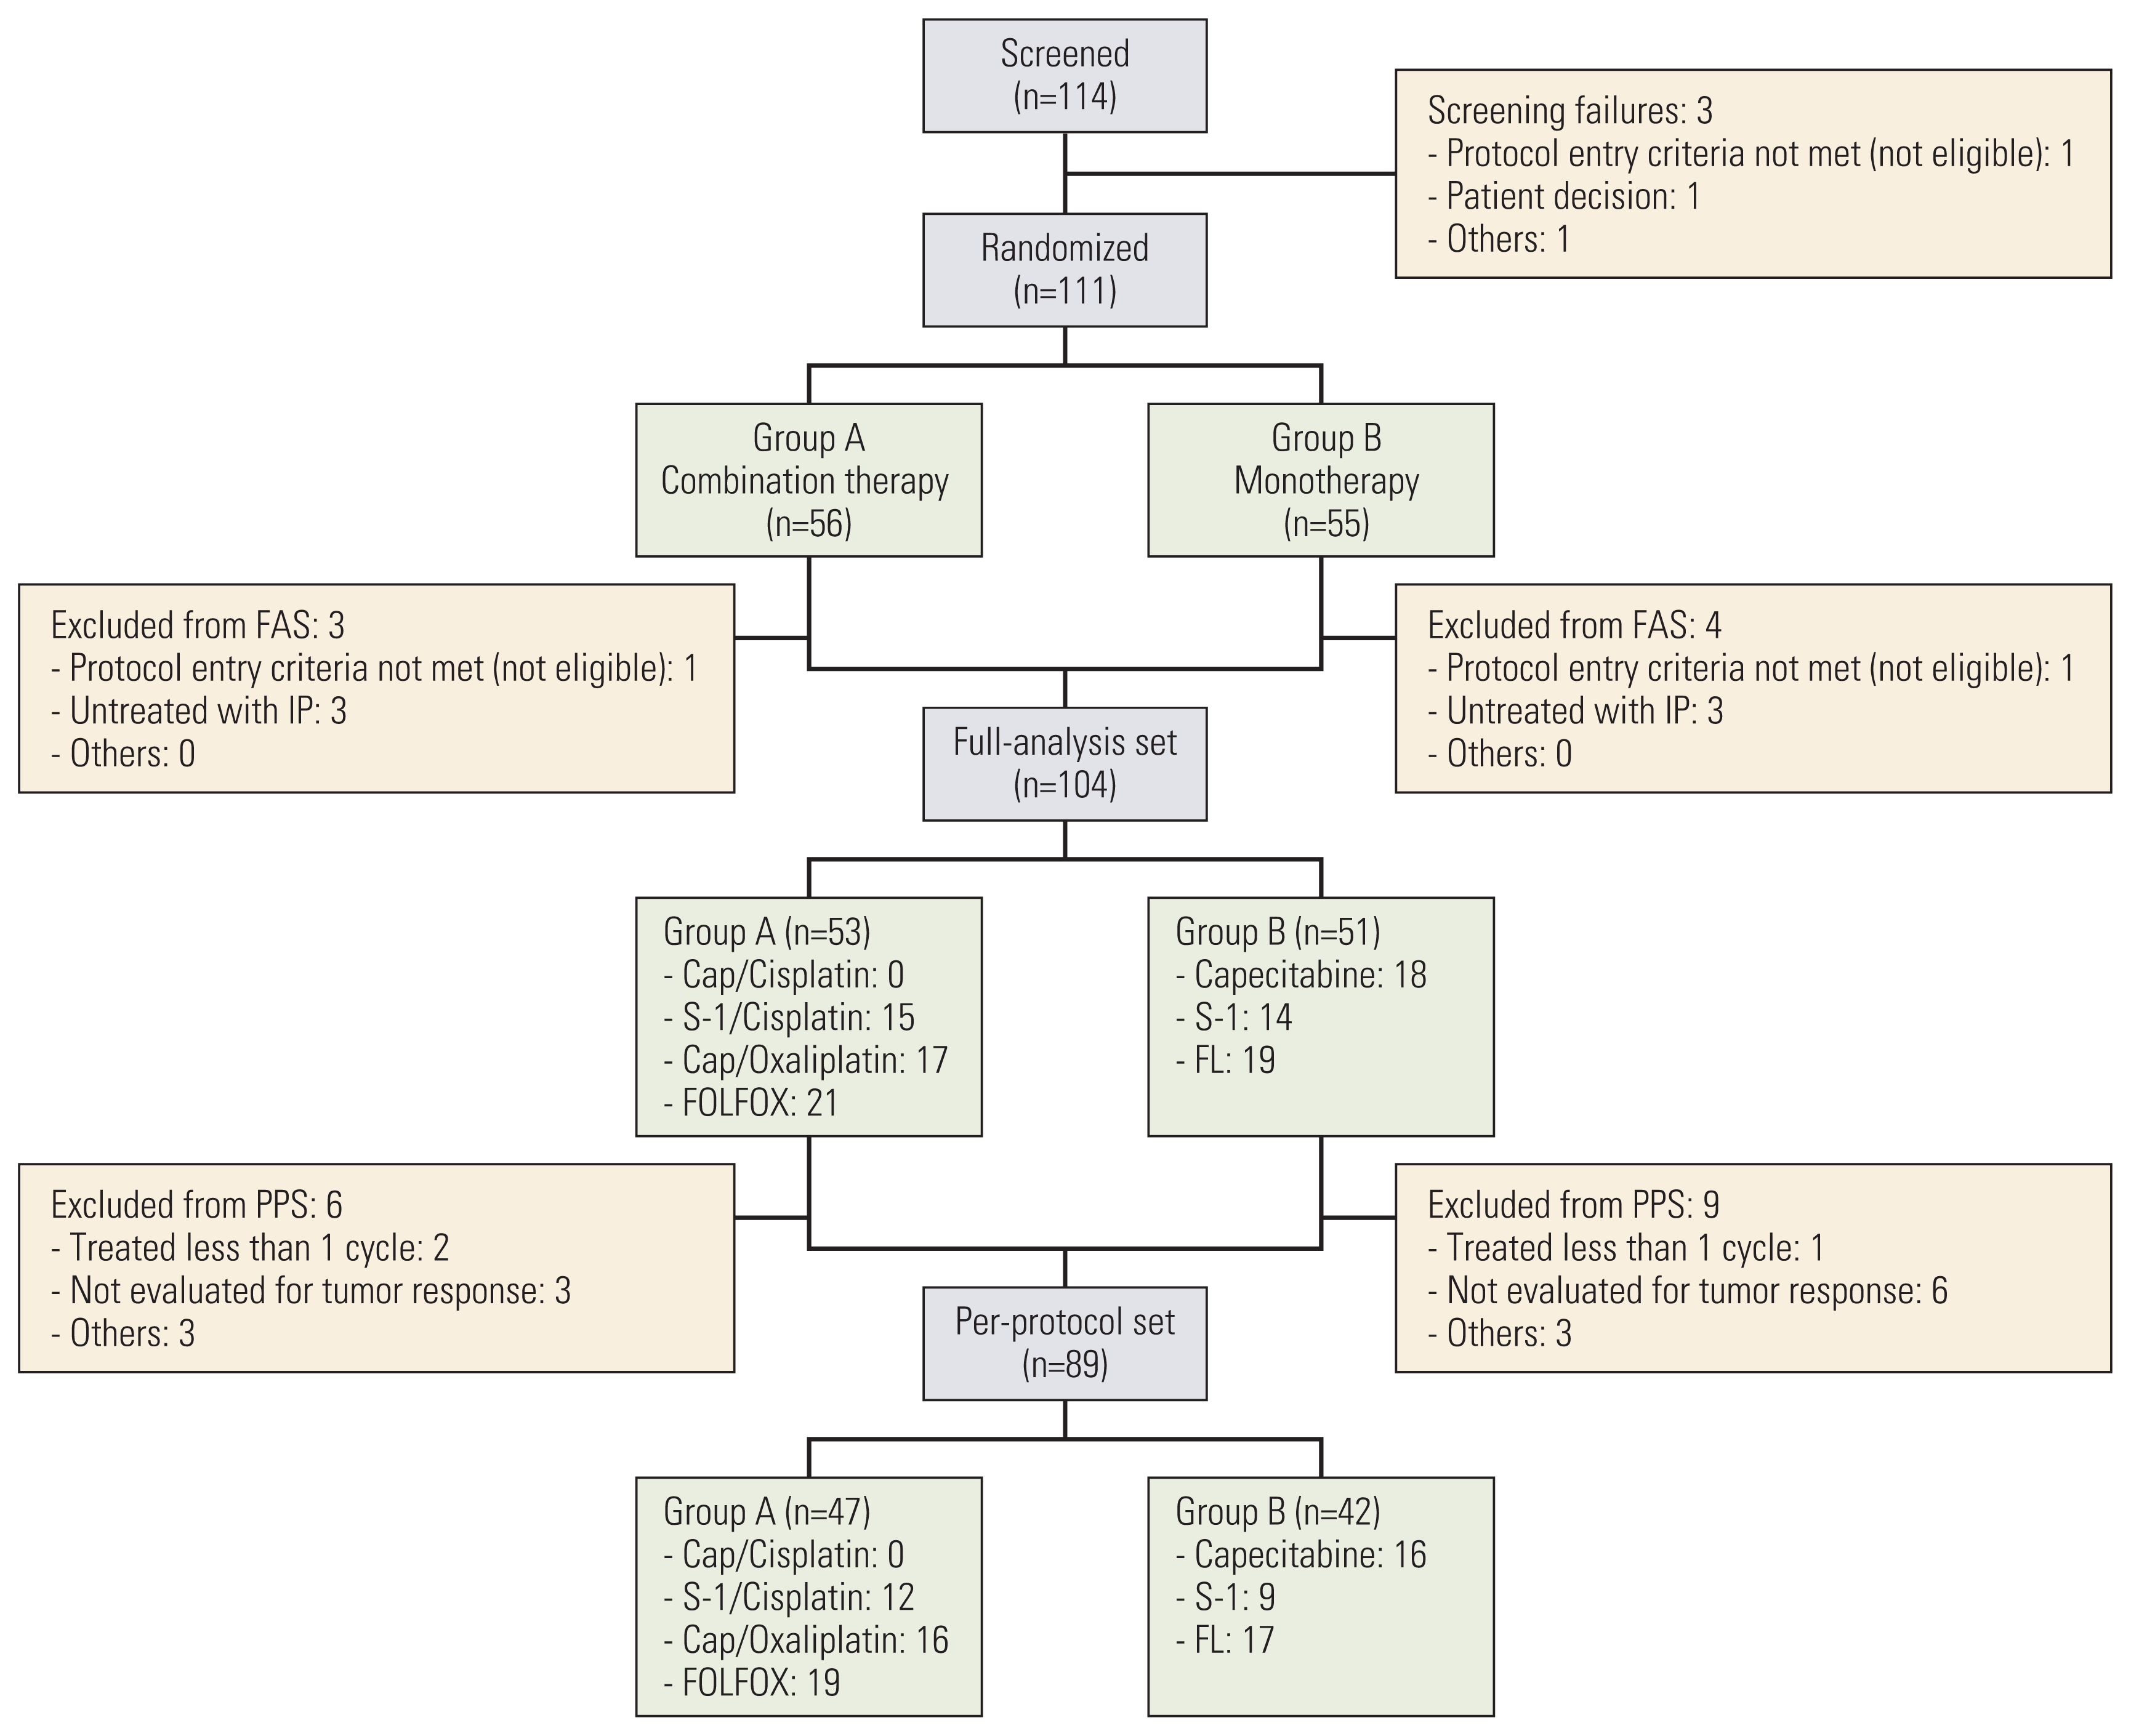
Between February 2014 and January 2019, after 111 of the planned 238 patients were randomized, further enrollment was terminated due to poor accrual. Among the 111 patients (S1 Table), seven did not meet the eligibility criteria or were not treated with the study treatment. Therefore, 104 patients were included in the FAS (Fig. 1).
The median age was 75 years (range, 70 to 88 years). Among the selected fluoropyrimidines, 5-FU accounted for 38%, capecitabine 34%, and S-1 28%. The baseline characteristics were well-balanced between the two groups (Table 2). In group A, FOLFOX was administered to 21 patients (40%), CAPOX 17 (32%), and S-1/cisplatin 15 (28%). In group B, FL was administered to 19 patients (37%), capecitabine 18 (35%), and S-1 14 (27%).

2. Delivery of study treatment

In the combination therapy group, among 48 patients who were alive and could receive further chemotherapy after the first cycle, only seven patients (15%) had dose escalation. The remaining patients sustained starting doses or required further dose reductions and/or interruptions related to AEs. The dose intensities (DIs) of platinum agents were in the range of 53%–65% in group A. The range of DIs of fluoropyrimidine agents was lower in group A than in group B (62%–71% vs. 83%–85%) (S2 and S3 Tables).

3. Efficacy

Efficacy analyses were primarily conducted in the FAS. During the follow-up period, death occurred in 90 patients. The median follow-up duration was 9.5 months (range, 0.3 to 71.2) for all patients as of the data cut-off date (February 28, 2020).
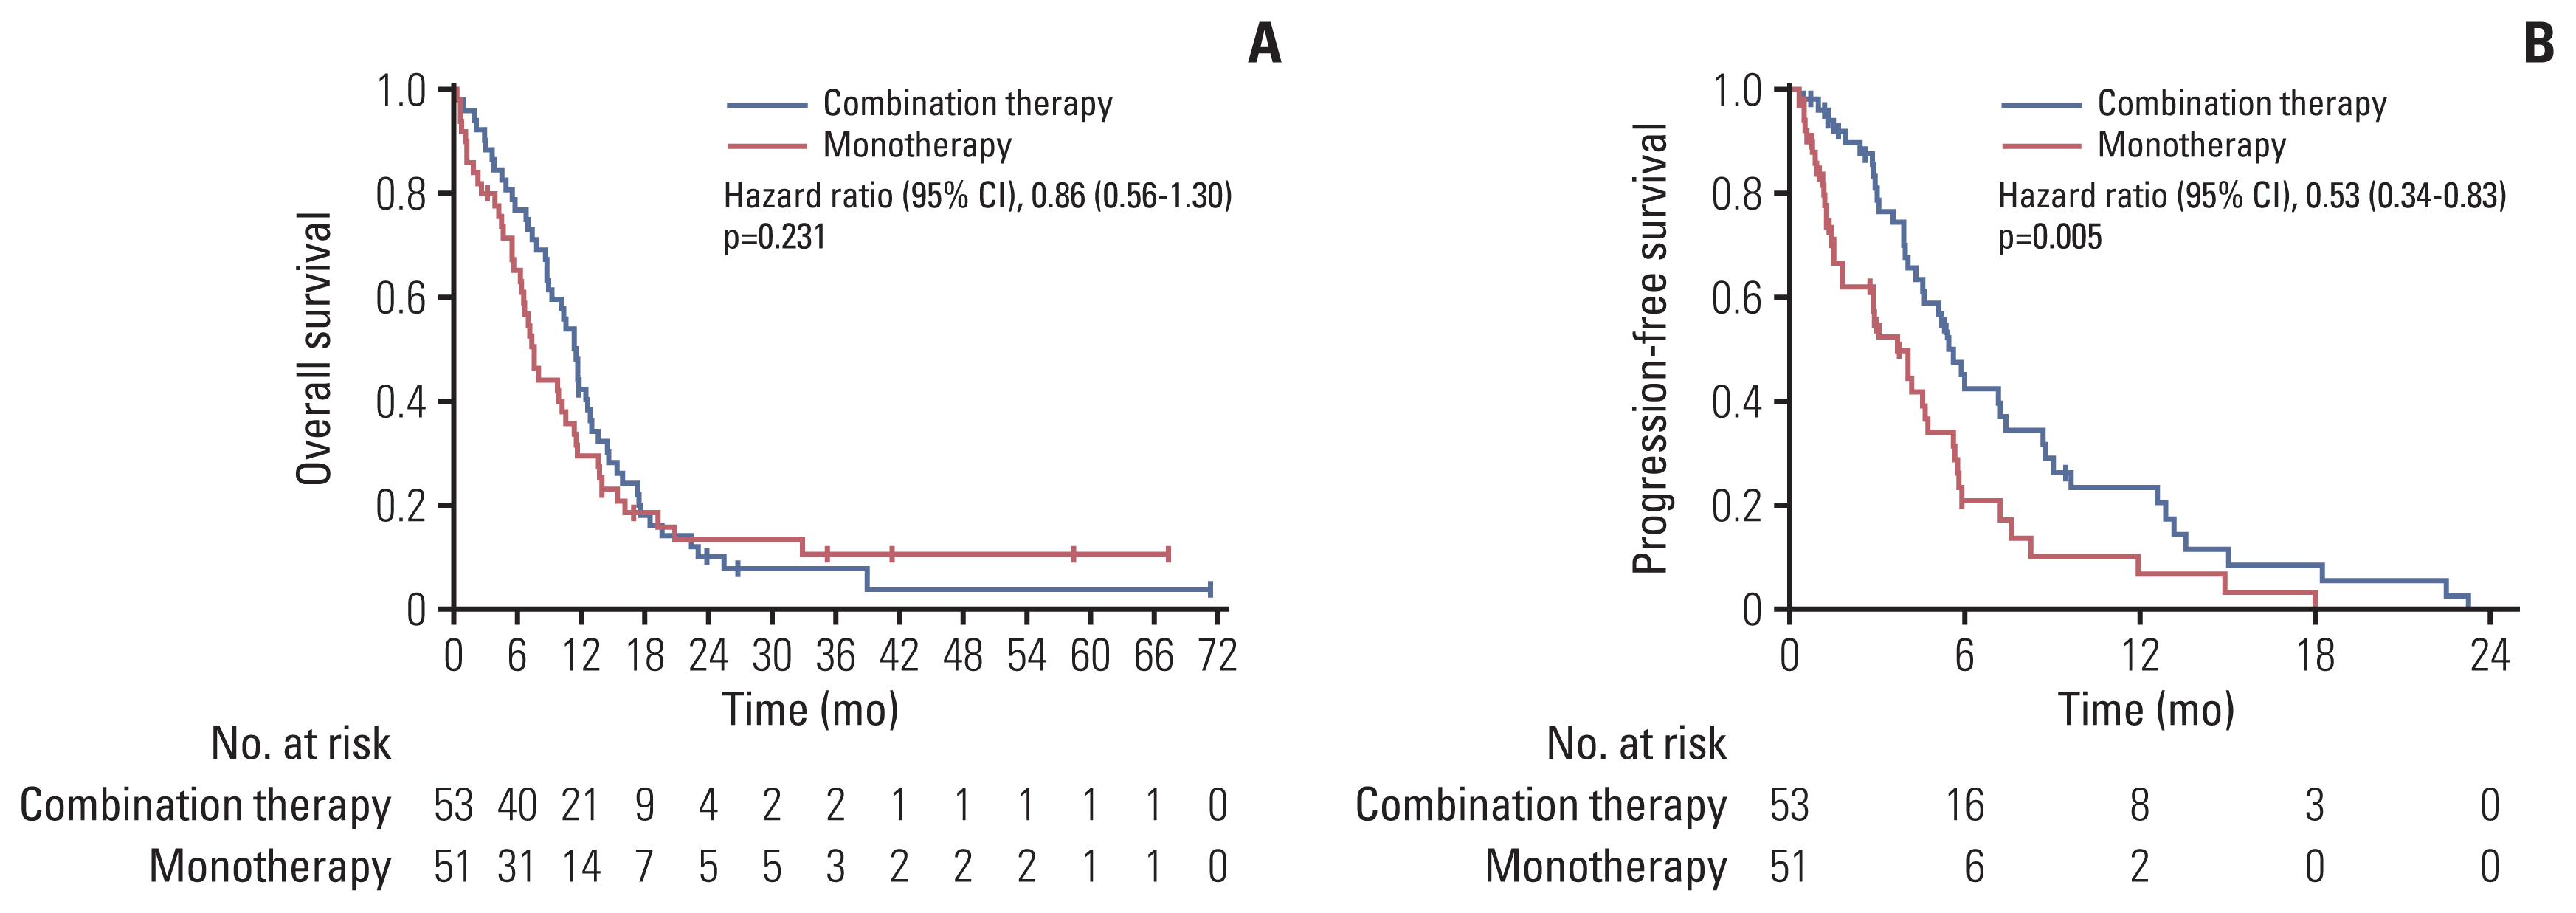
Prolongation of OS with combination therapy was not proven. Median OS of group A was numerically longer than that of group B (11.5 vs. 7.5 months); however, this was not statistically significant based on one-sided significance level of 0.05 (HR, 0.86; 95% confidence interval [CI], 0.56 to 1.30; p=0.231) (Fig. 2A). Second-line chemotherapy was administered to 21 patients (40%) in group A and 20 (39%) in group B.
In contrast, significant PFS prolongation was observed with combination therapy compared with monotherapy; median PFS 5.6 vs. 3.7 months (HR, 0.53; 95% CI, 0.34 to 0.83; p=0.005) (Fig. 2B). Tumor response was evaluated in 71 patients with measurable lesions. The ORR and disease control rate (DCR) were numerically higher in group A than in group B, but were not statistically significant (ORR, 34% vs. 25%; p=0.391; DCR, 77% vs. 58%, p=0.090) (Table 3).
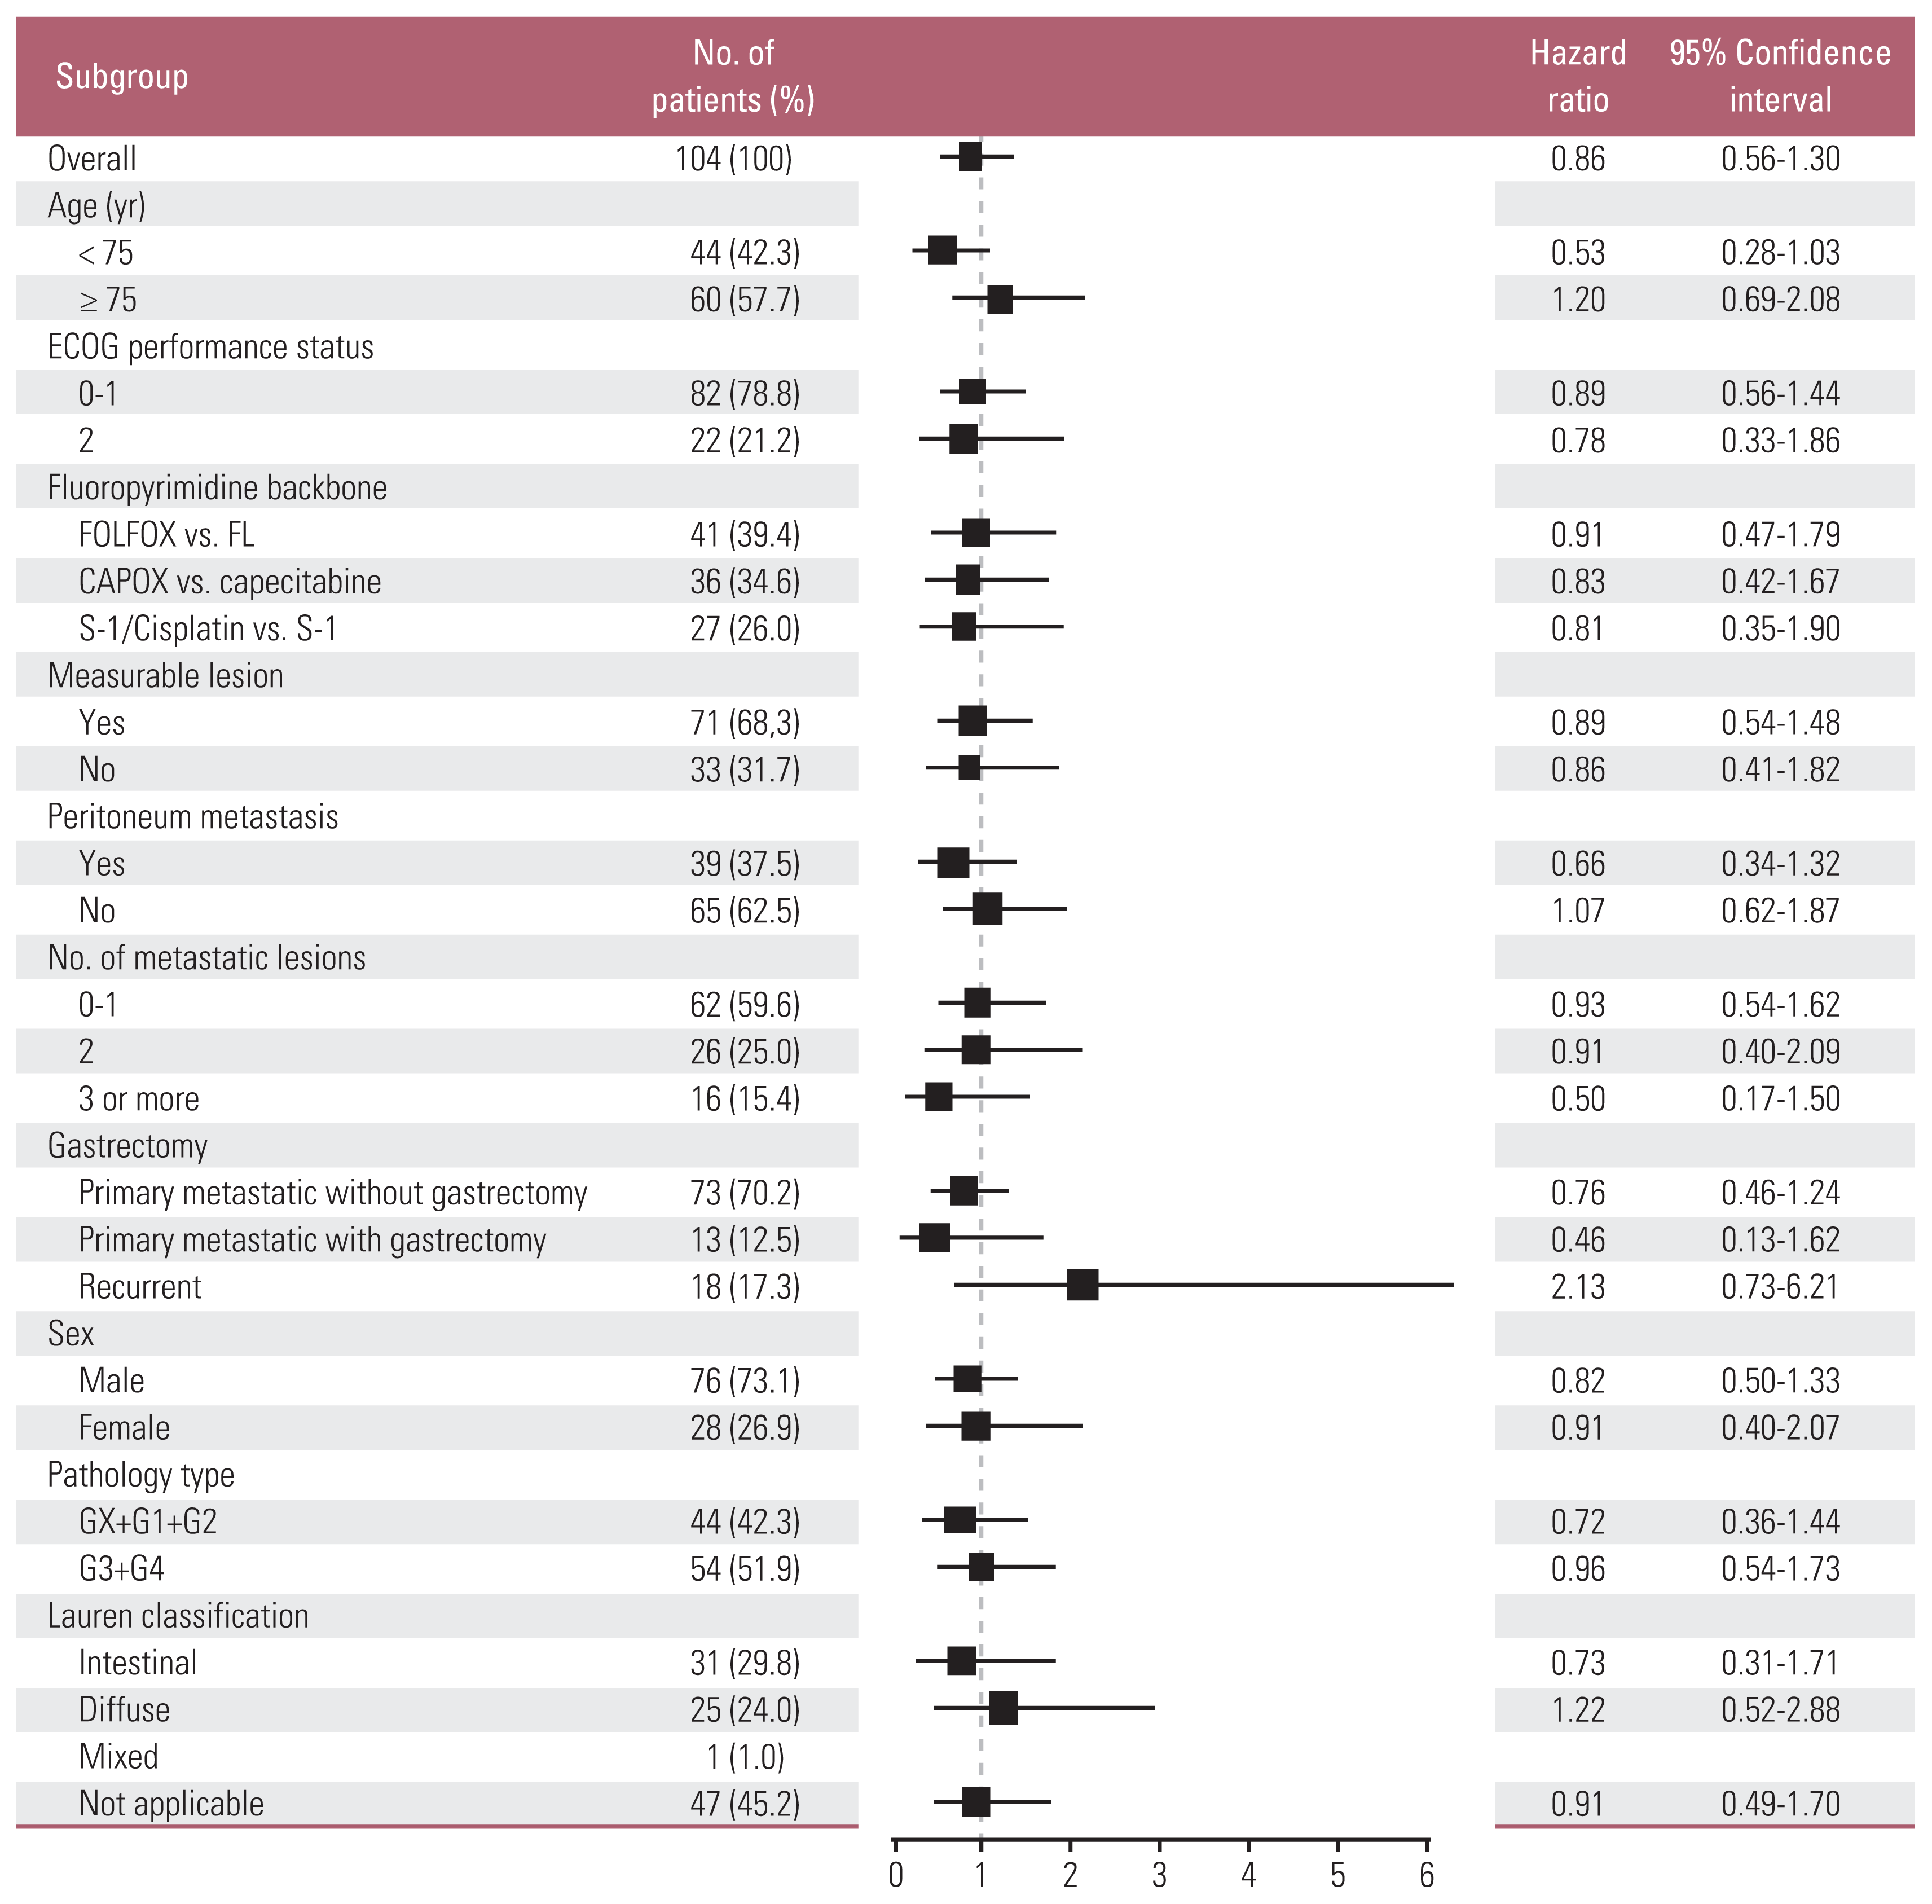
In preplanned subgroup analyses on OS, although we could not find any subgroups with significant OS differences, patients aged 70–74 years tended to have superior OS with combination therapy vs. monotherapy (15.9 vs. 7.2 months; HR, 0.53; 95% CI, 0.28 to 1.03; p=0.056) (Fig. 3). Planned survival analyses in the PPS (n=89) (Fig. 1) were also performed; the results were not different from those of FAS (S4 Table, S5 Fig.).

4. Adverse events

The treatment-related AEs (TRAEs) are shown in Table 4. Among TRAEs (all grades) with a frequency difference of > 10% between the two groups, neutropenia, thrombocytopenia, fatigue, anorexia, diarrhea, and peripheral neuropathy occurred more frequently in group A than in group B. Among TRAEs of ≥ grade 3, there were no AEs with a frequency difference of > 5%. The incidence of ≥ grade 3 peripheral neuropathy was 4% and 0% in groups A and B, respectively. There was one (1.9%) and two deaths (3.9%) in groups A and B, respectively, which could not deny a relationship with the study treatment.

5. Quality of life

At baseline, 102 of the 104 patients in the FAS completed the QOL questionnaires. Completion rates declined post-baseline mainly because of disease progression, with 17 patients (32%) in group A and five (10%) in group B completing the questionnaire at week 24. When we assessed the QOL changes during the study treatment using Osoba et al.’s method [17], most scales including EORTC QLQ-C30 global health status/QOL and functioning scales showed “no” or “a little” change (a change of 5–10 points from baseline). “Moderate” change (a change of 10–20 points from baseline) was observed in several symptom scales in group B; dyspnea, insomnia, appetite loss, and dry mouth were found to worsen from weeks 12 to 24, and body image showed aggravation from weeks 6 to 12. In group A, diarrhea showed “moderate” aggravation at the 6th week, but gradually improved thereafter. We did not observe “very much” change (a change of > 20 points from baseline) in either group (S6 Fig.).
When the treatment effect over time was tested using a mixed model for repeated measures analysis, there were no significant between-group differences for all the QOL scales except dyspnea (S7 and S8 Tables). A worsening in dyspnea was observed from weeks 12 to 24 in group B, in contrast to almost no change throughout the course in group A.

Discussion

In this phase 3 trial of first-line chemotherapy for elderly patients with MRGC, although combination therapy showed a significant PFS benefit compared with monotherapy, the prolongation of OS was not proven. Failure to demonstrate statistically significant OS prolongation with combination therapy may be attributable to the small sample size related to the premature termination of this study. However, the numerically improved median OS outcomes (Δ=4.0 months) provided by the combination therapy appear to be clinically meaningful. The OS curve for combination therapy was consistently higher than that for monotherapy until 18 months after chemotherapy initiation (Fig. 2A). At the time point of 18 months, only 16 patients remained in the OS analysis, and the two curves showed nearly parallel progression until the data cut-off date, suggesting that some patients with relatively indolent tumor biology were included. In addition, about 40% of patients in both groups received subsequent chemotherapy. Regarding second-line chemotherapy regimens, eight patients (40%, 8/20) received FOLFOX in monotherapy group (group B). Ramucirumab/paclitaxel, the current standard second-line treatment, was only administered to five patients (24%, 5/21) in group A and two (10%, 2/20) in group B, respectively, because the cost of ramucirumab has been covered by the National Health Insurance in Korea since May 2018 (S9 Table). Implementation of these subsequent treatments seems to have diluted the difference in OS between the two groups.
In preplanned subgroup analyses, patients aged 70–74 years had a stronger tendency toward a longer OS with combination therapy (Fig 3). In addition, combination therapy showed a clear PFS benefit (Fig. 2B). Overall, these efficacy outcomes suggest the benefit of combination therapy over monotherapy in elderly patients with MRGC, especially those aged 70–74 years. In the subgroup analysis of 18 recurrent cases, median OS of group A was numerically shorter than that of group B (9.3 vs 16.1 months; HR, 2.13; 95% CI, 0.73 to 6.21; p=0.154) (Fig. 3). Median disease-free interval from surgery was 29 months (range, 9 to 54 months) in group A (n=11) and 36 months (range, 4 to 280 months) in group B (n=7). A small number of patients and a wide range of disease-free interval in this subgroup make it difficult to reach a clear conclusion about the difference in OS benefit of combination therapy for the recurrent vs. primary metastatic cases.
The results of our study were consistent with those of a few trials conducted on elderly patients [13,14]. The median OS and PFS of 7.5 and 3.7 months with monotherapy, respectively, in our study were like those of a randomized phase 2 trial of fluoropyrimidine monotherapies in elderly patients with MRGC [13]. In a previous small phase 3 trial, only 50 chemo-naïve elderly patients (≥ 70 years) were randomized, and CAPOX showed a trend of increased OS compared with capecitabine monotherapy (11.1 vs. 6.3 months), although statistically insignificant. The trial was prematurely closed because of the unexpectedly low efficacy of capecitabine monotherapy seen in the interim analysis; thus, it was difficult to draw a definitive conclusion [14]. Our study enrolled a larger number of patients than those studies [13,14]; however, it still could not include a sufficient sample size, which reaffirmed the difficulty of conducting large-scale randomized trials in geriatric cancer patients.
Both combination therapy and monotherapy were well tolerated. The risk of TRAEs of ≥ grade 3 did not significantly increase with combination therapy. QOL was maintained and did not differ significantly between the two groups during the treatment. Regarding DIs of chemotherapeutic agents, in the combination therapy group, patients were initially treated with reduced doses (80% of standard doses), and most of them sustained starting doses or needed further dose reductions related to AEs. In our study, reduced doses of combination therapy resulted in improved outcomes without an increase in major toxic effects. Our results are supported by the results of a recent randomized phase 2 trial designed for frail and/or elderly patients with advanced gastroesophageal cancer considered unfit for conventional dose chemotherapy, in which reduced doses of CAPOX was found to be most likely to provide clinical benefit [18]. The following GO2 phase 3 trial compared three dose levels (level A [reference]; level B [doses 0.8 times A]; level C [doses 0.6 times A]) of CAPOX. Non-inferior PFS was confirmed for levels B and C compared with level A. In addition, level C showed fewer toxic effects and better overall treatment utility (OTU) than level A or B [19].
This study had some limitations. First, the study could not reach a sufficient sample size to identify statistical differences in OS. Elderly patients continue to be underrepresented in cancer clinical trials, and several factors related to lower accrual rates in elderly patients have been suggested [2023]. Second, geriatric assessment (GA) can help identify patients’ vulnerabilities other than chronological age and ECOG PS and has been reported to predict the toxicity of chemotherapy [2426] and survival [27,28]. However, we were not able to collect data on full GA in most of the patients because it was optional and not easy to implement in oncology clinics with high clinical burden and limited resources. Third, for elderly patients, patient-centered outcomes such as OTU could have provided more information about meaningful benefits than survival. Instead, we measured QOL in addition to disease-specific outcomes in this study.
In conclusion, combination therapy was well tolerated and associated with numerically improved OS compared with monotherapy in elderly patients with MRGC, especially in those aged 70–74 years, although statistically insignificant. Our findings add to increasing evidence that fluoropyrimidine plus platinum combination therapy with appropriately adjusted doses can be considered a standard first-line treatment in elderly patients with MRGC.

Notes

Ethical Statement

The study protocol was reviewed and approved by the institutional review board at each institution. All patients enrolled in this study provided informed consent to participate in this trial. This study was performed in accordance with the Declaration of Helsinki.

Author Contributions

Conceived and designed the analysis: Choi IS.

Collected the data: Lee KW, Zang DY, Ryu MH, Han HS, Kim KH, Kim MJ, Koh SA, Lee SS, Koo DH, Ko YH, Sohn BS, Kim JW, Park JH, Choi IS.

Contributed data or analysis tools: Nam BH.

Performed the analysis: Lee KW, Nam BH, Choi IS.

Wrote the paper: Lee KW, Choi IS.

Writing-review and editing: Lee KW, Zang DY, Ryu MH, Han HS, Kim KH, Kim MJ, Koh SA, Lee SS, Koo DH, Ko YH, Sohn BS, Kim JW, Park JH, Nam BH, Choi IS.

Conflicts of Interest

Conflict of interest relevant to this article was not reported.

Acknowledgments

This study was supported (in part) by the Korean Cancer Study Group (KCSG) and KCSG Data Center. This study was supported by a grant from the National R & D Program for Cancer Control, Ministry of Health and Welfare, Republic of Korea (132054). This funding source had no role in the design of this study and nor will have any role in the conduct of the research, analysis, and interpretation.

References

1. Bray F, Ferlay J, Soerjomataram I, Siegel RL, Torre LA, Jemal A. Global cancer statistics 2018: GLOBOCAN estimates of incidence and mortality worldwide for 36 cancers in 185 countries. CA Cancer J Clin. 2018; 68:394–424.
crossref
2. Hong S, Won YJ, Lee JJ, Jung KW, Kong HJ, Im JS, et al. Cancer statistics in Korea: incidence, mortality, survival, and prevalence in 2018. Cancer Res Treat. 2021; 53:301–15.
crossref
3. SEER Cancer stat facts: stomach cancer [Internet]. Bethesda, MD: National Cancer Institute; 2023 [cited 2023 May 25]. Available from: https://seer.cancer.gov/statfacts/html/stomach.html .
4. Kim NK, Park YS, Heo DS, Suh C, Kim SY, Park KC, et al. A phase III randomized study of 5-fluorouracil and cisplatin versus 5-fluorouracil, doxorubicin, and mitomycin C versus 5-fluorouracil alone in the treatment of advanced gastric cancer. Cancer. 1993; 71:3813–8.
crossref
5. Van Cutsem E, Moiseyenko VM, Tjulandin S, Majlis A, Constenla M, Boni C, et al. Phase III study of docetaxel and cisplatin plus fluorouracil compared with cisplatin and fluorouracil as first-line therapy for advanced gastric cancer: a report of the V325 Study Group. J Clin Oncol. 2006; 24:4991–7.
crossref
6. Cunningham D, Starling N, Rao S, Iveson T, Nicolson M, Coxon F, et al. Capecitabine and oxaliplatin for advanced esophagogastric cancer. N Engl J Med. 2008; 358:36–46.
crossref
7. Kang YK, Kang WK, Shin DB, Chen J, Xiong J, Wang J, et al. Capecitabine/cisplatin versus 5-fluorouracil/cisplatin as first-line therapy in patients with advanced gastric cancer: a randomised phase III noninferiority trial. Ann Oncol. 2009; 20:666–73.
crossref
8. Ajani JA, Rodriguez W, Bodoky G, Moiseyenko V, Lichinitser M, Gorbunova V, et al. Multicenter phase III comparison of cisplatin/S-1 with cisplatin/infusional fluorouracil in advanced gastric or gastroesophageal adenocarcinoma study: the FLAGS trial. J Clin Oncol. 2010; 28:1547–53.
crossref
9. Al-Batran SE, Hartmann JT, Probst S, Schmalenberg H, Hollerbach S, Hofheinz R, et al. Phase III trial in metastatic gastroesophageal adenocarcinoma with fluorouracil, leucovorin plus either oxaliplatin or cisplatin: a study of the Arbeitsgemeinschaft Internistische Onkologie. J Clin Oncol. 2008; 26:1435–42.
crossref
10. Koizumi W, Narahara H, Hara T, Takagane A, Akiya T, Takagi M, et al. S-1 plus cisplatin versus S-1 alone for first-line treatment of advanced gastric cancer (SPIRITS trial): a phase III trial. Lancet Oncol. 2008; 9:215–21.
crossref
11. Lee KW, Chung IJ, Ryu MH, Park YI, Nam BH, Oh HS, et al. Multicenter phase III trial of S-1 and cisplatin versus S-1 and oxaliplatin combination chemotherapy for first-line treatment of advanced gastric cancer (SOPP trial). Gastric Cancer. 2021; 24:156–67.
crossref
12. Lee KW, Lee JH, Kim JW, Kim JW, Ahn S, Kim JH. Population-based outcomes research on treatment patterns and impact of chemotherapy in older patients with metastatic gastric cancer. J Cancer Res Clin Oncol. 2016; 142:687–97.
crossref
13. Lee JL, Kang YK, Kang HJ, Lee KH, Zang DY, Ryoo BY, et al. A randomised multicentre phase II trial of capecitabine vs S-1 as first-line treatment in elderly patients with metastatic or recurrent unresectable gastric cancer. Br J Cancer. 2008; 99:584–90.
crossref
14. Hwang IG, Ji JH, Kang JH, Lee HR, Lee HY, Chi KC, et al. A multi-center, open-label, randomized phase III trial of first-line chemotherapy with capecitabine monotherapy versus capecitabine plus oxaliplatin in elderly patients with advanced gastric cancer. J Geriatr Oncol. 2017; 8:170–5.
crossref
15. Aaronson NK, Ahmedzai S, Bergman B, Bullinger M, Cull A, Duez NJ, et al. The European Organization for Research and Treatment of Cancer QLQ-C30: a quality-of-life instrument for use in international clinical trials in oncology. J Natl Cancer Inst. 1993; 85:365–76.
crossref
16. Blazeby JM, Conroy T, Bottomley A, Vickery C, Arraras J, Sezer O, et al. Clinical and psychometric validation of a questionnaire module, the EORTC QLQ-STO 22, to assess quality of life in patients with gastric cancer. Eur J Cancer. 2004; 40:2260–8.
crossref
17. Osoba D, Rodrigues G, Myles J, Zee B, Pater J. Interpreting the significance of changes in health-related quality-of-life scores. J Clin Oncol. 1998; 16:139–44.
crossref
18. Hall PS, Lord SR, Collinson M, Marshall H, Jones M, Lowe C, et al. A randomised phase II trial and feasibility study of palliative chemotherapy in frail or elderly patients with advanced gastroesophageal cancer (321GO). Br J Cancer. 2017; 116:472–8.
crossref
19. Hall PS, Swinson D, Cairns DA, Waters JS, Petty R, Allmark C, et al. Efficacy of reduced-intensity chemotherapy with oxaliplatin and capecitabine on quality of life and cancer control among Older and frail patients with advanced gastroesophageal cancer: the GO2 phase 3 randomized clinical trial. JAMA Oncol. 2021; 7:869–77.
20. Hutchins LF, Unger JM, Crowley JJ, Coltman CA Jr, Albain KS. Underrepresentation of patients 65 years of age or older in cancer-treatment trials. N Engl J Med. 1999; 341:2061–7.
crossref
21. Talarico L, Chen G, Pazdur R. Enrollment of elderly patients in clinical trials for cancer drug registration: a 7-year experience by the US Food and Drug Administration. J Clin Oncol. 2004; 22:4626–31.
crossref
22. Kemeny MM, Peterson BL, Kornblith AB, Muss HB, Wheeler J, Levine E, et al. Barriers to clinical trial participation by older women with breast cancer. J Clin Oncol. 2003; 21:2268–75.
crossref
23. Hurria A, Cohen HJ, Extermann M. Geriatric oncology research in the cooperative groups: a report of a SIOG special meeting. J Geriatr Oncol. 2010; 1:40–4.
crossref
24. Hurria A, Togawa K, Mohile SG, Owusu C, Klepin HD, Gross CP, et al. Predicting chemotherapy toxicity in older adults with cancer: a prospective multicenter study. J Clin Oncol. 2011; 29:3457–65.
crossref
25. Extermann M, Boler I, Reich RR, Lyman GH, Brown RH, DeFelice J, et al. Predicting the risk of chemotherapy toxicity in older patients: the Chemotherapy Risk Assessment Scale for High-Age Patients (CRASH) score. Cancer. 2012; 118:3377–86.
crossref
26. Kim JW, Lee YG, Hwang IG, Song HS, Koh SJ, Ko YH, et al. Predicting cumulative incidence of adverse events in older patients with cancer undergoing first-line palliative chemotherapy: Korean Cancer Study Group (KCSG) multicentre prospective study. Br J Cancer. 2018; 118:1169–75.
crossref
27. Kanesvaran R, Li H, Koo KN, Poon D. Analysis of prognostic factors of comprehensive geriatric assessment and development of a clinical scoring system in elderly Asian patients with cancer. J Clin Oncol. 2011; 29:3620–7.
crossref
28. Soubeyran P, Fonck M, Blanc-Bisson C, Blanc JF, Ceccaldi J, Mertens C, et al. Predictors of early death risk in older patients treated with first-line chemotherapy for cancer. J Clin Oncol. 2012; 30:1829–34.
crossref

Fig. 1
CONSORT diagram. FAS, full-analysis set; FL, 5-fluorouracil/leucovorin; FOLFOX, 5-fluorouracil, leucovorin and oxaliplatin; IP, investigational product; PPS, per-protocol set.
crt-2023-333f1.gif
Fig. 2
Survival curves in full-analysis set: (A) overall survival and (B) progression-free survival. CI, confidence interval.
crt-2023-333f2.gif
Fig. 3
Subgroup analysis (overall survival). CAPOX, capecitabine/oxaliplatin; ECOG, Eastern Cooperative Oncology Group; FOLFOX, 5-fluorouracil, leucovorin and oxaliplatin.
crt-2023-333f3.gif
Table 1
Dosage and administration of study treatment regimens
Group Regimen Starting dose (cycle 1)a) Full dose (cycle 2 or later)b)
A 5-FU, leucovorin and oxaliplatin (FOLFOX) Oxaliplatin (80 mg/m2) IV on day 1, leucovorin (80 mg/m2) IV on day 1, and 5-FU (1,900 mg/m2; over 46 hr) IV on day 1 every 2 wk Oxaliplatin (100 mg/m2) IV on day 1, leucovorin (100 mg/m2) IV on day 1, and 5-FU (2,400 mg/m2; over 46 hr) IV on day 1 every 2 wk
Capecitabine and oxaliplatin (CAPOX) Oxaliplatin (100 mg/m2) IV on day 1, and capecitabine (800 mg/m2) orally twice a day (days 1–14) every 3 wk Oxaliplatin (130 mg/m2) IV on day 1, and capecitabine (1,000 mg/m2) orally twice a day (days 1–14) every 3 wk
S-1 and cisplatin Cisplatin (50 mg/m2) IV on day 1, and S-1 (30 mg/m2) orally twice a day (days 1–14) every 3 wk Cisplatin (60 mg/m2) IV on day 1, and S-1 (40 mg/m2) orally twice a day (days 1–14) every 3 wk
Capecitabine and cisplatin Cisplatin (50 mg/m2) IV on day 1, and capecitabine (1,000 mg/m2) orally twice a day (days 1–14) every 3 wk Cisplatin (60 mg/m2) IV on day 1, and capecitabine (1,250 mg/m2) orally twice a day (days 1–14) every 3 wk
B 5-FU and leucovorin (FL) Leucovorin (100 mg/m2) IV on day 1, and 5-FU (2,400 mg/m2; over 46 hr) IV on day 1 every 2 wk Same as cycle 1
Capecitabine Capecitabine (1,250 mg/m2) orally twice a day (days 1–14) every 3 wk when CCr ≥ 60 mL/min; capecitabine (1,000 mg/m2) twice a day (days 1–14) every 3 wk when CCr < 60 mL/min Same as cycle 1
S-1 S-1 (40 mg/m2) orally twice a day (days 1–14) every 3 wk when CCr ≥ 60 mL/min; S-1 (30 mg/m2) twice a day (days 1–14) every 3 wk when CCr < 60 mL/min Same as cycle 1

5-FU, 5-fluorouracil; CCr, creatinine clearance; IV, intravenously.

a) In group A, starting dose was about 80% of standard dose in each regimen. In contrast, in group B, study treatment was started with standard dose (100%),

b) In group A, after the completion of first cycle of chemotherapy, the dose of chemotherapeutic agents could be escalated to 100%. This was at the discretion of the investigator based on the observed toxicities during the first cycle.

Table 2
Patient characteristics (full-analysis set)
Variable Total (n=104) Combination therapy (group A, n=53) Monotherapy (group B, n=51) p-value
Age (yr)
 < 75 44 (42.3) 22 (41.5) 22 (43.1) 0.867a)
 ≥75 60 (57.7) 31 (58.5) 29 (56.9)
Sex
 Male 76 (73.1) 38 (71.7) 38 (74.5) 0.747a)
 Female 28 (26.9) 15 (28.3) 13 (25.5)
ECOG performance status
 0–1 82 (78.8) 43 (81.1) 39 (76.5) 0.561a)
 2 22 (21.2) 10 (18.9) 12 (23.5)
Fluoropyrimidine backbone
 5-FU 40 (38.5) 21 (39.6) 19 (37.3) 0.940a)
 Capecitabine 35 (33.7) 17 (32.1) 18 (35.3)
 S-1 29 (27.9) 15 (28.3) 14 (27.5)
Lauren classification
 Intestinal 31 (29.8) 20 (37.7) 11 (21.6) 0.106b)
 Diffuse 25 (24.0) 9 (17.0) 16 (31.4)
 Mixed 1 (1.0) 1 (1.9) 0
 Unknown 47 (45.2) 23 (43.4) 24 (47.1)
Gastrectomy
 Primary metastatic without gastrectomy 73 (70.2) 35 (66.0) 38 (74.5) 0.591a)
 Primary metastatic with gastrectomy 13 (12.5) 7 (13.2) 6 (11.8)
 Recurrent 18 (17.3) 11 (20.8) 7 (13.7)
Previous adjuvant chemotherapy
 No 97 (93.3) 49 (92.5) 48 (94.1) > 0.99b)
 Yes 7 (6.7) 4 (7.5) 3 (5.9)
No. of metastatic organs
 0–1 62 (59.6) 34 (64.2) 28 (54.9) 0.337a)
 2 26 (25.0) 10 (18.9) 16 (31.4)
 3 or more 16 (15.4) 9 (17.0) 7 (13.7)
Metastatic organs
 Distant abdominal lymph nodes 43 (41.3) 22 (41.5) 21 (41.2) 0.973a)
 Peritoneum 39 (37.5) 16 (30.2) 23 (45.1) 0.116a)
 Liver 32 (30.8) 19 (35.8) 13 (25.5) 0.253a)
 Lung 13 (12.5) 8 (15.1) 5 (9.8) 0.415a)
 Bone 6 (5.8) 3 (5.7) 3 (5.9) > 0.99b)
 Neck and mediastinal lymph nodes 5 (4.8) 1 (1.9) 4 (7.8) 0.201b)
 Others 22 (21.2) 10 (18.9) 12 (23.5) 0.561a)
Comorbidities
 Hypertension 43 (41.3) 25 (47.2) 18 (35.3) 0.219a)
 Diabetes mellitus 20 (19.2) 11 (20.8) 9 (17.6) 0.688a)
 Cerebrovascular disease 7 (6.7) 3 (5.7) 4 (7.8) 0.713b)
 Chronic obstructive pulmonary disease or asthma 6 (5.8) 4 (7.5) 2 (3.9) 0.678b)
 Coronary heart disease 5 (4.8) 1 (1.9) 4 (7.8) 0.201b)
 Arrhythmia 5 (4.8) 3 (5.7) 2 (3.9) > 0.99b)

Values are presented as number (%). 5-FU, 5-fluorouracil; ECOG, Eastern Cooperative Oncology Group.

a) Chi-square test,

b) Fisher’s exact test.

Table 3
Tumor response (full-analysis set)
Combination therapy (group A, n=35) Monotherapy (group B, n=36) p-value
Complete response 0 0
Partial response 12 (34.3) 9 (25.0)
Stable disease 15 (42.9) 12 (33.3)
Progressive disease 3 (8.6) 8 (22.2)
Not evaluable 5 (14.3) 7 (19.4)
Objective response rate (ORR) 12 (34.3) 9 (25.0) 0.391a)
95% Confidence interval (ORR, %) 19.1–52.2 12.1–42.2
Disease control rate (DCR) 27 (77.1) 21 (58.3) 0.090a)
95% Confidence interval (DCR, %) 59.9–89.6 40.8–74.5

Values are presented as number (%) unless otherwise indicated.

a) Chi-square test.

Table 4
Treatment-related adverse events
Combination therapy (group A, n=53)
Monotherapy (group B, n=51)
Any grade ≥Grade 3 Any grade ≥Grade 3
Neutropenia 23 (43.4) 2 (3.8) 11 (21.6) 1 (2.0)
Anemia 49 (92.5) 6 (11.3) 46 (90.2) 4 (7.8)
Thrombocytopenia 22 (41.5) 0 10 (19.6) 0
Fatigue 25 (47.2) 2 (3.8) 14 (27.5) 1 (2.0)
Anorexia 34 (64.2) 1 (1.9) 18 (35.3) 1 (2.0)
Nausea 20 (37.7) 3 (5.7) 18 (35.3) 1 (2.0)
Vomiting 8 (15.1) 2 (3.8) 5 (9.8) 1 (2.0)
Diarrhea 12 (22.6) 1 (1.9) 6 (11.8) 0
Stomatitis 7 (13.2) 0 5 (9.8) 1 (2.0)
Abdominal pain 6 (11.3) 0 8 (15.7) 1 (2.0)
Constipation 5 (9.4) 0 4 (7.8) 0
Dyspepsia 5 (9.4) 0 2 (3.9) 0
Hand-foot syndrome 7 (13.2) 0 4 (7.8) 1 (2.0)
Peripheral neuropathy 26 (49.1) 2 (3.8) 0 0
Pruritis 3 (5.7) 0 1 (2.0) 0
Weight loss 3 (5.7) 0 1 (2.0) 0
Dizziness 3 (5.7) 0 1 (2.0) 0
Flu-like symptoms 3 (5.7) 0 0 0
Hiccups 3 (5.7) 0 0 0
Hyponatremia 18 (34.0) 1 (1.9) 20 (39.2) 2 (3.9)
Increased bilirubin 12 (22.6) 0 11 (21.6) 0
Increased creatinine 4 (7.6) 0 4 (7.8) 0

Values are presented as number (%).

TOOLS
Similar articles