

 PDF
PDF Citation
 Print
Print


INTRODUCTION
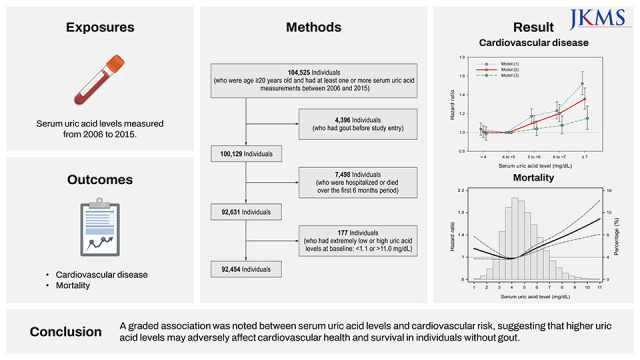
Cardiovascular disease (CVD) is a leading cause of mortality worldwide, with approximately 17.6 million deaths attributed to CVD in 2016, indicating an increase of 14.5% from that reported in 2006.12 To enhance understanding and help with the management of CVD, investigations to identify novel risk factors are necessary for the early detection of individuals at high risk and for primary prevention.3
Uric acid represents the end product of purine metabolism in humans. Pathologically high levels of uric acid, which can be caused by genetic determinants, environmental factors (including a purine/fructose-rich diet), overproduction from cell turnover, and renal underexcretion, can lead to crystal precipitation, resulting in diseases such as gout or urolithiasis.4 More importantly, several epidemiological studies have reported serum uric acid levels to be independently associated with various metabolic disorders, such as hypertension, insulin resistance, chronic kidney disease, and metabolic syndrome.5678910 These clinical conditions largely contribute to the pathophysiology of CVD; however, the relationship between serum uric acid levels and CVD is not sufficiently clear, given that most available data are based on small studies with a limited number of patients, which have major limitations such as heterogenous study populations (e.g., individuals with or without gout), short follow-up durations (e.g., by censoring for loss to follow-up or transfer to other hospital), and disparate covariable adjustments.11121314 Of note, hyperuricemia is a chronic condition that requires the long-term follow-up of a large number of individuals to evaluate whether serum uric acid levels are associated with adverse cardiovascular outcomes.
Therefore, this study aimed to investigate the association of serum uric acid levels with incident CVD and cardiovascular mortality in a large cohort of Korean adults without a diagnosis of gout by linking and utilizing detailed clinical and longitudinal data from the National Health Insurance Service (NHIS) Ilsan Hospital and the Korean claims database, respectively.
METHODS
Study design and source population
In this large, longitudinal cohort study, we used laboratory data on serum uric acid levels from the Clinical Data Warehouse of NHIS Ilsan Hospital to identify all adults (> 19 years of age) who have had their serum uric acid levels measured at least once at outpatient clinical settings from January 1, 2006 to December 31, 2015. The index date for each participant was defined as the date of the first serum uric acid measurement. Of the 104,525 total individuals with available uric acid data, we first excluded 4,396 individuals who had a diagnostic code of gout at any time before the index date. We then excluded 7,498 individuals who were hospitalized or who died within 6 months from the index date. Furthermore, we excluded 177 individuals who had extremely low or high uric acid levels (< 1.1 or > 11.0 mg/dL; < 0.1 or > 99.9 percentiles of observed values, respectively). Finally, a total of 92,454 individuals were included in the study population (Supplementary Fig. 1).
Data collection and measurements
To ascertain comorbid conditions and person-level longitudinal cardiovascular outcomes, we linked our constructed cohort to the NHIS claims database, which includes all medical records of covered inpatient and outpatient visits, procedures, and prescriptions for all citizens in Korea.1516 Baseline data on sociodemographic information were collected on the index date. Comorbidities (e.g., hypertension, diabetes, ischemic heart disease, congestive heart failure, cerebrovascular disease, dyslipidemia, and malignancy) were assessed using the International Statistical Classification of Disease and Related Health Problems, Tenth Revision coding algorithms (Supplementary Table 1), which were ascertained by the presence of at least one diagnostic code during hospitalization or by two or more outpatient diagnostic codes up to 5 years before the index date. Use of angiotensin-converting enzyme inhibitors, angiotensin-receptor blockers, or uric acid-lowering drugs (e.g., allopurinol, benzbromarone, or febuxostat) was defined as a prescription for these medications within 1 year before the index date. To minimize measurement variability, all laboratory values (such as serum uric acid, albumin, total cholesterol, and creatinine levels) within a 6-month period starting from the index date were averaged and used for analyses. The estimated glomerular filtration rate (eGFR) was determined based on the Chronic Kidney Disease Epidemiology Collaboration equation for creatinine.17
Exposure and outcome ascertainment
The exposure of interest was the serum uric acid level, which was analyzed as: 1) a continuous variable in 1-mg/dL increments and 2) a categorical variable wherein the serum uric acid level was divided into five groups: < 4.0, 4.0 to < 5.0, 5.0 to < 6.0, 6.0 to < 7.0, and ≥ 7.0 mg/dL. In the analyses with categorical variables, we defined the 4.0 to < 5.0 mg/dL category as the reference category, because the mean value in the study participants was 4.8 mg/dL and the event rate was the lowest in this group; this allowed for the most precise comparison with lower and higher categories. We also considered the uric acid level as a continuous variable and modelled a nonlinear effect using a restricted cubic spline function.
The primary outcome was the composite of CVD and cardiovascular mortality. CVD included ischemic heart disease (International Classification of Disease, Tenth Revision [ICD-10] codes: I20–I25) and stroke (ICD-10 codes: I60–I69), defined by claims with diagnosis codes for the first hospitalization.18 Cardiovascular death (ICD-10 codes: I00–99) was determined by linkage to the National Death Index. The secondary outcomes were CVD and cardiovascular mortality examined separately, assessed in a time-to-first-event analysis. The cause-specific cardiovascular death from acute myocardial infarction (ICD-10 codes: I21, I22), stroke (ICD-10 codes: I60–I69), and heart failure (ICD-10 codes: I50), were also evaluated. Follow-up began on the index date and continued until the occurrence of any event or December 31, 2017 (study end date), whichever came first.
Statistical analysis
Data from descriptive analyses are presented as mean (standard deviation, SD), median (interquartile range, IQR), or number (proportions), as appropriate. To evaluate the associations between uric acid levels and subsequent cardiovascular outcomes, Cox proportional-hazards models with three incremental levels of adjustment were established as follows: 1) Model 1: unadjusted; 2) Model 2 (case-mix): adjusted for age, sex, comorbid conditions of hypertension, diabetes, ischemic heart disease, congestive heart disease, stroke, dyslipidemia, and malignancy, and use of angiotensin-converting enzyme inhibitors and/or angiotensin-receptor blockers, diuretics, or uric acid-lowering drugs; and 3) Model 3: adjusted for all covariables in Model 2 plus laboratory measurements, including serum albumin and total cholesterol levels and eGFR. We a priori defined the case-mix adjusted model (Model 2) as our preferred model, which included core sociodemographic measures and other confounders of the association between serum uric acid levels and outcomes. Although no missing data were noted for covariables in the case-mix models, varying degrees of missing data were observed for covariables in the case-mix + laboratory model (Model 3), which have the potential for inherent selection bias due to missing data. Therefore, Model 3 was designated as an exploratory model, which included confounders as well as potential causal pathway intermediates of the uric acid-CVD association.
To test the robustness of our findings, we performed subgroup analyses across the following subgroups: age (< 65 and ≥ 65 years), sex (male and female), medical history of diabetes, CVD (presence and absence), serum albumin level (< 4.0 and ≥ 4.0 g/dL), and eGFR (< 60 and ≥ 60 mL/min/1.73 m2). We used the same covariables for adjustment in the case-mix models, as described for the main analyses. The risk of cardiovascular adverse outcomes is expressed as hazard ratios (HRs) and 95% confidence intervals (CIs). All analyses were conducted using Stata, version 15.1 (Stata Corporation, College Station, TX, USA).
Ethics statement
This study was carried out in accordance with the Declaration of Helsinki, and the Institutional Review Board of the NHIS Ilsan Hospital approved this study and waived the requirement for informed consent, given that only deidentified data were used (approval number: NHIMC 2022-08-009-003).
RESULTS
Baseline characteristics of the study population
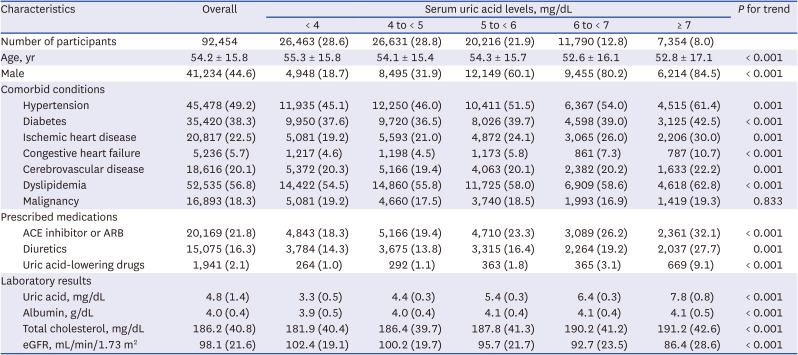
The baseline characteristics of the 92,454 participants are presented in Table 1, which includes the overall population and serum uric acid level categories. The median age of the study participants was 53 years (IQR, 43–67 years); overall, 44.6% were male and 2.1% had received uric acid-lowering medications at the time of cohort entry. The mean and median uric acid levels were 4.8 (SD, 1.4) mg/dL and 4.7 (IQR, 3.8–5.7) mg/dL, respectively. In this study population, 87.3% had preserved renal function (eGFR ≥ 60 mL/min/1.73 m2). Individuals in the higher uric acid level categories were more likely to be younger; male; have more frequent use of angiotensin-converting enzyme inhibitors and/or angiotensin-receptor blockers, diuretics, or uric acid-lowering drugs; and have a higher prevalence of comorbidities. Additionally, those with higher uric acid levels tended to have higher total cholesterol levels and a lower eGFR.
Table 1
Baseline characteristics of study participants
Uric acid and risk of cardiovascular outcomes
During a median follow-up of 4.7 (IQR, 3.0–6.5) years (432,597 person-years of follow-up), 7,670 (8.3%) composite events of CVD and cardiovascular death, 7,186 (7.8%) cases of CVD, and 1,045 (1.1%) cardiovascular deaths were noted, with a crude incidence rate of 18.0 (95% CI, 17.6–18.4), 16.8 (95% CI, 16.4–17.2), and 2.3 (95% CI, 2.2–2.5) per 1,000 person-years, respectively. Compared with the reference category of 4.0 to < 5.0 mg/dL, incrementally higher uric acid levels were associated with a stepwise increase in the event rates of primary and secondary outcomes (Table 2).
Table 2
Multivariable associations of serum uric acid levels with cardiovascular risk
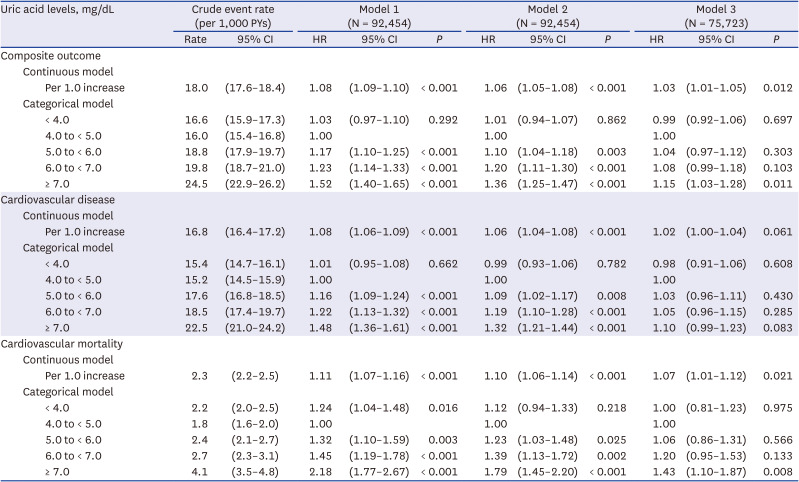
Adjustments in 1) Model 1: unadjusted; 2) Model 2: age, sex, comorbidities, and use of medications; 3) Model 3: all covariables in Model 2 plus laboratory measurements including serum albumin level, total cholesterol level, and estimated glomerular filtration rate.
CI = confidence interval, HR = hazard ratio, PYs = person-years.
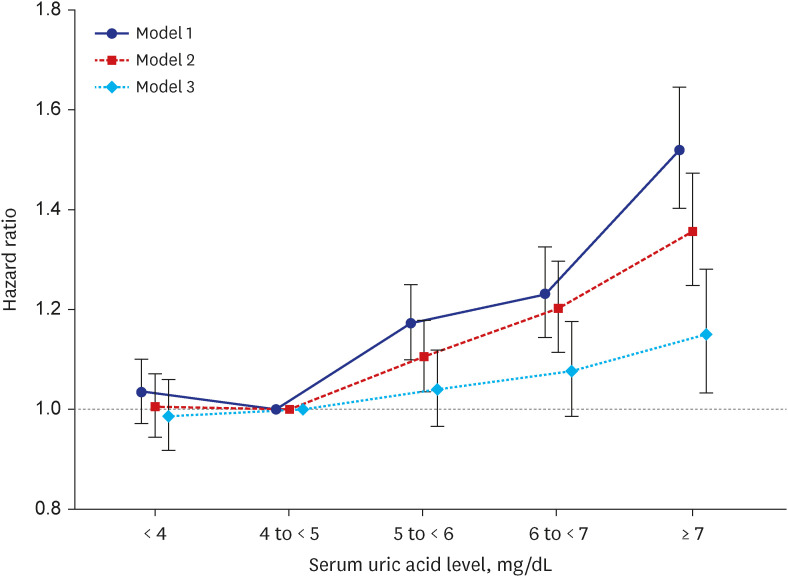
In the primary analyses, which were adjusted for sociodemographic data, comorbidities, and medications (Model 2), a graded association was noted between an incrementally higher uric acid level and increasingly higher risk of CVD or cardiovascular mortality. In the analyses examining the uric acid level as a continuous variable, each 1-mg/dL increment in the serum uric acid level was significantly associated with a 6% higher risk of composite outcomes. In the categorical analyses, compared with that for the reference category of 4.0 to < 5.0 mg/dL, the adjusted HRs for higher uric acid level categories of 5.0 to < 6.0, 6.0 to < 7.0, and ≥ 7.0 mg/dL were 1.10 (1.04–1.18), 1.20 (1.11–1.30), and 1.36 (1.25–1.47), respectively. After additional adjustment for laboratory measurements (such as serum albumin, total cholesterol levels, and eGFR; i.e., Model 3), these associations were mildly attenuated at uric acid levels of < 7.0 mg/dL, whereas the association with higher a cardiovascular risk remained robust at uric acid levels of ≥ 7.0 mg/dL (Table 2, Fig. 1).
Fig. 1
Associations between serum uric acid levels and the risk of composite cardiovascular outcomes. Adjustments in 1) Model 1: unadjusted; 2) Model 2: age, sex, comorbidities, and use of medications; 3) Model 3: all covariables in Model 2 plus serum albumin level, total cholesterol level, and estimated glomerular filtration rate.
Moreover, in the secondary analyses for CVD or cardiovascular mortality, which were examined separately, a higher uric acid level was similarly associated with a higher risk of each adverse outcome: the case-mix adjusted HRs for uric acid level categories of 5.0 to < 6.0, 6.0 to < 7.0, and ≥ 7.0 mg/dL were 1.09 (1.02–1.17), 1.19 (1.10–1.28), and 1.32 (1.21–1.44) for CVD and 1.23 (1.00–1.48), 1.39 (1.13–1.72), and 1.79 (1.45–2.20) for cardiovascular mortality, respectively (Table 2, Supplementary Fig. 2). Uric acid levels of ¡Ã 7.0 mg/dL were also associated with higher risks of specific cardiovascular mortality from acute myocardial infarction (n = 160, 0.2%), stroke (n = 372, 0.4%), and heart failure (n = 95, 0.1%) (Supplementary Table 2).
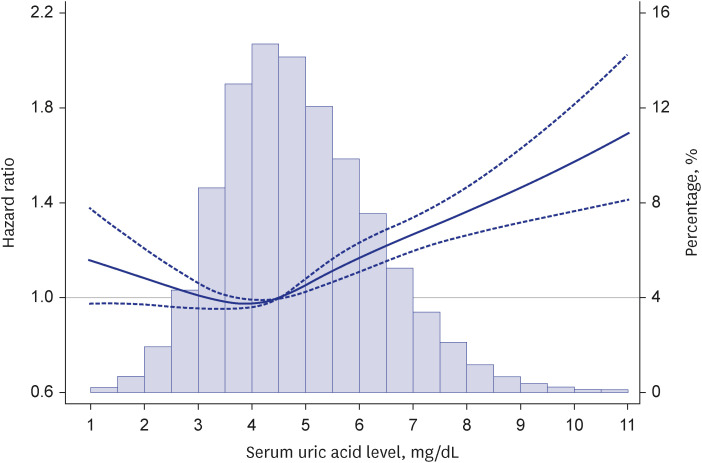
Further, when we examined the serum uric acid level as a continuous variable in case-mix adjusted cubic spline models, similar relationships were noted between the uric acid level and the risk of composite and secondary outcomes, and a progressively marked increase in the risk was observed above the median value of uric acid levels (Fig. 2, Supplementary Fig. 3).
Fig. 2
Associations between serum uric acid levels and cardiovascular outcomes using adjusted restricted cubic spline analyses. All models were adjusted for age, sex, comorbidities, use of angiotensin-converting enzyme inhibitors or angiotensin-receptor blockers, use of diuretics, and use of uric acid-lowering drugs. A histogram of observed serum uric acid levels and a hazard reference ratio of 1 (solid line) is overlaid.
Subgroup analyses
Given the potential heterogeneity of the study population, we also examined the association between uric acid levels and the risk of cardiovascular outcomes across clinically relevant subgroups (Supplementary Figs. 4, 5, 6). The aforementioned patterns of associations were robust and generally consistent across subgroups defined by age, sex, presence of diabetes or CVD, serum albumin levels, and eGFR. Exceptionally, in analyses stratified by age and prevalent CVD, the graded relationship between higher uric acid levels and higher risk of cardiovascular mortality was markedly attenuated in individuals aged < 65 years or in those with prior CVD, wherein cardiovascular risk was not significantly increased for uric acid levels of 5.0 to < 6.0, 6.0 to < 7.0, and ≥ 7.0 mg/dL, as compared with that noted for the reference category of 4.0 to < 5.0 mg/dL.
DISCUSSION
In this large longitudinal cohort study of Korean adults without gout, we examined the association of serum uric acid levels with incident CVD and mortality and found a graded association between serum uric acid levels and cardiovascular risk, wherein incrementally higher uric acid levels were associated with a significantly higher risk of incident CVD or cardiovascular mortality. These associations were generally consistent across clinically relevant subgroups defined by age, sex, diabetes, CVD, serum albumin levels, and kidney function. Thus, our robust findings suggest that higher uric acid levels may have adverse effects on cardiovascular health and survival in individuals without clinical gout.
Several studies have examined the relationship between serum uric acid levels and adverse clinical events. To date, many epidemiological studies have reported the potentially harmful association of elevated concentrations of serum uric acid with hypertension, metabolic syndrome/type 2 diabetes, and chronic kidney disease,5678910 through multiple different mechanisms, including vascular endothelial dysfunction,101920 induction of oxidative metabolism,21 activation of the renin-angiotensin system,22 and pro-inflammatory activity.23 In contrast, serum levels of uric acid are not consistently associated with CVD according to disparate covariable adjustment strategies. For example, in a previous report of the British Regional Heart Study, which included 7,688 middle-aged men, a positive association was reported between the serum uric acid level and the risk of coronary heart disease after adjustment for lifestyle factors and disease indicators; however, this relationship was no longer statistically significant after further adjustment for the blood pressure and serum total cholesterol levels.24 In addition, a community-based report of 6,763 Framingham Heart Study participants found that the significant uric acid-cardiovascular risk association observed in the unadjusted model disappeared in multivariable adjusted models, especially after adjusting for the use of diuretics.7 Another important and likely potential confounder for these seemingly discrepant results among studies is the kidney function. A study of 10,956 US adult participants from the National Health and Nutrition Examination Survey from 1988 to 2002 reported that a high uric acid level was associated with cardiovascular and all-cause mortality, while this relationship was no longer statistically significant after accounting for the kidney function.25 Hence, these discrepant findings across observational studies are likely to reflect shared and complex causal linkages among potential risk factors used in multivariable analyses.26
As an extension of these previous works, our core objective was to examine the association of the serum uric acid concentration with cardiovascular outcomes by accounting for confounders potentially affecting both the exposure and outcomes. In the case-mix analyses, a significant relationship was noted between an incrementally higher level of serum uric acid and cardiovascular risk, and these associations persisted across most subgroups. Although these associations were much attenuated after further adjusting for laboratory parameters, higher uric acid levels tended to trend toward increased cardiovascular risk in the normal range of 4 to < 7 mg/dL. Of note, higher uric acid level categories of ≥ 7.0 mg/dL were consistently associated with a significantly high risk of composite cardiovascular events and cardiovascular mortality, even after adjusting for serum albumin and total cholesterol levels and eGFR. While the underlying mechanisms responsible for uric acid-related adverse outcomes warrant further investigations, our observations highlight the need for well-designed future studies to determine whether a decrease in serum uric acid levels improves the hard outcomes in the general population as well as patient populations with a higher risk of CVD.
The strengths of our study include its examination of a relatively large cohort of Korean adults with serum uric acid measurements obtained in an ambulatory setting; a long follow-up period up to 12 years; the comprehensive availability of detailed subject-level information (including comorbidities, medications, and laboratory tests); and allowing for precise and longitudinal outcome ascertainment by integrating data from hospital and nationwide claims databases. However, this study had several limitations. First, the included patients were required to have at least one serum uric acid measurement, and while the indications for which uric acid measurement within the study population cannot be ascertained, this was likely at the discretion of medical providers. Furthermore, details for the study population were derived from a hospital database (i.e., those at a relatively higher risk of CVD); therefore, our findings may not necessarily be generalizable to healthy individuals with few comorbidities. As serum uric acid is not routinely checked in general health screening examinations in South Korea, future studies including healthy individuals are needed to validate these findings. Second, given the observational nature of our study, we could not infer the causality of the observed associations between the uric acid level and cardiovascular risk. Finally, residual confounding factors could still be a limitation as we did not capture complete data on potential risk factors such as blood pressure, obesity, socioeconomic status, or health behaviors (e.g., dietary pattern or smoking status), some of which might mediate the path of the relationship between serum uric acid and CVD. Therefore, we could not assume that all measured covariables were sufficient to adjust for all biases. Nonetheless, it can be addressed, at least in part, by vigorous adjustments for measured covariables such as demographic, clinical, and laboratory parameters.
In conclusion, elevated serum uric acid levels were associated with a higher risk of CVD or cardiovascular mortality; this relationship remained significant even after extensive adjustment for relevant clinical and laboratory covariables and subgroup analyses. Therefore, additional investigations aimed at deciphering the role of uric acid as an index of risk and therapeutic target are needed.
 XML Download