

 PDF
PDF Citation
 Print
Print


INTRODUCTION
Volume overload is the important pathophysiologic mechanism of various symptoms and signs in heart failure (HF), such as dyspnea, pulmonary congestion, and pitting edema. HF patients with volume overload and fluid congestion showed high risk of hospitalization.1 The management of congestion and maintenance of euvolemic status is essential for HF management. Therefore, evaluating the state of body fluids is the key component of HF patient care.
There are various methods for evaluating volume status at the bedside.2 Physical examinations such as lung sound, peripheral edema, jugular venous distention, hepatojugular reflux and the third heart sound are important signs of volume overload in patients with HF. Biochemical examinations such serum and urine osmolality, hematocrit, and serum natriuretic peptides are also used as indicators of volume status. The golden standard method of volume status evaluation is measuring pulmonary capillary wedge pressure by cardiac catheterization,3 however invasiveness limits wide use. Echocardiographic examination4 and measurement of natriuretic peptide (N-terminal pro-B-type natriuretic peptide [NT-proBNP] or B-type natriuretic peptide [BNP]) levels5 are most widely used methods for volume status evaluation recently. However, their clinical use might be affected by invasiveness, training proficiency of clinician, cost, and accessibility. Moreover, diurnal variations and less sensitivity to measure small changes of extracellular fluid limits its serial measurement in patients with HF. Therefore, there is unmet need for effective methods for serial follow up of volume status in patients with HF during hospitalization.
Bioelectrical impedance analysis (BIA) with a body composition analyzer might be a promising method fulfilling non-invasive, inexpensive tool for serial measurement of volume status.67 BIA applies alternating current to the body and measuring changes in impedance/resistance as it relates to changes in volume. The recent advancement of multi-segmental, multi-frequency BIA technology can discriminate extracellular water (ECW) and intracellular water (ICW). The potential implication of BIA method in peri-operative fluid evaluation,8 chronic HF,9 liver disease,10 and kidney disease 9
,
11 have been studied. Furthermore, we previously reported the potential the diagnostic implication of BIA in acute HF among patients who presented emergency room with dyspnea.12 However, to evaluate the treatment responsiveness, to determining the future patient treatment plans, and to predict prognosis in patients hospitalized for exacerbation of HF, knowing the change in volume status between at the time of admission (before treatment) and at discharge (after treatment) is a key factor. Until recently, there have been few research studies on association between volume status changes in patients with HF through serial measurement of BIA parameters and their prognosis. In this context, the aim of this study was to evaluate the prognostic implication of serial measurement of BIA parameters in patients hospitalized for acute HF.
METHODS
Study design and study population
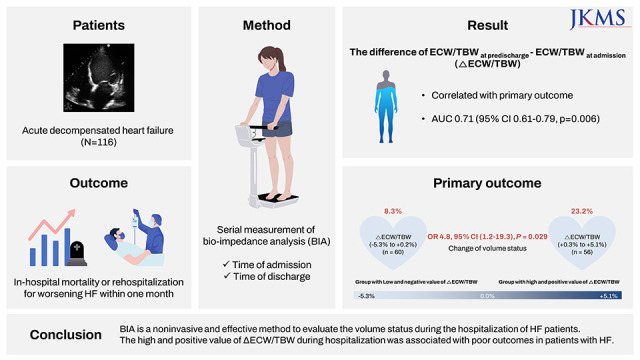
This is a retrospective observational study and screened 310 patients who were hospitalized due to acute decompensated HF between November 2021 and September 2022. Among them, 116 patients with acute HF who were underwent BIA at the time of admission and at discharge were evaluated. The primary outcome was the composite of in-hospital mortality or rehospitalization for worsening HF within one month of follow-up. The secondary outcomes included length of a hospital stay, dose of diuretics at discharge, and the rate of the guideline-directed medical therapy prescription. HF was diagnosed by cardiologists, internists, or residents, based on HF guidelines.1314 The detailed study flow was illustrated in Fig. 1.
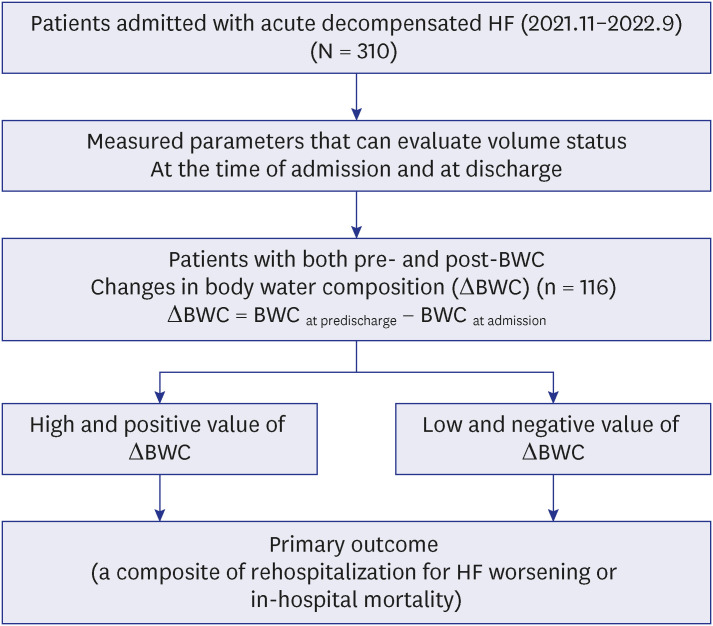
Fig. 1
Study flow. Among 310 patients hospitalized for acute decompensated HF from November 2021 to September 2022, 116 patients with acute HF who underwent BIA at the time of admission (pre-BIA) and at discharge (post-BIA) were included in this study. Patients were divided into two groups according to changes in body water composition.
HF = heart failure, BWC = body water composition, BIA = bioelectrical impedance analysis.
![]()
Clinical data collection
The clinical data of the enrolled patients were retrieved from the electronic medical records. Baseline demographic information, comorbidities, etiology of HF were assessed. The baseline characteristics included sex, age, height, weight, body mass index (BMI), and history of previous HF. We obtained the following clinical information from the medical records: etiology, aggravating factors, comorbidities, vital signs at admission and discharge, discharge medication list, discharge date, readmission date, and follow-up data. Also, we obtained laboratory test results including NT-proBNP or BNP, serum creatinine, estimated glomerular filtration rate (eGFR), hematocrit, echocardiographic examination, and BIA parameters. Chronic kidney disease (CKD) was defined as decreased estimated eGFR to 60 mL/min/1.73 m2 or less at least 3 months1516 or who had an already diagnosis of CKD before hospitalization were classified as a CKD patients. We also classified HF with the standard of ejection fraction by HF with preserved ejection fraction (HFpEF) (EF ≥ 50%), HF with mildly reduced ejection fraction (HFmrEF) (EF 41–49%), HF with reduced ejection fraction (HFrEF) (EF ≤ 40%), and the cause of the HF by ischemia, cardiomyopathy, valvular disease, arrhythmia, and the others. Arrhythmia included atrial fibrillation, atrial flutter, and tachycardia-induced arrhythmia. Echocardiographic parameters such as left ventricular ejection fraction (LVEF), left ventricular internal diameter in diastole (LVIDd), left ventricular internal diameter in systole, left atrial volume index, E/e' (The ratio between early mitral inflow velocity and mitral annular early diastolic velocity), and pulmonary artery systolic pressure were considered in this study.
BIA measurement
BIA was performed using the portable multi-frequency bio-impedance device (InBody S10; InBody Co. Ltd., Seoul, Korea). The method of BIA with Inbody S10 has been published elsewhere.111718 Briefly, all patients lying posture for 10 minutes before the examination and electrodes were applied to both arm and leg, the foot electrodes should be positioned between patient’s anklebone and heel. Body water composition including ICW, ECW, TBW, and ratio of ECW to TBW (ECW/TBW) were calculated automatically by the BIA device. We converted the ratio of ECW to TBW to percentage to compare quantities effectively. All parameters were measured at the time of admission and discharge. The difference obtained by subtracting the value of the body water compositions (BWCs) measured at the time of hospitalization from the value of body water compositions measured at the time of discharge was defined as a changes in volume status measurements (ΔBWC = BWC at predischarge – BWC at admission). If these differences were high and positive value, it means that the control of volume status in patients with HF is not appropriate.
Statistical analysis
Categorical variables were presented as absolute counts and percentages, with comparisons by the Chi-squared test, while continuous variables were expressed as mean ± SD or median value (interquartile range [IQR]) with comparisons with the Student’s t-test or Mann-Whitney test. The linear correlation between clinical and laboratory values and BIA parameters was analyzed using Pearson’s bivariate correlation analysis. We determined the cut-off value for the BIA parameters for predicting primary outcome using a receiver operating characteristic (ROC) curve analysis. Furthermore, multiple logistic regression analysis was performed to identify the risk factors associated with primary outcome. The result of primary outcome is reported as the odds ratio (OR) of each variable with a 95% confidence interval (CI). OR adjusted with age, sex, BMI, hypertension, diabetes mellitus (DM), chronic kidney disease, and history of revascularization. Two-tailed p values less than 0.05 were considered to be statistically significant. Statistical analyses were performed using the IBM SPSS Statistics software Version 25.0 (IBM Corp., Armonk, NY, USA) and MedCalc Version 20 were used.
Ethics statement
The protocols of this observational study were reviewed and approved by the Institutional Review Board (IRB) of Seoul National University Hospital (IRB No. 2212-023-1383). All the study protocols complied with the ethical guidelines of the 2013 Declaration of Helsinki. The requirement for informed consent from the IRB was waived.
RESULT
Baseline characteristics
Of the 310 patients screened, 116 patients with acute HF who underwent BIA at the time of admission and at discharge were evaluated. Table 1 shows baseline characteristics. In all subjects, the median age was 77 years [IQR, 67–82 years], the median value of BMI was 23.0 (IQR, 20.6–26.0) kg/m2, and 57.8% was the male subjects. Of the patients, 51.7% had hypertension, 49.1% had DM, 18.1% had dyslipidemia, 37.1% had a chronic kidney disease, 42.2% had atrial fibrillation, and 42.2% had a history of previous coronary revascularizations. The mean LVEF was 40.7 ± 14.6%. Regarding HF subtypes based on LVEF, the proportion of HFrEF, HFmrEF, and HFpEF was 55.8%, 11.5%, and 32.7%, respectively. The primary etiology of HF in this study was cardiomyopathy followed by ischemia, arrhythmia, and valvular heart disease. The quantitative values of body water composition (ICW, ECW, and TBW) and segmental edema indices (total, trunk, right leg, and left leg ECW/TBW) were presented in Table 1. Notably, the mean value of ECW/TBW (total, trunk, lower extremities) of patients with HF at the time of admission was more than 40.0% (normal range: 36.0–39.0%). However, the baseline characteristics did not show significant difference between the group with a high and positive ECW to TBW ratio difference (ΔECW/TBW=+0.3% to +5.1%) and the group with low and negative ECW to TBW ratio difference (ΔECW/TBW= −5.3% to +0.2%) except for ECW to TBW ratio and serum sodium concentration.
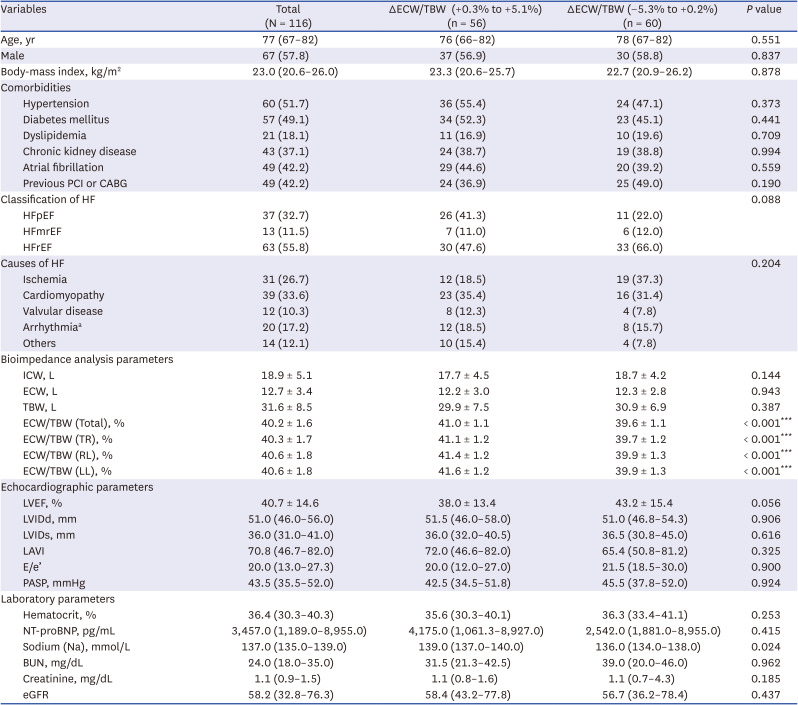
Table 1
Baseline characteristics
Data are shown as median (interquartile range) for continuous variable and absolute numbers (percentage) for dichotomous variables.
PCI = percutaneous coronary intervention, CABG = coronary artery bypass grafts, HF = heart failure, HFpEF = heart failure with preserved ejection fraction, HFmrEF = heart failure with mildly reduced ejection fraction, HFrEF = heart failure with reduced ejection fraction, TBW = total body water, ICW = intracellular water, ECW = extracellular water, TR = trunk, RL = right leg, LL = left leg, LVEF = left ventricular ejection fraction, LVIDd = left ventricular internal diameter in end diastole, LVIDs = Left ventricular internal diameter in end systole, LAVI = left atrial volume index, E/e’: the ratio between early mitral inflow velocity (E) and mitral annular early diastolic velocity (e’), PASP = pulmonary artery systolic pressure, NT-proBNP = n-terminal pro b-type natriuretic peptide, BUN = blood urea nitrogen, eGFR = estimated glomerular filtration rate.
aArrhythmia included atrial fibrillation, atrial flutter, and tachycardia-induced.
Statistically significant P values were marked with asterisks (***P < 0.001).
![]()
The correlation between BIA parameters and clinical parameters of HF patients
We evaluated the correlation between BMI, echocardiographic parameters, natriuretic peptides, and BIA parameters (Table 2). Body fluid parameters (ICW, ECW, and TBW) showed a statistically significant positive correlation with BMI. However, the ratio of ECW to TBW, as an edema index showed a negative correlation with BMI (Pearson correlation r = −0.2, P = 0.002). Furthermore, edema index showed a statistically significant positive correlation with BNP level (Pearson correlation r = +0.4, P = 0.010) and NT-proBNP (Pearson correlation r = +0.23, P = 0.020). Regarding echocardiographic parameters, body fluid parameters (ICW, ECW, and TBW) showed statistically significant positive correlation with LVIDd. However, there was no significant correlation between LVEF, E/e’ and any parameters of BIA.
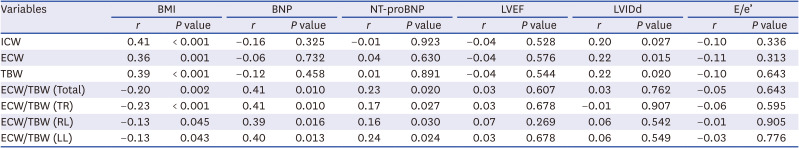
Table 2
Correlation between clinical heart failure related parameters and volume indices in bioelectrical impedance analysis
BMI = body mass index, BNP = b-type natriuretic peptide, NT-proBNP = N-terminal proBNP, LVEF = left ventricular ejection fraction, LVIDd = left ventricular internal diameter in end diastole, E/e’ = the ratio between early mitral inflow velocity (E) and mitral annular early diastolic velocity (e’), ICW = intracellular water, ECW = extracellular water, TBW = total body water, TR = trunk, RL = right leg, LL = left leg.
![]()
Clinical outcomes according to BIA parameters
We evaluated the association between the change of BIA parameters during hospitalization and the primary outcome. In analysis of pairwise comparison of volume status-related variables, ROC curves were used to predict primary outcome. The changes of body water composition (ΔICW, ΔECW, and ΔTBW) did not show the significant association with the primary outcome. However, ΔECW/TBW during hospitalization showed a good prognostic accuracy of the primary outcome (Fig. 2 and Supplementary Table 1). The area under the curve (AUC) of ΔECW/TBW was 0.71 (95% CI 0.61 – 0.79, P = 0.006) with sensitivity and specificity of 72.2% and 61.2%. In ROC curve analysis, the predictive accuracy of BNP (measured at the time of admission) was good. The AUC for prediction of the primary outcome (death or rehospitalization) was 0.85 (95% CI, 0.69–0.95; P < 0.001). Further, the areas under the ROC curve of NT-proBNP for prediction of the primary outcome was 0.66 (95% CI, 0.59–0.73; P = 0.040). However, the areas under the ROC curve of E/e’ for prediction of the primary outcome was 0.62 (95% CI, 0.51–0.72; P = 0.129) (Supplementary Table 1).
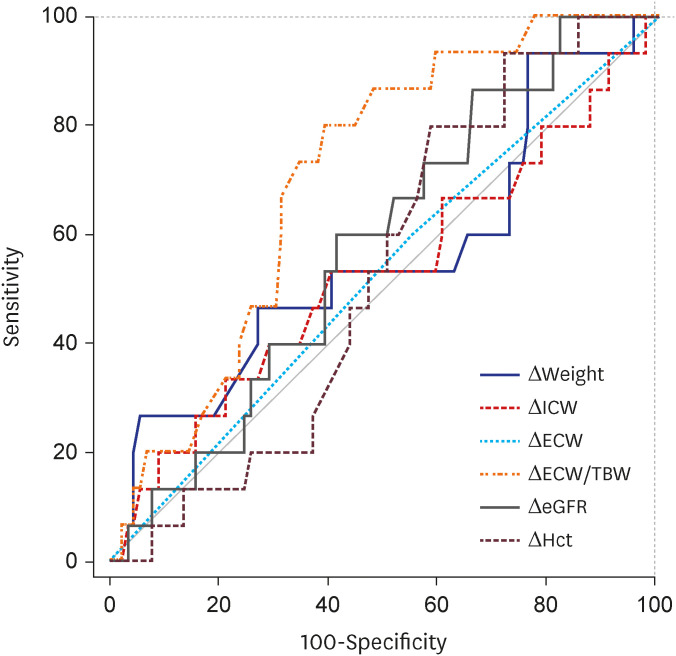
Fig. 2
Pairwise comparison of volume status related variables ROCs to predict primary outcome. ROC curves and area under curve of various volume status related variables for predicting primary outcome are presented. Δvariables: The numerical differences in variables measured at the time of discharge and at the time of admission.
ICW = intracellular water, ECW = extracellular water, TBW = total body water, eGFR = estimated glomerular filtration rate, Hct = hematocrit, ROC = receiver operating characteristic curve.
![]()
Univariate and multivariate logistic regression analysis showed that ΔECW/TBW has a significant association with primary outcome (Supplementary Table 2). Parameters considered in univariable analysis were age, gender, diabetic status, BMI, hypertension, prior revascularization, atrial fibrillation, LVEF, chronic kidney disease, Number of GDMT, diuretics prescription, ICW, ECW, ECW/TBW, ΔBody weight, ΔECW/TBW (median), ΔECW, ΔICW, and NT-proBNP. Among those parameters, parameters having a lower P value than 0.05 were considered in multivariate logistic regression analysis. Therefore, chronic kidney disease, diuretics prescription, number of GDMT (guideline-directed medical therapy), NT-proBNP, and ΔECW/TBW were included in multivariate analysis. The result of multivariate analysis about those parameters were as followed; chronic kidney disease (adjusted OR, 4.63; 95% CI, 0.96–22.26; P = 0.056), diuretics prescription (adjusted OR, 0.05; 95% CI, 0.06–0.38; P = 0.004), NT-proBNP (adjusted OR, 1.77; 95% CI, 0.39–8.07; P = 0.463), and ΔECW/TBW (adjusted OR, 12.55; 95% CI, 1.25–97.03; P = 0.018). In multivariate logistic regression analysis, even when NT-proBNP and other covariates were included, the change of the edema index (ΔECW/TBW) appeared as an independent predictor.
Clinical outcomes and subgroup analysis according to ΔECW/TBW
Next, the HF patients divided into two groups based on the median value of ΔECW/TBW to evaluate whether the change of the edema index associated with clinical outcomes. Groups with high and positive ECW to TBW ratio difference (Δ ECW/TBW = +0.3% to +5.1%), whose edema indices were increased during hospitalization, showed a significantly higher risk of the primary outcome (23.2% vs. 8.3%; adjusted OR, 4.8; 95% CI, 1.2–19.3; P = 0.029) than those with a low and negative ECW to TBW ratio difference (ΔECW/TBW = −5.3% to +0.2%) (Tables 3 and 4). This result was consistent even when the value of the Δ ECW/TBW was divided by the optimal cut-point value or tertiles (Supplementary Tables 3 and 4). Secondary parameters did not show statistically significant difference between two groups (Table 3).
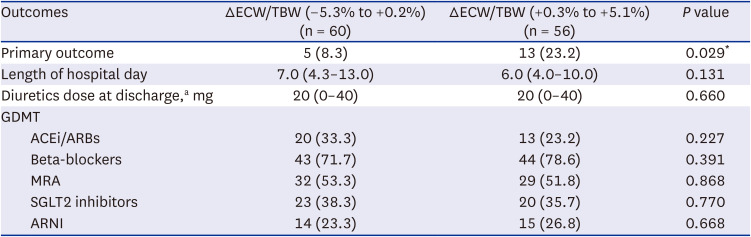
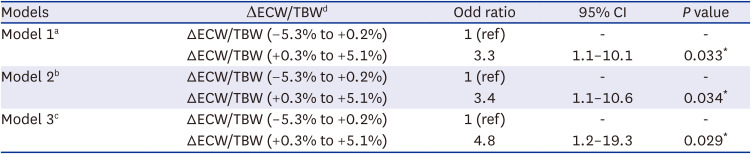
Table 3
Clinical outcomes according to ECW/TBW difference
HF patients were divided into two groups according to median value of ΔECW/TBW. Data are shown as median (interquartile range) or numbers (percentage).
ECW = extracellular water, TBW = total body water, GDMT = guideline-directed medical treatment, ACEi = angiotensin converting enzyme inhibitors, ARB = angiotensin receptor blocker, MRA = mineralocorticoid receptor antagonists, SGLT2 = sodium-glucose cortransporter-2, ARNI = angiotensin receptor neprilysin inhibitor.
aTo calculate the total daily diuretic dose upon discharge, torsemide diuretic doses were converted to furosemide-equivalent on the basis of 20 mg of torsemide is equivalent to 40 mg of furosemide. GDMT within 30days include ACEi or ARB, beta-blocker, MRA, SGLT-2 inhibitor, ARNI.
Statistically significant P values were marked with asterisks (*P < 0.05).
![]()
Table 4
ΔECW/TBW and risk of primary outcomes according to ΔECW/TBW median value
ECW = extracellular water, TBW = total body water, CI = confidence interval.
aUnadjusted.
bAdjusted for age and gender.
cAdjusted for age, gender, presence of hypertension, diabetes mellitus, and chronic kidney disease, history of revascularization, and body mass index.
dΔECW/TBW was divided into two groups according to the median value of ECW to TBW ratio difference.
Statistical significant P values were marked with asterisks (*P < 0.05).
![]()
Subgroup analysis (Fig. 3) was performed to evaluate homogenous results across the subgroup population. Although confidence interval was wide, the odds ratios in the subgroup analysis showed a homogeneity according to age, sex, BMI, diabetic status, LVEF, or diuretic use.
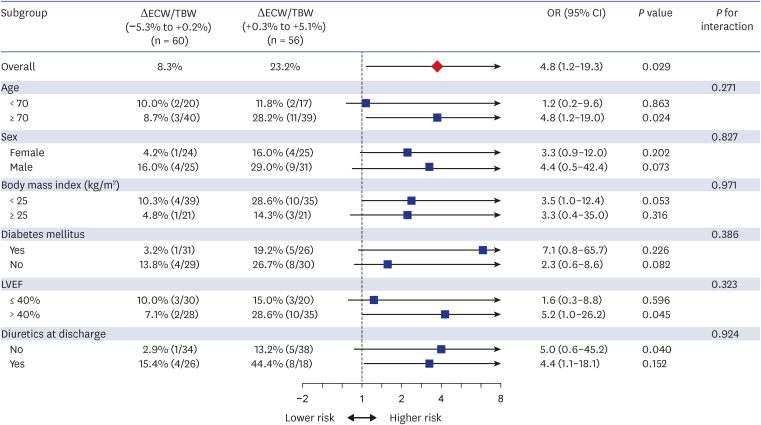
Fig. 3
ORs for the primary outcome (in-hospital mortality or rehospitalization) in subgroups according to the ΔECW/TBW during hospitalization. Subgroup analyses for the primary outcome. For subgroups that were defined according to age, gender, body mass index, diabetes status, LVEF, and the diuretic prescription at discharge were used for the interaction test.
ECW = extracellular water, TBW = total body water, OR = odds ratio, CI = confidence interval, LVEF = left ventricular ejection fraction.
![]()
DISCUSSION
In this study, we found that BIA is a noninvasive and effective method to evaluate the edema during hospitalization though the body water composition and the ratio of ECW to TBW (ECW/TBW) in patients hospitalized with acute HF. Volume related BIA indices showed statistically significant correlation with BMI and LV chamber sizes. Notably, the ECW/TBW showed a significant correlation with natriuretic peptide levels in hospitalized HF patients. This results suggest that the ECW/TBW may associated with severity or prognosis of HF.
Three previous studies have evaluated the prognostic implication of the ECW/TBW in HF patients. Liu et al.19 measured an edema index in 112 patients hospitalized with acute HF before discharge. A high predischarge edema index, defined as > 0.39, was significantly associated with HF rehospitalization, emergency department visits and death. Remarkably, a predischarge edema index provided superior prognostic value to a predischarge natriuretic peptide levels. In another study by Liu et al.,20 a predischarge edema index not only predicted higher 6-month event rates after acute HF hospitalization, but also an outpatient management strategy guided by serial edema index measurements improved patient outcomes. In contrast, a high edema index (> 0.39) was correlated with all-cause mortality and need for urgent transplantation in outpatients with chronic HF,21 however, once BNP and New York Heart Association (NYHA) functional class are accounted for, ECW/TBW was no longer an independent predictor of patient outcomes.
Natriuretic peptides (NPs) including BNP or NT-proBNP are widely known as one of the most powerful prognostic marker in patients with HF. However, test for NPs is an invasive diagnostic test using blood sample. Furthermore, test for NPs expensive, therefore, this test cannot repeatedly measure in hospitalization, emergency of department, or in outpatient settings. Our study did not demonstrate that the change in the ratio of ECW to TBW is superior to the change in NPs regarding predicting the severity or prognosis of patients with HF. However, through our current study, the change of ECW/TBW (ΔECW/TBW) between at the time of admission and at discharge during hospitalization showed a significant correlation with the primary outcome even adjusting clinical parameters. When the patients were divided into the two groups based on the median value of ΔECW/TBW, groups with a high and positive ECW to TBW ratio difference (ΔECW/TBW = +0.3% to +5.1%) showed significantly higher risk of the primary outcome by 4.8-folds compared to those with low and negative ECW to TBW ratio difference (ΔECW/TBW = −5.3% to +0.2%). To the best of our knowledge, this is the first study to demonstrate the feasibility and prognostic implication of serial follows up of the ECW/TBW with BIA in patients hospitalized with acute HF. BIA is a simple, safe, non-invasive, and relatively inexpensive test compared to test for NPs and considering the results of our study, BIA can provide its role not as a competitive modality to NPs, but as offering additional information. Although several studies reported prognostic value of the edema index (ECW/TBW) in patients with HF, only the change of edema index (ΔECW/TBW) showed an independent risk factor for primary outcome in our multivariate logistic regression analysis. The ΔECW/TBW is the meaningful value itself because it is not only a significant indicator of the patient's fluid retention status but also had a potential predictive value for the patient’s outcome. According to HF guidelines, diuretics are recommended to reduce symptoms of congestion in patients with HF.1314 However, the dosage and duration of treatment with diuretics or withdrawal of diuretics depends on the judgment of the clinician. Low dose and short duration of diuretic therapy or high dose and longer duration of diuretic therapy can lead to complications including fluid congestion, rehospitalization or renal impairment. Our study showed that the group with high and positive ECW to TBW ratio difference (ΔECW/TBW = +0.3% to +5.1%) showed a significantly higher risk of the primary outcome than those with a low and negative ECW to TBW ratio difference (ΔECW/TBW = −5.3% to +0.2%). This result was mainly driven by an increasing rehospitalization due to worsening of HF. Despite the rehospitalization rate was higher in the group with high and positive ECW to TBW ratio difference (ΔECW/TBW = +0.3% to +5.1%), there was no significant difference between the two groups in the dose of the prescribed diuretics at discharge in our study. This result suggests that the change of edema index (ΔECW/TBW) can be a good surrogate marker to guide clinicians to use an appropriate dose of diuretics for an appropriate period in patients with heart failure.
The cut-off value of ECW/TBW is still not established to determine overhydration or edema. The manufacturer of BIA equipment provides the cut-off point 0.400 for ECW/TBW to predict overhydration or edema. Though, in research it ranges from 0.371 to 0.400 depending on the hypothesis studied and the outcome selected. In this study, the optimal cut-off value of ΔECW/TBW for primary outcome was + 0.6%. This cut-off value suggests that when a HF patient is discharged from the hospital, if the volume status does not decrease compared to the time of admission, it associated with poor prognosis.
This study had several limitations. First, the BIA devices could not apply in electronic medical devices such as pacemaker, ICD or CRT according to manufacturer’s instructions. For this reason, HF patients with CIED were not eligible for BIA, and these patients, who may have relatively severe HF, were not included in this study. Second, this single center, retrospective, and observational study included a relatively small number of patients; therefore, an unmeasured bias could have influenced the results. Since this study was not a randomized controlled trial, there might be confounding factors influencing the finding of this study. Also, selection bias might have occurred in an observational study. However, to minimize selection bias, this study included subgroup analysis to exclude possible confounding factors. Third, the follow up duration of one month is relatively short to evaluate the diagnostic value of BIA parameters in HF patients. We hope to conduct clinical trials to confirm the diagnostic implication of BIA parameters, mostly edema indices as observed in this study. However, clinical trials of non-pharmacologic interventions are not easy due to limited financial support, which demands support from public organizations. Lastly, other patients’ factors than volume status might influence edema index. ECW/TBW was reported to be negatively associated with serum albumin and hemoglobin levels and duration of mechanical ventilation. Also, ECW/ICW was reported to be larger in healthy older subjects independent of sex, lean soft tissue, and fat mass. However, this study repetitively measured BIA and compared the change, thus minimizing the confounding effect of other clinical parameters.
In conclusion, BIA is a noninvasive and effective method to evaluate edema during hospitalization of HF patients. The change of the edema index (ΔECW/TBW) during hospitalization might be the surrogate marker to determine the adequacy of volume control. Failure to reducing edema during hospitalization was associated with poor outcome in patients with HF, suggesting the importance of effective volume control in acute HF patient care.
 XML Download