Journal List > J Korean Med Sci > v.38(28) > 1516083441

Hong, Park, Radnaabaatar, Kim, Kim, and Jung: The Impact of Entry Restrictions on the Spread of Severe Acute Respiratory Syndrome Coronavirus Variants Between 2021 and 2022

Abstract

To contain the surge of severe acute respiratory syndrome coronavirus 2 (SARS-CoV-2), the South Korean government has implemented non-pharmacological interventions as well as border restrictions. The efficacy of entry restrictions should be evaluated to facilitate their preparation for new variants of SARS-CoV-2. This study explored the impact of border policy changes on overseas entrants and local cases of SARS-CoV-2 variants. Data from the Korea Disease Control and Prevention Agency randomly collected between April 11, 2021 and August 20, 2022 were evaluated using the Granger causality model. The results showed that the outbreak gap of delta variants between international and domestic cases was 10 weeks, while that of omicron variants was approximately 2 weeks, meaning that the quarantine policy helped contain delta variants rather than more transmissible variants. It is recommended that countries implement quarantine policies based on particular purposes accounting for the specific features of different variants to avoid potential negative impacts on the economy.

Graphical Abstract

jkms-38-e223-abf001.jpg

Following the rapid spread of the novel infectious disease caused by severe acute respiratory syndrome coronavirus 2 (SARS-CoV-2) in China, the World Health Organization declared a global pandemic in March 2020.1 Governments have implemented various strategies to control the virus globally.2 However, globalization and human mobility have accelerated the spread of coronavirus disease 2019 (COVID-19) within a short period, which encourages strengthened border control and lockdowns.3 The South Korean government has conducted non-pharmacological interventions, including large-scale testing, contact tracing, mandatory self-isolation, and border control.4 Although the Korean government used non-pharmacological interventions, SARS-CoV-2 still spread among non-close contacts and evolved into other variants, including delta and omicron.5 Specifically, the omicron variant caused a worldwide resurgence of COVID-19 compared with the delta variant, regardless of vaccination status.6 Therefore, the Korean government has set quarantine guidelines for overseas arrivals in line with the COVID-19 pandemic.
Since February 4, 2020, a new entry procedure was introduced for all passengers entering South Korea from China and was gradually extended to include all international arrivals. Starting from April 1, 2020, a 14-day quarantine was required for all travelers entering Korea from the day after arrival.78 Subsequently, strict border measures were altered due to the administration of vaccines and spread of novel SARS-CoV-2 variants. For instance, entrants who were fully vaccinated in Korea were excluded from quarantine starting on May 5, 2021.9 Thereafter, the mandated 14-day quarantine was reduced to 10 days on November 1, 202110 and to 7 days on February 4, 2022.11 Since June 8, 2022, quarantine has not been required anymore, regardless of vaccination status. Since September 3, 2022, no passengers have been required to submit a negative polymerase chain reaction (PCR) or rapid antigen test result before arrival in Korea.12 To prepare for future pandemics, the efficacy of entry restrictions should be evaluated, particularly regarding new variants of SARS-CoV-2. This study explored the impact of border policy changes on overseas entrants and local cases of SARS-CoV-2 variants.
As shown in Fig. 1, since the outbreak of COVID-19 in January 2020, the Korea Disease Control and Prevention Agency has been continuously monitoring the genotype and variants of SARS-CoV-2 from the randomly collected nasopharyngeal- and oropharyngeal samples from patients with SARS-CoV-2 infection among the number of new weekly confirmed cases.13 The variant was identified using whole-genome sequencing, targeted sequencing of the spike protein, and a genotyping PCR test; subsequently, the results were categorized, and a rule-based decision algorithm detected the variants and mutations.
We applied the Granger causality approach to elucidate the associations of SARS-CoV-2 variants, including delta and omicron, between overseas entrants and national outbreaks. The Granger causality approach is a statistical hypothesis test for determining whether a single time series is a valuable tool for forecasting others.14 However, because of the autoregressive nature of the time series, we first applied it to test the stationarity of the time-varying variables. Therefore, if the model did not satisfy the stationary condition, a different technique before the Granger causality test was to be used. After pre-testing satisfied the stationary condition, we found that the entire time series data were the non-stationary. Thus, we used the differencing technique before the Granger causality test. The results of the pre-testing are shown in Supplementary Data 1.
To assess the associations between overseas entrants and national outbreaks of SARS-CoV-2 variants using this definition, we built the Granger causality models as follows:
Yt=j=1pΦjYtj+j=0pΘjXtj+εtjkms-38-e223-e001.jpg
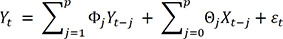
where Yt is the dependent variable at time t and Φj denotes an (N × N) matrix of autoregressive coefficients for j = 1,2,…, p. εt is a vector with Ω (N × N) symmetric definite matrix as the autoregressive zero-mean white-noise error terms. Xt = (X1t,…,Xwt)′ is a W-dimensional exogenous time series vector, and Θj denotes an (N × N) matrix of coefficients. The null hypothesis that a given variable, Y1t, has been reported to Granger-cause Y2t; however, Y2t does not Granger-cause Y1t, tested by calculating the F-statistic. If the F-statistic is significant, it is concluded that the time j lagged by the Y1t variable Granger-causes the Y2t variable. Specifically, the future value of Y2t depends on the present value of Y1t. Herein, we used the SARS-CoV-2 variants as explanatory variables in the Granger causality model. The sensitivity results are shown in Supplementary Data 2.
All statistical analyses were performed using the Granger test function from the “lmtest” package in R Statistical Software (version 4.2.0; R and R Studio Foundation for Statistical Computing, Vienna, Austria).
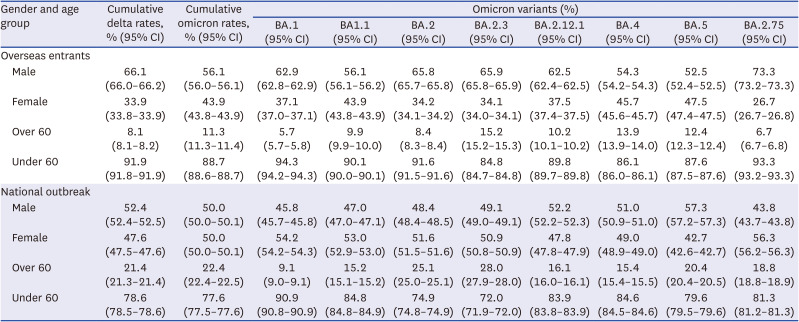
Table 1 shows the randomly selected weekly statistics of the cumulative Delta and Omicron rates in South Korea between April 16, 2021, and August 3, 2022.
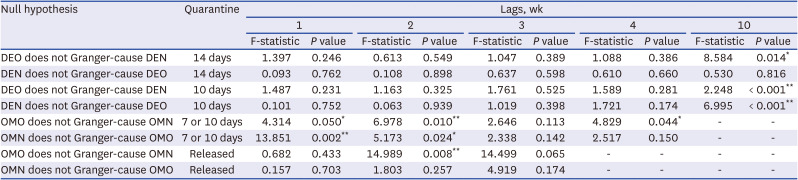
Tables 2 and 3 shows the results of the Granger causality tests. Panel A classifies the null hypothesis based on the quarantine period and shows that the delta virus from overseas entrants (DEO) and national outbreaks when 14 days of quarantine were mandated existed in a one-way causal direction that examines the new confirmed cases of DEO predicting the new confirmed cases of delta virus in national outbreaks (DEN) in the future. We conducted a Granger causality test on 10 different lags. We found that the value of DEO is valuable for forecasting the future value of DEN. However, when the Granger causality test was performed in reverse, the results showed that DEN’s value does not forecast DEO’s future value.
Furthermore, Table 2 demonstrates the association between the omicron virus from overseas entrants (OMO) and national outbreaks when 7, 10 days, and no days of quarantine were mandated. In 7 or 10 days of quarantine, there was a bidirectional association between overseas entrants and national outbreaks. There was a one-way association that examined the value of OMO to predict the future value of omicron virus in national outbreaks (OMN) using two different lags (P = 0.008), meaning that the value of OMO is helpful for forecasting the future value of OMN.
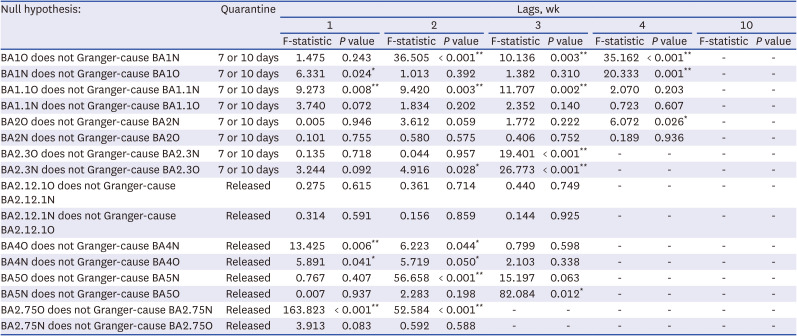
Table 3 shows the results of the omicron sub-variants based on quarantine. Some omicron sub-variants, including BA1.1 and BA2.75, were significant in forecasting the future value of national outbreaks. However, since the observation period of omicron sub-variants was only 6 weeks, it was insufficient to examine the Granger causality test. The models may include a low power issue, resulting in increased variance for estimation.
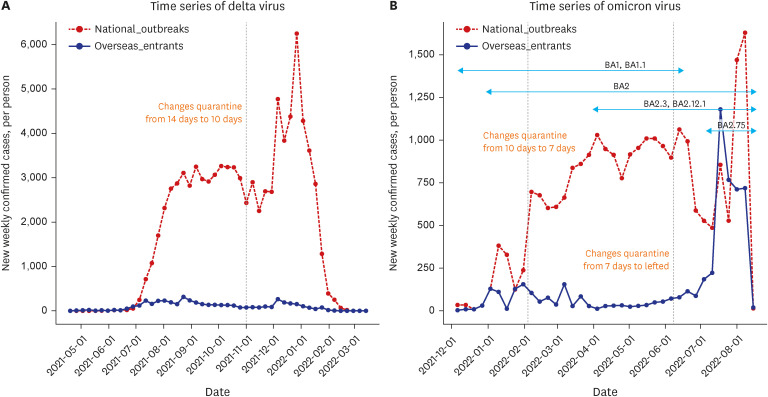
Fig. 1A shows a time series of the delta virus, including overseas entrants and national outbreaks, as the quarantine time mandated changed from 14 to 10 days. Fig. 1B illustrates a time series of the Omicron virus, including sub-variants, among overseas entrants and national outbreaks as the quarantine time mandated changed from 10 to 7 days and from 7 to no days.
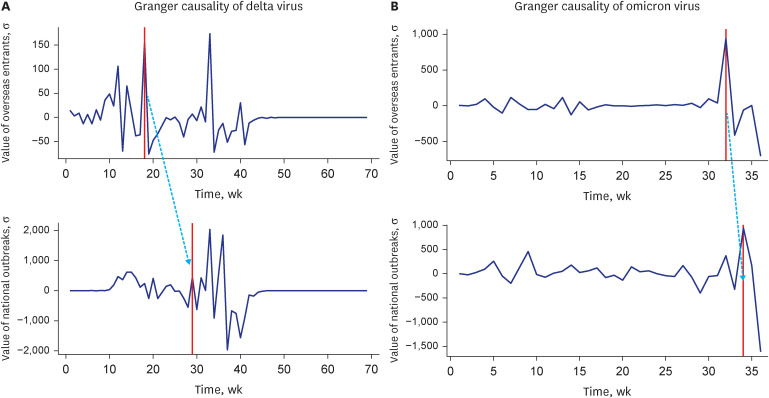
Fig. 2A shows the results of the Granger causality test for the delta virus between overseas entrants and national outbreaks with 14 days of quarantine. The pattern in overseas entrants approximately happened in national outbreaks after 10 lag weeks. Overseas entrants peaked at approximately 18 weeks, and national outbreaks peaked at approximately 28 weeks. The dotted blue line indicates the gap between overseas entrants and national outbreaks. Thus, the overseas entrants’ value of the past 10 weeks can be used to predict the future value of national outbreaks. Fig. 2B illustrates the results of the Granger causality test for the omicron virus between overseas entrants and national outbreaks after the quarantine was lifted. The pattern in overseas entrants approximately happened in national outbreaks after 2 lag weeks. Overseas entrants and national outbreaks peaked at approximately 32 and 34 weeks, respectively. Therefore, the value of overseas entrants in the past 2 weeks can be used to predict the future value of national outbreaks.
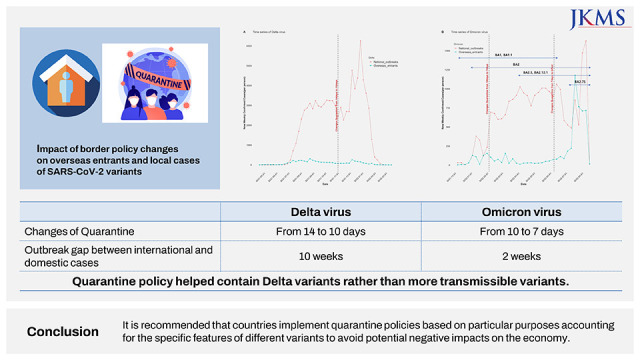
According to our findings, the outbreak gap between international and domestic cases was estimated to be 10 and 2 weeks for delta and omicron variants, respectively, meaning that the quarantine policy successfully delayed the risk of local transmission from incoming travelers for delta variants. Quarantine duration is typically set to prevent post-quarantine transmission with or without testing.15 However, travel quarantine does not fully contain local infections without severe domestic controls before a sufficient vaccination rate.16 Particularly, the quarantine policy during delta variants may be effective due to vaccine-induced herd immunity,17 lower remission rates than omicron variants,18 and adherence to social distancing schemes.8 Conversely, the rate of local cases was not different from that of imported cases during the surge of omicron variants. Regarding the lifted quarantine policy during omicron variants, our findings suggest that border restrictions cannot play an important role in preventing imported cases of new variants. The reduced outbreak gap for the omicron variant could have been due to the reduced effectiveness of vaccines against the omicron variant compared to the Delta variant,19 increased transmission rates, which are noted by many countries,16 or increased mobility,20 since the government announced a post-pandemic strategy with gradual mitigation of social distancing in November 2021.
This study had some limitations. First, the Granger causality approach does not directly evaluate the relationship between variables; depending on the lag lengths of variables, results may be changed or true causality may not be accurately measured. Thus, the Granger causality approach is close to the association between variables. Second, since this study focused on delta and omicron virus era for the impact of entry restriction policy, it excluded the 1st through the 3rd wave of COVID-19 in South Korea, which cannot determine the potential super-spreading of SARS-CoV-2. However, despite these limitations, we evaluated the impact of the quarantine policy using a time-series analysis and provided the effectiveness of the quarantine policy decreases over time.
In conclusion, the quarantine policy for delta variants helped contain the virus but may not be effective for more transmissible variants. Therefore, it is recommended that countries implement quarantine policies based on particular purposes accounting for the specific features of different variants to avoid potential negative impacts on the economy and distortion of global mobility.

Ethics statement

We used open data sources that are publicly available. Thus, approval from the Institutional Review Board and participant consent were not required. All procedures were carried out according to the tenets of the Declaration of Helsinki.

Notes

Funding: This study was supported in part by the MSIT (Ministry of Science and ICT), Korea, under the “AI Convergence New Infectious Disease Response System” supervised by the NIPA (National IT Industry Promotion Agency), and National Research Foundation of Korea grant funded by the Korean government (NRF- 2021R1C1C101177411 and NRF-2021R1A5A2030333). It was also supported by a grant of the project for Infectious Disease Medical Safety, funded by the Ministry of Health & Welfare, Republic of Korea (grant number: HG22C0094). The funder of the study had no role in the study design, data collection, data analysis, data interpretation, or writing of the report.

Disclosure: The authors have no potential conflicts of interest to disclose.

Data Availability Statement: Data is available from the Korea Disease Control and Prevention Agency.

Author Contributions:

  • Conceptualization: Kim DW, Jung J.

  • Data curation: Hong J, Park AK, Kim EJ.

  • Formal analysis: Hong J.

  • Methodology: Hong J, Park AK, Jung J.

  • Writing - original draft: Hong J, Park AK, Radnaabaatar M.

  • Writing - review & editing: all authors.

References

1. Lee Y, Kim M, Oh K, Kang E, Rhie YJ, Lee J, et al. Comparison of initial presentation of pediatric diabetes before and during the coronavirus disease 2019 pandemic era. J Korean Med Sci. 2022; 37(22):e176. PMID: 35668686.
2. Jo Y, Shrestha S, Radnaabaatar M, Park H, Jung J. Optimal social distancing policy for COVID-19 control in Korea: a model-based analysis. J Korean Med Sci. 2022; 37(23):e189. PMID: 35698839.
3. Lee H, Kim Y, Kim E, Lee S. Risk assessment of importation and local transmission of COVID-19 in South Korea: statistical modeling approach. JMIR Public Health Surveill. 2021; 7(6):e26784. PMID: 33819165.
4. Jung J. Preparing for the coronavirus disease (COVID-19) vaccination: evidence, plans, and implications. J Korean Med Sci. 2021; 36(7):e59. PMID: 33619920.
5. Jung J, Lee J, Kim E, Namgung S, Kim Y, Yun M, et al. Frequent occurrence of SARS-CoV-2 transmission among non-close contacts exposed to COVID-19 patients. J Korean Med Sci. 2021; 36(33):e233. PMID: 34427062.
6. Kim YC, Kim B, Son NH, Heo N, Nam Y, Shin A, et al. Vaccine effect on household transmission of omicron and delta SARS-CoV-2 variants. J Korean Med Sci. 2023; 38(1):e9. PMID: 36593690.
7. Korea Disease Control and Prevention Agency. Press release. (3.30) Regular briefing of central disaster and safety countermeasure headquarters on COVID-19. Updated March 31, 2020. Accessed November 30, 2022. https://ncov.kdca.go.kr/en/tcmBoardView.do?brdId=12&brdGubun=125&dataGubun=&ncvContSeq=353828&contSeq=353828&board_id=1365&gubun= .
8. Chen H, Shi L, Zhang Y, Wang X, Sun G. A cross-country core strategy comparison in China, Japan, Singapore and South Korea during the early COVID-19 pandemic. Global Health. 2021; 17(1):22. PMID: 33618688.
9. Embassy of the Republic of Korea in the USA. New Entry/Quarantine Procedures for Individuals who Completed COVID-19 Vaccination in Korea. Updated 2021. Accessed Accessed June 12, 2023. https://overseas.mofa.go.kr/us-en/brd/m_4500/view.do?seq=761013&srchFr=&srchTo=&srchWord=&srchTp=&multi_itm_seq=0&itm_seq_1=0&itm_seq_2=0&company_cd=&company_nm=&page=1 .
10. Korea Disease Control and Prevention Agency. Guidance on shortening the quarantine and manual surveillance period for contacts and overseas arrivals. Updated November 1, 2021. Accessed November 30, 2022. http://nqs.kdca.go.kr/nqs/quaStation/busan.do?gubun=notice&fromMainYn=Y&ctx=PS1&contentid=221854 .
11. Korea Disease Control and Prevention Agency. Omicron mutation-related changes in quarantine measures for overseas arrivals. Updated February 3, 2022. Accessed November 30, 2022. http://nqs.kdca.go.kr/nqs/quaStation/gimhae.do?gubun=notice&fromMainYn=Y&ctx=BB1&contentid=226274 .
12. Korea Disease Control and Prevention Agency. Notice of suspension of pre-entry inspection for overseas arrivals. Updated Aug 31, 2022. Accessed December 2, 2022. https://www.kdca.go.kr/board.es?mid=a20504000000&bid=0014&nPage=2 .
13. Kim IH, Park AK, Kim JM, Kim HM, Lee NJ, Woo SH, et al. COVID-19 variant surveillance in the Republic of Korea. Public Health Wkly Rep. 2021; 14(16):922–929.
14. Granger CW. Investigating causal relations by econometric models and cross-spectral methods. Econometrica. 1969; 37(3):424–438.
15. Wells CR, Pandey A, Fitzpatrick MC, Crystal WS, Singer BH, Moghadas SM, et al. Quarantine and testing strategies to ameliorate transmission due to travel during the COVID-19 pandemic: a modelling study. Lancet Reg Health Eur. 2022; 14:100304. PMID: 35036981.
16. Kucharski AJ, Jit M, Logan JG, Cotten M, Clifford S, Quilty BJ, et al. Travel measures in the SARS-CoV-2 variant era need clear objectives. Lancet. 2022; 399(10333):1367–1369. PMID: 35247312.
17. Kwon SL, Oh J. COVID-19 vaccination program in South Korea: a long journey toward a new normal. Health Policy Technol. 2022; 11(2):100601. PMID: 35127400.
18. Jalali N, Brustad HK, Frigessi A, MacDonald EA, Meijerink H, Feruglio SL, et al. Increased household transmission and immune escape of the SARS-CoV-2 omicron compared to delta variants. Nat Commun. 2022; 13(1):5706. PMID: 36175424.
19. Andrews N, Stowe J, Kirsebom F, Toffa S, Rickeard T, Gallagher E, et al. COVID-19 vaccine effectiveness against the omicron (B.1.1.529) variant. N Engl J Med. 2022; 386(16):1532–1546. PMID: 35249272.
20. Central Disease Control Headquarters. Press release. South Korea announces the roadmap for gradual return to normal (10.29). Updated October 29, 2021. Accessed December 1, 2022. https://ncov.kdca.go.kr/en/tcmBoardView.do?brdId=12&brdGubun=125&dataGubun=&ncvContSeq=368308&contSeq=368308&board_id=1365&gubun= .

SUPPLEMENTARY MATERIALS

Supplementary Data 1

Pre-testing of stationarity
jkms-38-e223-s001.doc

Supplementary Data 2

Sensitivity analysis
jkms-38-e223-s002.doc
Fig. 1

Time series of the SARS-CoV-2 variant. (A) Delta. (B) Omicron.

SARS-CoV-2 = severe acute respiratory syndrome coronavirus 2.
jkms-38-e223-g001
Fig. 2

Granger causality test in the SARS-CoV-2 variant. (A) Delta. (B) Omicron.

SARS-CoV-2 = severe acute respiratory syndrome coronavirus 2.
jkms-38-e223-g002
Table 1

Summary weekly statistics for the delta and omicron virus rates, including variants in South Korea from April 16, 2021, to August 3, 2022

jkms-38-e223-i001
Gender and age group Cumulative delta rates, % (95% CI) Cumulative omicron rates, % (95% CI) Omicron variants (%)
BA.1 (95% CI) BA1.1 (95% CI) BA.2 (95% CI) BA.2.3 (95% CI) BA.2.12.1 (95% CI) BA.4 (95% CI) BA.5 (95% CI) BA.2.75 (95% CI)
Overseas entrants
Male 66.1 (66.0–66.2) 56.1 (56.0–56.1) 62.9 (62.8–62.9) 56.1 (56.1–56.2) 65.8 (65.7–65.8) 65.9 (65.8–65.9) 62.5 (62.4–62.5) 54.3 (54.2–54.3) 52.5 (52.4–52.5) 73.3 (73.2–73.3)
Female 33.9 (33.8–33.9) 43.9 (43.8–43.9) 37.1 (37.0–37.1) 43.9 (43.8–43.9) 34.2 (34.1–34.2) 34.1 (34.0–34.1) 37.5 (37.4–37.5) 45.7 (45.6–45.7) 47.5 (47.4–47.5) 26.7 (26.7–26.8)
Over 60 8.1 (8.1–8.2) 11.3 (11.3–11.4) 5.7 (5.7–5.8) 9.9 (9.9–10.0) 8.4 (8.3–8.4) 15.2 (15.2–15.3) 10.2 (10.1–10.2) 13.9 (13.9–14.0) 12.4 (12.3–12.4) 6.7 (6.7–6.8)
Under 60 91.9 (91.8–91.9) 88.7 (88.6–88.7) 94.3 (94.2–94.3) 90.1 (90.0–90.1) 91.6 (91.5–91.6) 84.8 (84.7–84.8) 89.8 (89.7–89.8) 86.1 (86.0–86.1) 87.6 (87.5–87.6) 93.3 (93.2–93.3)
National outbreak
Male 52.4 (52.4–52.5) 50.0 (50.0–50.1) 45.8 (45.7–45.8) 47.0 (47.0–47.1) 48.4 (48.4–48.5) 49.1 (49.0–49.1) 52.2 (52.2–52.3) 51.0 (50.9–51.0) 57.3 (57.2–57.3) 43.8 (43.7–43.8)
Female 47.6 (47.5–47.6) 50.0 (50.0–50.1) 54.2 (54.2–54.3) 53.0 (52.9–53.0) 51.6 (51.5–51.6) 50.9 (50.8–50.9) 47.8 (47.8–47.9) 49.0 (48.9–49.0) 42.7 (42.6–42.7) 56.3 (56.2–56.3)
Over 60 21.4 (21.3–21.4) 22.4 (22.4–22.5) 9.1 (9.0–9.1) 15.2 (15.1–15.2) 25.1 (25.0–25.1) 28.0 (27.9–28.0) 16.1 (16.0–16.1) 15.4 (15.4–15.5) 20.4 (20.4–20.5) 18.8 (18.8–18.9)
Under 60 78.6 (78.5–78.6) 77.6 (77.5–77.6) 90.9 (90.8–90.9) 84.8 (84.8–84.9) 74.9 (74.8–74.9) 72.0 (71.9–72.0) 83.9 (83.8–83.9) 84.6 (84.5–84.6) 79.6 (79.5–79.6) 81.3 (81.2–81.3)
CI = confidence interval.
Table 2

Granger causality test results for delta and omicron variants

jkms-38-e223-i002
Null hypothesis Quarantine Lags, wk
1 2 3 4 10
F-statistic P value F-statistic P value F-statistic P value F-statistic P value F-statistic P value
DEO does not Granger-cause DEN 14 days 1.397 0.246 0.613 0.549 1.047 0.389 1.088 0.386 8.584 0.014*
DEN does not Granger-cause DEO 14 days 0.093 0.762 0.108 0.898 0.637 0.598 0.610 0.660 0.530 0.816
DEO does not Granger-cause DEN 10 days 1.487 0.231 1.163 0.325 1.761 0.525 1.589 0.281 2.248 < 0.001**
DEN does not Granger-cause DEO 10 days 0.101 0.752 0.063 0.939 1.019 0.398 1.721 0.174 6.995 < 0.001**
OMO does not Granger-cause OMN 7 or 10 days 4.314 0.050* 6.978 0.010** 2.646 0.113 4.829 0.044* - -
OMN does not Granger-cause OMO 7 or 10 days 13.851 0.002** 5.173 0.024* 2.338 0.142 2.517 0.150 - -
OMO does not Granger-cause OMN Released 0.682 0.433 14.989 0.008** 14.499 0.065 - - - -
OMN does not Granger-cause OMO Released 0.157 0.703 1.803 0.257 4.919 0.174 - - - -
DEO = delta virus from overseas entrants, DEN = delta virus national outbreaks, OMO = omicron virus from overseas entrants, OMN = omicron virus in national outbreaks.
*Indicates significance at P < 0.05; **Indicates significance at P < 0.01.
Table 3

Granger causality test results for omicron sub-variants

jkms-38-e223-i003
Null hypothesis: Quarantine Lags, wk
1 2 3 4 10
F-statistic P value F-statistic P value F-statistic P value F-statistic P value F-statistic P value
BA1O does not Granger-cause BA1N 7 or 10 days 1.475 0.243 36.505 < 0.001** 10.136 0.003** 35.162 < 0.001** - -
BA1N does not Granger-cause BA1O 7 or 10 days 6.331 0.024* 1.013 0.392 1.382 0.310 20.333 0.001** - -
BA1.1O does not Granger-cause BA1.1N 7 or 10 days 9.273 0.008** 9.420 0.003** 11.707 0.002** 2.070 0.203 - -
BA1.1N does not Granger-cause BA1.1O 7 or 10 days 3.740 0.072 1.834 0.202 2.352 0.140 0.723 0.607 - -
BA2O does not Granger-cause BA2N 7 or 10 days 0.005 0.946 3.612 0.059 1.772 0.222 6.072 0.026* - -
BA2N does not Granger-cause BA2O 7 or 10 days 0.101 0.755 0.580 0.575 0.406 0.752 0.189 0.936 - -
BA2.3O does not Granger-cause BA2.3N 7 or 10 days 0.135 0.718 0.044 0.957 19.401 < 0.001** - - - -
BA2.3N does not Granger-cause BA2.3O 7 or 10 days 3.244 0.092 4.916 0.028* 26.773 < 0.001** - - - -
BA2.12.1O does not Granger-cause BA2.12.1N Released 0.275 0.615 0.361 0.714 0.440 0.749 - - - -
BA2.12.1N does not Granger-cause BA2.12.1O Released 0.314 0.591 0.156 0.859 0.144 0.925 - - - -
BA4O does not Granger-cause BA4N Released 13.425 0.006** 6.223 0.044* 0.799 0.598 - - - -
BA4N does not Granger-cause BA4O Released 5.891 0.041* 5.719 0.050* 2.103 0.338 - - - -
BA5O does not Granger-cause BA5N Released 0.767 0.407 56.658 < 0.001** 15.197 0.063 - - - -
BA5N does not Granger-cause BA5O Released 0.007 0.937 2.283 0.198 82.084 0.012* - - - -
BA2.75O does not Granger-cause BA2.75N Released 163.823 < 0.001** 52.584 < 0.001** - - - - - -
BA2.75N does not Granger-cause BA2.75O Released 3.913 0.083 0.592 0.588 - - - - - -
BA1O = omicron sub-variants (BA.1) from overseas entrants, BA1N = omicron sub-variants (BA.1) in national outbreaks, BA1.1O = omicron sub-variants (BA.1.1) from overseas entrants, BA1.1N = omicron sub-variants (BA.1.1) in national outbreaks, BA2O = omicron sub-variants (BA.2) from overseas entrants, BA2N = omicron sub-variants (BA.2) in national outbreaks, BA2.3O = omicron sub-variants (BA.2.3) from overseas entrants, BA2.3N = omicron sub-variants (BA.2.3) in national outbreaks, BA2.12.1O = omicron sub-variants (BA.2.12.1) from overseas entrants, BA2.12.1N = omicron sub-variants (BA.2.12.1) in national outbreaks, BA4O = omicron sub-variants (BA.4) from overseas entrants, BA4N = omicron sub-variants (BA.4) in national outbreaks, BA5O = omicron sub-variants (BA.5) from overseas entrants, BA5N = omicron sub-variants (BA.5) in national outbreaks, BA2.75O = omicron sub-variants (BA.2.75) from overseas entrants, BA2.75N = omicron sub-variants (BA.2.75) in national outbreaks.
*Indicates significance at P < 0.05; **Indicates significance at P < 0.01.
TOOLS
Similar articles