

 PDF
PDF Citation
 Print
Print


INTRODUCTION
Frailty is a common and important geriatric condition1 that is associated with an increased risk of falling, hospitalization, and mortality.234 It is characterized by a decline in physical and cognitive function and is often accompanied by social isolation and a reduced ability to perform activities of daily living.5678 Frailty is more common in the very old (85 or older) group than in younger people,9 and the frailty index, which is calculated using the accumulation of deficit model,10 is also known to be positively associated with age.11 While traditionally, frailty was thought to be self-aggravating,5 recent evidence suggest that the progression of frailty can be reversed or prevented through appropriate interventions such as nutritional support, exercise, or a multidimensional approach.121314
In South Korea, the population is rapidly aging,15 and the prevalence of older adults with functional impairment has been ever-increasing. The proportion of long-term care insurance recipients has been increasing in the total Korean population, from 1.0% in 2016 to 1.3% in 2018, according to the 2019 Long-Term Care Status Survey.16 The prevalence of frailty in older Korean people ranged from 2.5% to 55.7%, depending on the instruments and study settings.15 Understanding the trend of frailty in older South Koreans is important for creating policies that address consequences and prepare for population aging, as frailty often leads to disability. This requires a comprehensive understanding of frailty trends nationwide.17
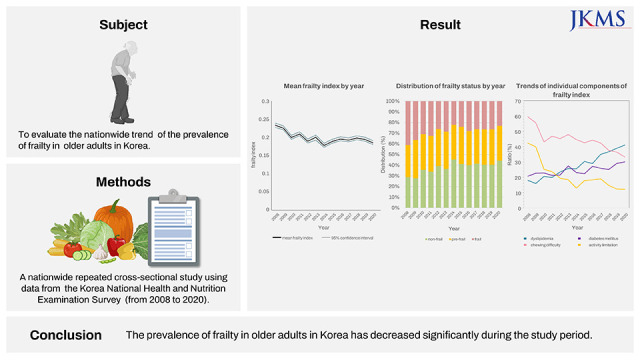
Studies on the nationwide trends of frailty are relatively scarce,18 and no study focused on the change in frailty prevalence over time in a sample which can represent the Korean nationwide population. The purpose of this study was to examine the prevalence of frailty and the factors associated with it in a nationwide sample of older individuals in South Korea, using data from the Korea National Health and Nutrition Examination Survey (KNHANES) conducted from 2008 to 2020 and with a frailty index using 30 items commonly surveyed in KNHANES.
METHODS
Study population
This repeated cross-sectional study was based on KNHANES data (2008–2020). This survey has been conducted periodically since 1998 to assess the health and nutritional status of nationwide Korean population, to monitor trends in health risk factors and the prevalence of major chronic diseases, and to provide data for the development and evaluation of health policies and programs in Korea.19 The KNHANES is a nationally representative survey that uses a complex, multi-stage probability sample design to represent the total non-institutionalized population of Korea. The survey is conducted annually using a three-stage sample design. The primary sample units (PSUs) are selected from census blocks or resident registration addresses, consisting of approximately 50–60 households each. The selection of households for the survey is done through field survey, where 20–25 households are chosen from each PSU. Finally, all members aged 1 year and over from selected households are included in the survey.20
Evaluation of frailty-related factors
Information about household income, level of education, and lifestyle factors was derived from a self-reported questionnaire. Smokers were defined as those who smoked five or more packs of cigarettes in their lifetime and were currently smoking. In the survey, participants were considered to have a particular disease if they reported being diagnosed with it by a doctor. Chewing difficulty and daily activity limitation were assessed using questionnaires. Participants who answered the question “do you have difficulty chewing food because of problems with teeth or the mouth?” with “very difficult” or “difficult” were considered to have difficulties in chewing. In addition, participants who answered the question “are you limited in social activities because of your health problems?” with “yes” were considered to have limitations in their social activities. Blood pressure was measured on the right arm, by trained nurses, using a mercury sphygmomanometer (Baumanometer® Wall Unit 33(0850); W.A.Baum, Copiague, NY, USA) with an appropriately sized cuff after participants remained still for at least 5 minutes in a sitting posture. In 2020, the sphygmomanometer was changed to a non-mercury sphygmomanometer (Greenlight 300TM; Accoson, Irvine, UK), but the measured value was used without a conversion formula because the blood pressure difference with the existing sphygmomanometer was within the error range.2223 Blood samples were collected from the participants during the survey. Body mass index (BMI) was calculated by dividing body weight (kg) by height2 (m2).
Frailty index
We developed the frailty index by referring to a standard procedure for creating a frailty index24 and a previous frailty index using the KNHANES data.2325 The frailty index, calculated as a ratio of deficits present out of the total number of possible deficits, is given a continuous score from 0 (best) to 1 (worst).26
The frailty index in this study was composed of 30 items commonly surveyed from 2008 to 2020 in KNHANES. The items used to calculate the index value included comorbidities, functional abilities, signs and symptoms, and laboratory test values. Comorbidities included bronchial asthma, hypertension, diabetes, dyslipidemia, cardiovascular disease, stroke, arthritis, anemia, and depression. Functional abilities consisted of low exercise capacity, limitations in activities of daily living, social activity, self-care ability, and chewing difficulty. Signs and symptoms consisted of pain or discomfort, weight loss, depression or anxiety, and stress. Laboratory values consisted of systolic and diastolic blood pressure, heart rate regularity, hemoglobin, blood urea nitrogen, creatinine, total cholesterol, high-density lipoprotein-cholesterol, fasting glucose, and urine protein. Additional items included current smoking state and BMI (Supplementary Table 1).
Statistical analysis
In this study, a complex sample analysis method with assigned weights was used to obtain national-level statistical estimates. It is a pooled analysis of all yearly surveys and the annual survey samples are independent of each other. Continuous and discrete variables were compared using a general linear model and crosstabs analysis, respectively. A multinomial logistic regression analysis was performed to identify factors associated with frailty status (pre-frail and frail). The odds ratios and 95% confidence intervals (CIs) were confirmed. Additionally, a time variable (years) was added to the factor analysis associated with frailty index to confirm the time trend in frailty with general linear model analysis. All statistical analyses were two-tailed, and statistical significance was set at P < 0.05. All statistical analyses were performed using SPSS version 21.0 (IBM Corporation, Armonk, NY, USA).
Ethics statement
All participants provided written informed consent prior to participating in KNHANES. Personal data from the survey were de-identified before being made publicly available. This study was approved by the Institutional Review Board (IRB) of Chonnam National University Bitgoeul Hospital and the requirement for informed consent was waived (IRB No. CNUBH-2023-005). The study was performed in accordance with the principles of the Declaration of Helsinki.
RESULTS
Demographic and clinical characteristics of the study population
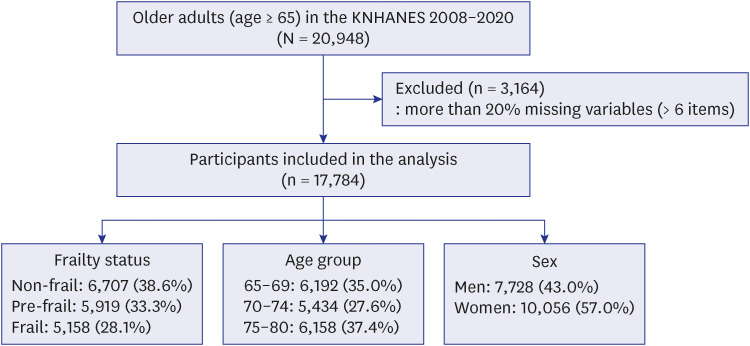
The study included a total of 17,784 older individuals aged 65 or older who participated in KNHANES from 2008 to 2020. Demographic and clinical parameters of the study population are shown in Table 1 and Supplementary Table 2. The mean age of the study population was 72.4 (standard error 0.1) years, and 57.0% were female. Among the study population, 24.6% had at least a high school education, and 11.3% were current smokers. The mean BMI of the study population was 24.0 kg/m2, and 35.8% were classified as obese (BMI ≥ 25 kg/m2). In the total population, the mean frailty index was 0.20 (95% CI, 0.19, 0.20). Frailty index was higher (P < 0.001) in women (0.21; 95% CI, 0.21, 0.22) than in men (0.17; 95% CI, 0.17, 0.18). Prevalence of frailty and prefrailty was 28.1%, 33.3% in the total population, 20.6%, 32.1% in men, and 33.8%, 34.2% in women.
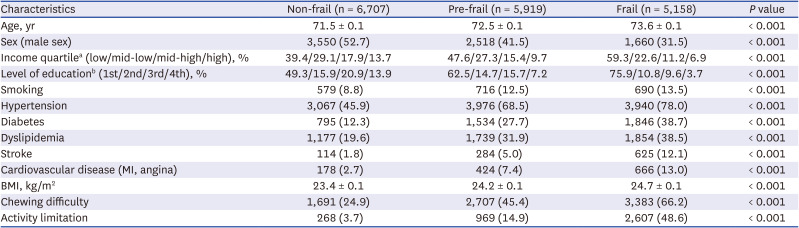
Table 1
General characteristics of the study participants according to frailty status
Values are presented as mean ± standard error or number (%). Continuous variables (age, BMI) were compared using general linear model analysis in a complex sample analysis method. Discrete variables (sex, income quartile, level of education, smoking, hypertension, diabetes, dyslipidemia, stroke, cardiovascular disease, difficulty chewing, social activity limitation) were compared using crosstabs analysis in a complex sample analysis method.
MI = myocardial infarction, BMI = body mass index.
aIncome quartile: household income/month, low: household income/month < 790 US dollars, mid-low: 790 US dollars ≤ household income/month < 1,580 US dollars, mid-high: 1,580 US dollars ≤ household income/month < 2,370 US dollars, high: household income/month ≥ 2,370 US dollars.
bLevel of education: 1st: elementary school or lower, 2nd: middle school, 3rd: high school, 4th: college or higher.
![]()
Time trends in frailty prevalence
The frailty index of the study population significantly decreased from 2008 to 2020 (P < 0.001, Fig. 2, Table 2). Decrement in the frailty index was observed in all age groups of 65–69, 70–74, and 75–80 (Supplementary Fig. 1). There was a statistically significant change in the prevalence of frailty from 2008 to 2020 (P < 0.001, Supplementary Table 2). The prevalence of frailty decreased from 41.1% in 2008 to 23.1% in 2020 (Fig. 3). In addition, the survey year was significantly associated with the frailty status after adjusting for age, sex, and demographic factors (Table 3).
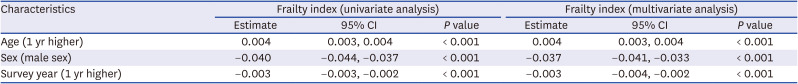
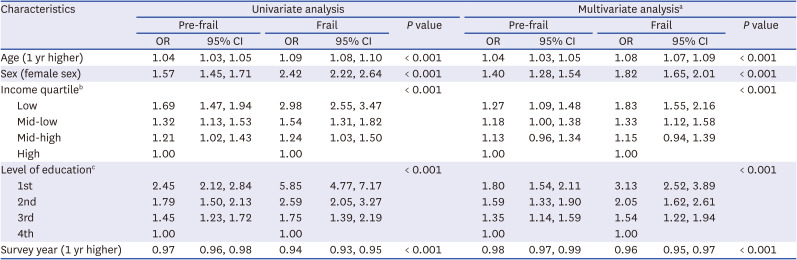
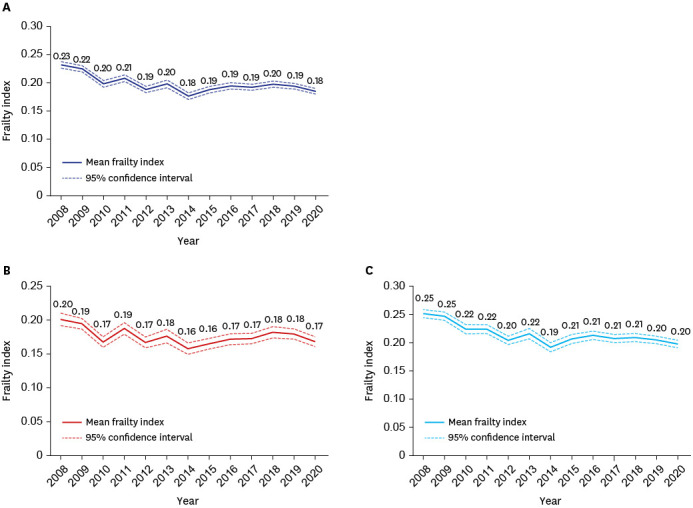
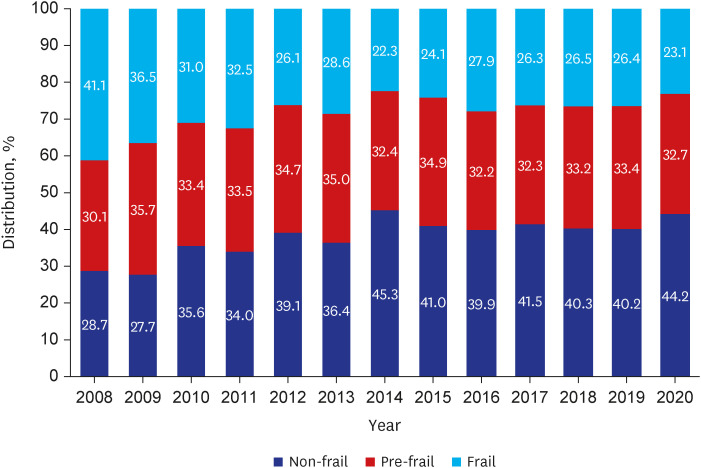
Table 2
Analysis of factors associated with frailty index
General linear model analysis was performed to identify factors associated with frailty index.
CI = confidence interval.
![]()
Table 3
Analysis of the association between survey year and frailty status after adjusting for demographic factors
Logistic regression analysis was performed to identify factors associated with frailty status.
CI = confidence interval, OR = odds ratio.
aAll variables in the univariate analysis were entered in this multivariate analysis.
bIncome quartile: household income/month, low: household income/month < 790 US dollars, mid-low: 790 US dollars ≤ household income/month < 1,580 US dollars, mid-high: 1,580 US dollars ≤ household income/month < 2,370 US dollars, high: household income/month ≥ 2,370 US dollars.
cLevel of education: 1st: elementary school or lower, 2nd: middle school, 3rd: high school, 4th: college or higher.
![]()
Trends of individual components of the frailty index
Among frailty index variables significantly associated with frailty status (Table 4), the prevalence of dyslipidemia (17.9% in 2008 and 40.9% in 2020), diabetes mellitus (20.6% in 2008 and 30.0% in 2020), and cardiovascular disease (5.6% in 2008 and 9.3% in 2020) increased (Fig. 4A). In contrast, the prevalence of chewing difficulty (59.4% in 2008 and 33.1% in 2020), activity limitation (42.2% in 2008 and 12.0% in 2020), and smoking (17.0% in 2008 and 9.3% in 2020) decreased over the study period (Fig. 4B). Significant improvements in the quality-of-life score indicators by the EuroQoL variables were observed.
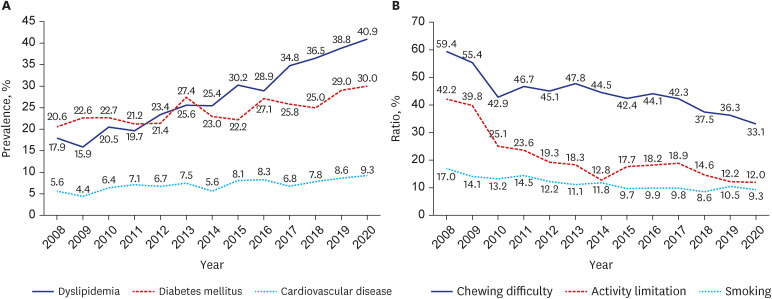
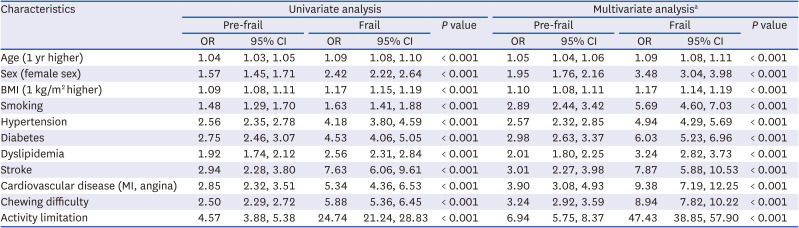
Fig. 4
Trends of individual components of frailty index. (A) Dyslipidemia, diabetes mellitus, and cardiovascular disease. (B) Chewing difficulty, activity limitation, smoking.
![]()
Table 4
Factors associated with frailty status
Logistic regression analysis was performed to identify factors associated with frailty status.
MI = myocardial infarction, BMI = body mass index, CI = confidence interval, OR = odds ratio.
aAll variables in the univariate analysis were entered in this multivariate analysis.
![]()
DISCUSSION
From the cross-sectional observation of nationwide Korean older adults, our study indicates that the prevalence of frailty in older adults in South Korea decreased significantly from 2008 to 2020, and there was a decrease observed in all age groups of 65–69, 70–74, and 75–80 according to the frailty index. As for components of the frailty index, we found that certain comorbidities, such as dyslipidemia, diabetes mellitus, and cardiovascular disease, have increased over time, while functional abilities, such as chewing difficulty, activity limitation, and smoking, have decreased. To our knowledge, this study is the first in Korea to evaluate the nationwide trend of the prevalence of frailty. This study’s findings provide important information for public health policy in South Korea, where the population is rapidly aging and the prevalence of frailty in older adults is increasing.
Research on frailty trends has been relatively limited.18 Only a few longitudinal cohort studies that have a cohort-sequential design with refresher samples from new generations, have provided evidence on the topic. Studies on frailty trends have been conducted in the United States, Japan, the Netherlands, the UK, and Sweden.2130313233 Except for a review in Japan that reported a decreasing trend in the prevalence of physical frailty from 2012 (7.0%) to 2017 (5.3%),33 the other studies have reported an increase in frailty prevalence among older adults over time. A study in the Netherlands showed that the prevalence of frailty among individuals aged 64–84 years increased from 21% in 1995–1996 to 28% in 2011–2012.21 Other studies have shown similar results, with increasing levels of frailty or higher frailty prevalence in more recent generations of older adults aged 65 years and over.303132 Studies also indicate that the association between frailty and mortality remains stable, suggesting a negative prospect for the future.18
Our observation was in line with the Japanese study reporting an improving trend of frailty. Japan has experienced a fast pace of population aging. In 1990, approximately 12% of the population was 65 years or older in Japan, while this number rose to over 28% in 2019.33 While the population of older adults in Japan is growing rapidly, recent data on health-related measures among Japanese older adults living in the community from 2007 to 2017 suggests that a trend of “rejuvenation” may be occurring among the new generation of older Japanese adults.34 This could be associated with various factors such as improved healthcare, better access to resources and support, and more effective interventions for frailty prevention and management. When compared with Japan, Korea has been experiencing a faster pace of population aging. The transition from an aging society (defined as ≥ 7% of the population was aged 65 years or older) to an aged society (defined as ≥ 14% by the same criteria) in South Korea occurred in a shorter time frame, taking only 17 years, as compared to Japan which took 24 years.1535 The trend of population aging in South Korea can be partly attributed to the country’s rapid economic development and the corresponding rise in life expectancy at birth,36 potentially contributed by the establishment of the modern welfare and healthcare systems after the Korean war. It is possible that social support systems, including preventive healthcare measures and improved access to healthcare,37 may have contributed to the improving trend of frailty in Korea, similar to Japan. The introduction of a universal healthcare system in South Korea has likely played a role in increasing access to healthcare for older adults,38 even though we do not have data with distant past time periods to assess the effect of changing healthcare accessibility. Preventive healthcare measures such as regular screenings and early interventions for chronic diseases are also likely to have contributed to the decreasing trend in frailty, as these measures can help to identify and address health issues before they become more severe. Overall, these efforts may have played a role in reducing the prevalence of frailty among older adults in Korea.
In our study, we found that certain comorbidities, such as dyslipidemia, diabetes mellitus, and cardiovascular disease, have increased over time. These conditions might be potentially influenced by changing lifestyle factors such as diet and physical activity levels with urbanization and the westernization of Korea.3940 The increased prevalence of comorbidities over time, in part, could also be attributed to the better healthcare access that allowed for earlier detection of these conditions, which in turn would lead to an increase in the prevalence of these conditions. This could also explain why we observed a decrease in factors such as chewing difficulty, activities of daily living limitation, and smoking over time. Early detection and management of chronic, age-related conditions such as diabetes or hypertension through improved healthcare access may have resulted in improved functional abilities among older adults. Additionally, the decrease in smoking, a known risk factor for various chronic diseases, may also have contributed to the improvement in functional abilities observed in our study. Overall, these findings suggest that improved access to healthcare and better management of comorbidities may have played a role in the decreasing trend of frailty observed in our study population.414243
Our study has several strengths. This is the first study to evaluate the nationwide trend of the prevalence of frailty in South Korea. It is also one of the few studies to evaluate the trend of frailty using a continuous frailty index, which allows for a more accurate assessment of frailty than categorical definitions. The study also includes a large sample size and covers a wide range of demographic, clinical, and laboratory characteristics, which allows for a detailed examination of the factors associated with frailty. Additionally, the use of complex sample analysis methods with assigned weights allows for the estimation of national-level statistical estimates, which enhances the generalizability of the study’s findings. Finally, compared with the Japanese study that reviewed the prevalence of frailty in separate cohorts, we were able to explore nationwide time trend of independent samples from repeated cross-sectionally designed data.
Our study has limitations as follows. First, the study is based on self-reported data and thus may be subject to recall and social desirability biases. Second, the study used a cross-sectional design, which limits the ability to establish causality or temporal relationships. Third, the study included older community-dwelling Koreans, which may limit the generalizability of the findings to other populations. Fourth, the study did not include information on non-response bias or missing data, which may have affected the representativeness of the sample. Fifth, we developed the frailty index by referring to a standard procedure for creating a frailty index and items used in previously published studies that used KNHANES data to create a frailty index. However, there was no additional validation of the frailty index used in this study. Sixth, the study period is from 2008 to 2020 thus more recent data might change the trends. For example, the impact of the coronavirus disease 2019 pandemic may alter the trend of frailty in older adults, which is an important area for future research.
In conclusion, our study provides insights into the trend of frailty in older adults in South Korea. The findings indicate that the prevalence of frailty has decreased significantly from 2008 to 2020, and that there has been a decrease in the frailty index observed in all age groups. Additionally, certain comorbidities, such as dyslipidemia, diabetes mellitus, and cardiovascular disease have increased over time, while factors such as chewing difficulty, activity limitation, and smoking have decreased. We believe that our study provides important information for public health policy in the country to prepare for the coming decades of further aging waves, to prevent or improve frailty and functional capacities in the older population.
 XML Download