

 PDF
PDF Citation
 Print
Print


INTRODUCTION
METHODS
Study design and participants
Sample collection and storage
cysC measurement
Equations for cysC-based eGFR
Table 1
| Name | Reference | Year | Age (yr) | Sex | cysC (mg/L) | Equation |
|---|---|---|---|---|---|---|
| Gentianeq | [21] | 2007 | - | - | - | 79.901/ Gentiancys1.4389 |
| CKD-EPIcys | [8] | 2011 | - | Male | ≤ 0.8 | 133 × (cysC/0.8)−0.499 × 0.996age |
| > 0.8 | 133 × (cysC/0.8)−1.328 × 0.996age | |||||
| - | Female | ≤ 0.8 | 133 × (cysC/0.8)−0.499 × 0.996age × 0.932 | |||
| > 0.8 | 133 × (cysC/0.8)−1.328 × 0.996age × 0.932 | |||||
| CAPAeq | [17] | 2014 | - | - | - | 130 × cysC−1.069 × age−0.117−7 |
| FASeq* | [18] | 2017 | ≤ 40 | - | - | 107.3/(cysC/Qcys) |
| 40 < age < 70 | 107.3/(cysC/Qcys) × 0.988(age−40) | |||||
| ≥ 70 | 107.3/(cysC/Qcys) × 0.988(age−40) | |||||
| EKFCcys† | [19] | 2023 | ≤ 40 | - | - | 107.3/(cysC/Qcys) |
| 40 < age < 50 | 107.3/(cysC/Qcys) × 0.990(age−40) | |||||
| ≥ 50 | 107.3/(cysC/Qcys) × 0.990(age−40) | |||||
*For Qcys of FASeq, 0.82 mg/L for ages <70 years and 0.95 mg/L for ages ≥70 years are used; †For Qcys of EKFCcys, 0.83 mg/L for ages <50 years and 0.83+ 0.005×(age−50) mg/L for ages ≥50 years are used.
Abbreviations: eGFR, estimated glomerular filtration rate; CKD-EPIcys, CKD-EPI cystatin C equation; CAPAeq, Caucasian, Asian, pediatric, and adult participants equation; FASeq, full age spectrum equation; Gentianeq, equation of Gentian manufacturer recommendation; Gentiancys, Gentian cystatin C immunoassay; cysC, cystatin C; Qcys, population-normalized cystatin C.
![]()
Statistical analysis
RESULTS
Table 2
| Parameter | Categorization of cystatin C-based eGFR with Gentiancys and Gentianeq* | |||||
|---|---|---|---|---|---|---|
|
|
||||||
| G1 (N=44) | G2 (N=36) | G3 (N=31) | G4 (N=20) | G5 (N=17) | Total (N=148) | |
| Age, yr, mean ± SD | 58.4 ± 14.9 | 61.0 ± 11.7 | 57.8 ± 14.9 | 62.5 ± 17.7 | 67.8 ± 12.7 | 60.5 ± 14.5 |
| Age range, yr | 20–85 | 36–82 | 20–81 | 27–91 | 49–88 | 20–91 |
| Female, N (%) | 22 (50) | 12 (33) | 13 (42) | 8 (40) | 8 (47) | 63 (43) |
| ICU admission, N (%) | 14 (32) | 7 (19) | 13 (42) | 7 (35) | 9 (53) | 50 (34) |
| Acute kidney injury, N (%) | 0 (0) | 2 (6) | 3 (10) | 3 (15) | 4 (24) | 12 (8) |
| Hemodialysis or CRRT, N (%) | 0 (0) | 1 (3) | 4 (13) | 4 (20) | 7 (41) | 16 (11) |
| Creatinine, mg/dL, mean ± SD | 0.63 ± 0.20 | 0.90 ± 0.29 | 1.04 ± 0.4 | 1.43 ± 0.52 | 3.37 ± 1.68 | 1.20 ± 1.04 |
| eGFR CKD-EPICrea, mL/min/1.73 m2, mean ± SD | 105.0 ± 19.6 | 84.3 ± 20.7 | 74.5 ± 26.0 | 55.2 ± 26.2 | 24.0 ± 22.4 | 77.5 ± 33.7 |
| Gentiancys value, mg/L, mean ± SD | 0.72 ± 0.11 | 1.09 ± 0.08 | 1.51 ± 0.18 | 2.37 ± 0.36 | 5.24 ± 1.22 | 1.72 ± 1.44 |
| Rochecys value, mg/L, mean ± SD | 0.80 ± 0.10 | 1.12 ± 0.08 | 1.50 ± 0.18 | 2.29 ± 0.36 | 5.03 ± 1.03 | 1.71 ± 1.35 |
| eGFR with Gentiancys and Gentianeq, mL/min/1.73 m2, mean ± SD | 133.9 ± 30.0 | 70.9 ± 8.1 | 45.1 ± 7.7 | 23.9 ± 4.8 | 8.1 ± 2.6 | 70.7 ± 48.8 |
*According to the 2012 KDIGO classification, each eGFR value was categorized as eGFR ≥90 mL/min/1.73 m2 (G1), 60–89 mL/min/1.73 m2 (G2), 30–59 mL/min/1.73 m2 (G3), 15–29 mL/min/1.73 m2 (G4), or<15 mL/min/1.73 m2 (G5).
Abbreviations: eGFR, estimated glomerular filtration rate; Gentianeq, the equation of Gentian manufacturer; Gentiancys, Gentian cystatin C immunoassay; ICU, intensive care unit; CRRT, continuous renal replacement therapy; CKD-EPIcys, CKD-EPI cystatin C equation; CKD-EPIcrea, CKD-EPI creatinine equation; Rochecys, Tina-quant Gen.2 assay.
![]()
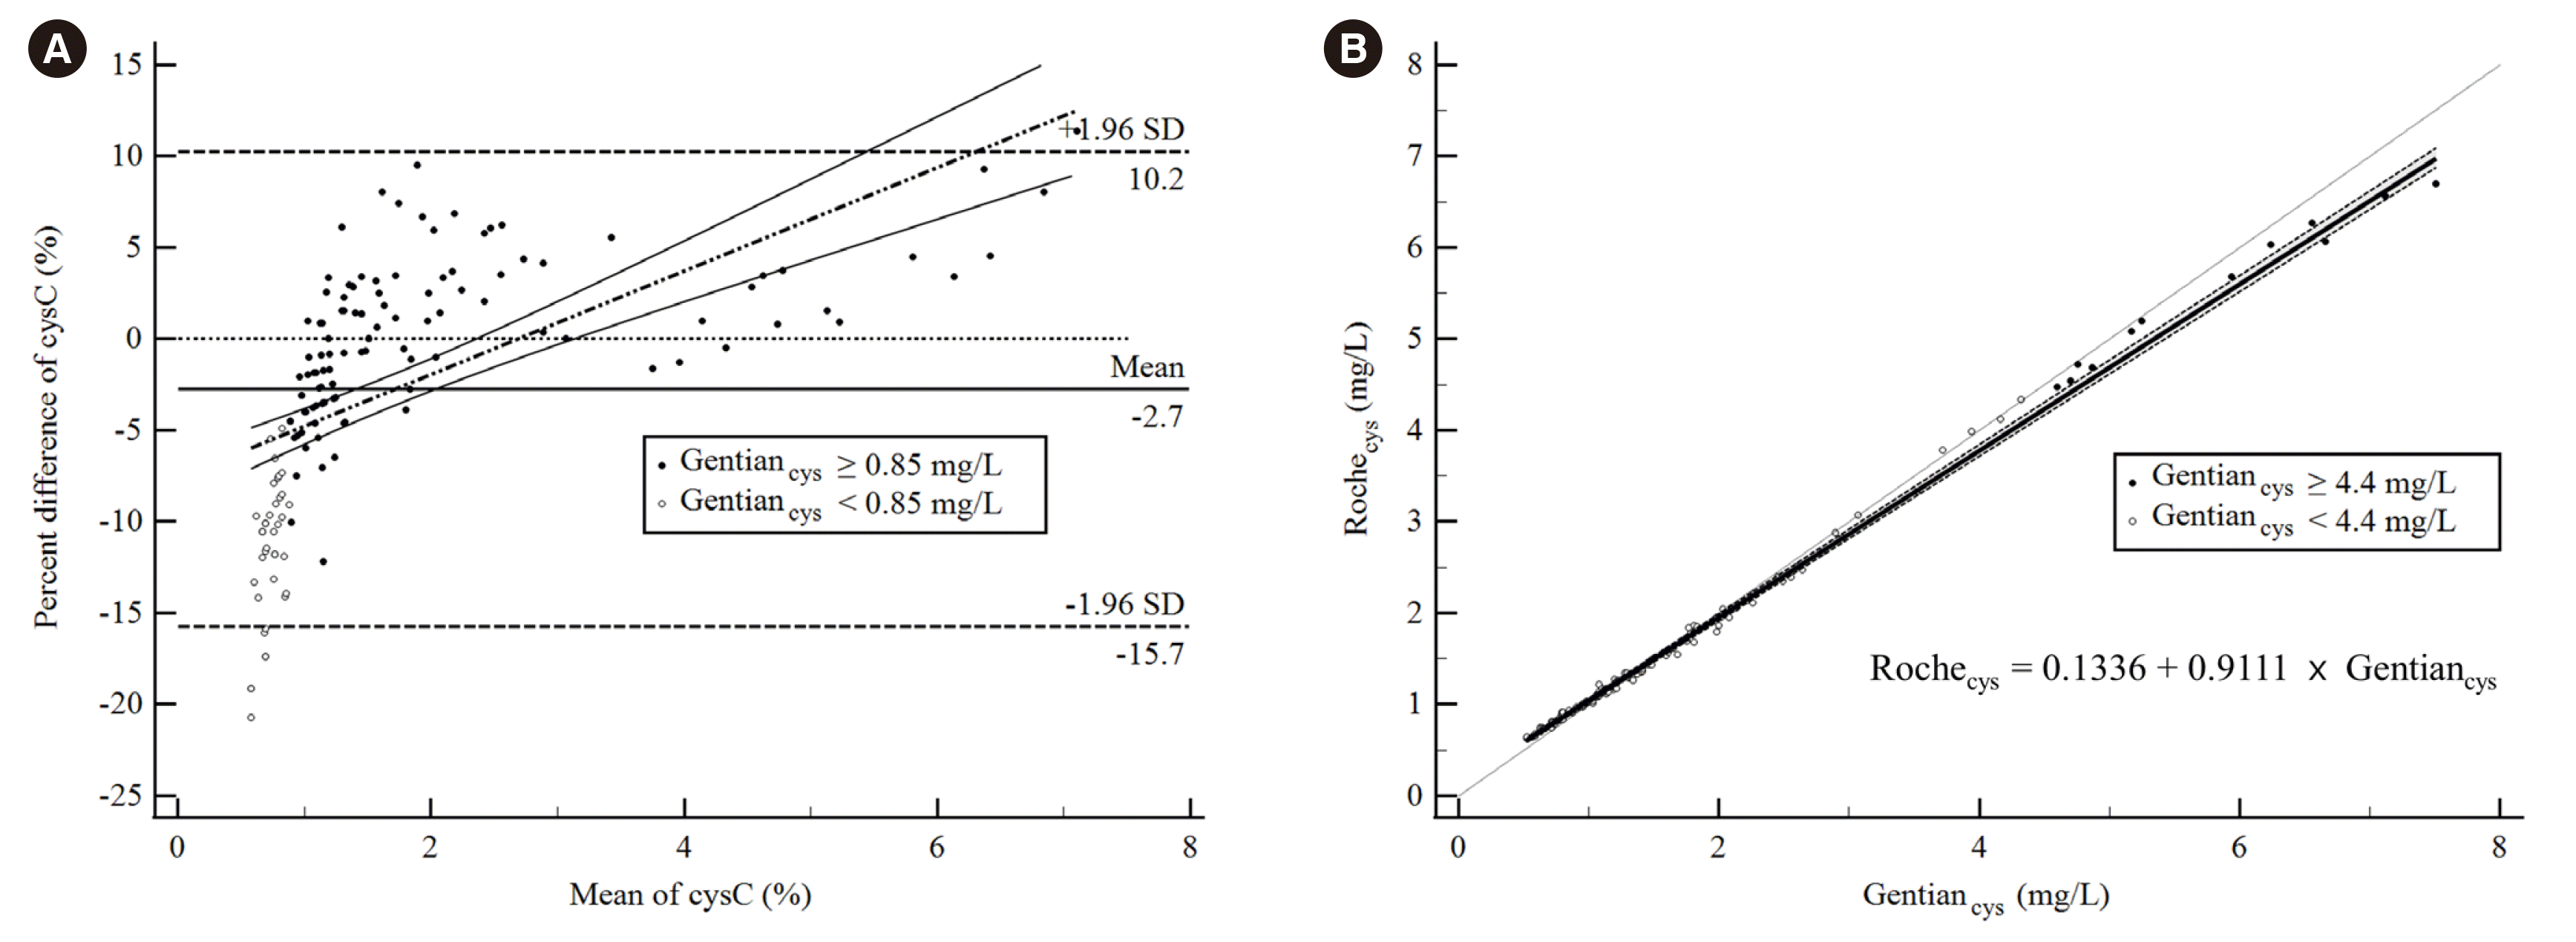
Fig. 1
![]()
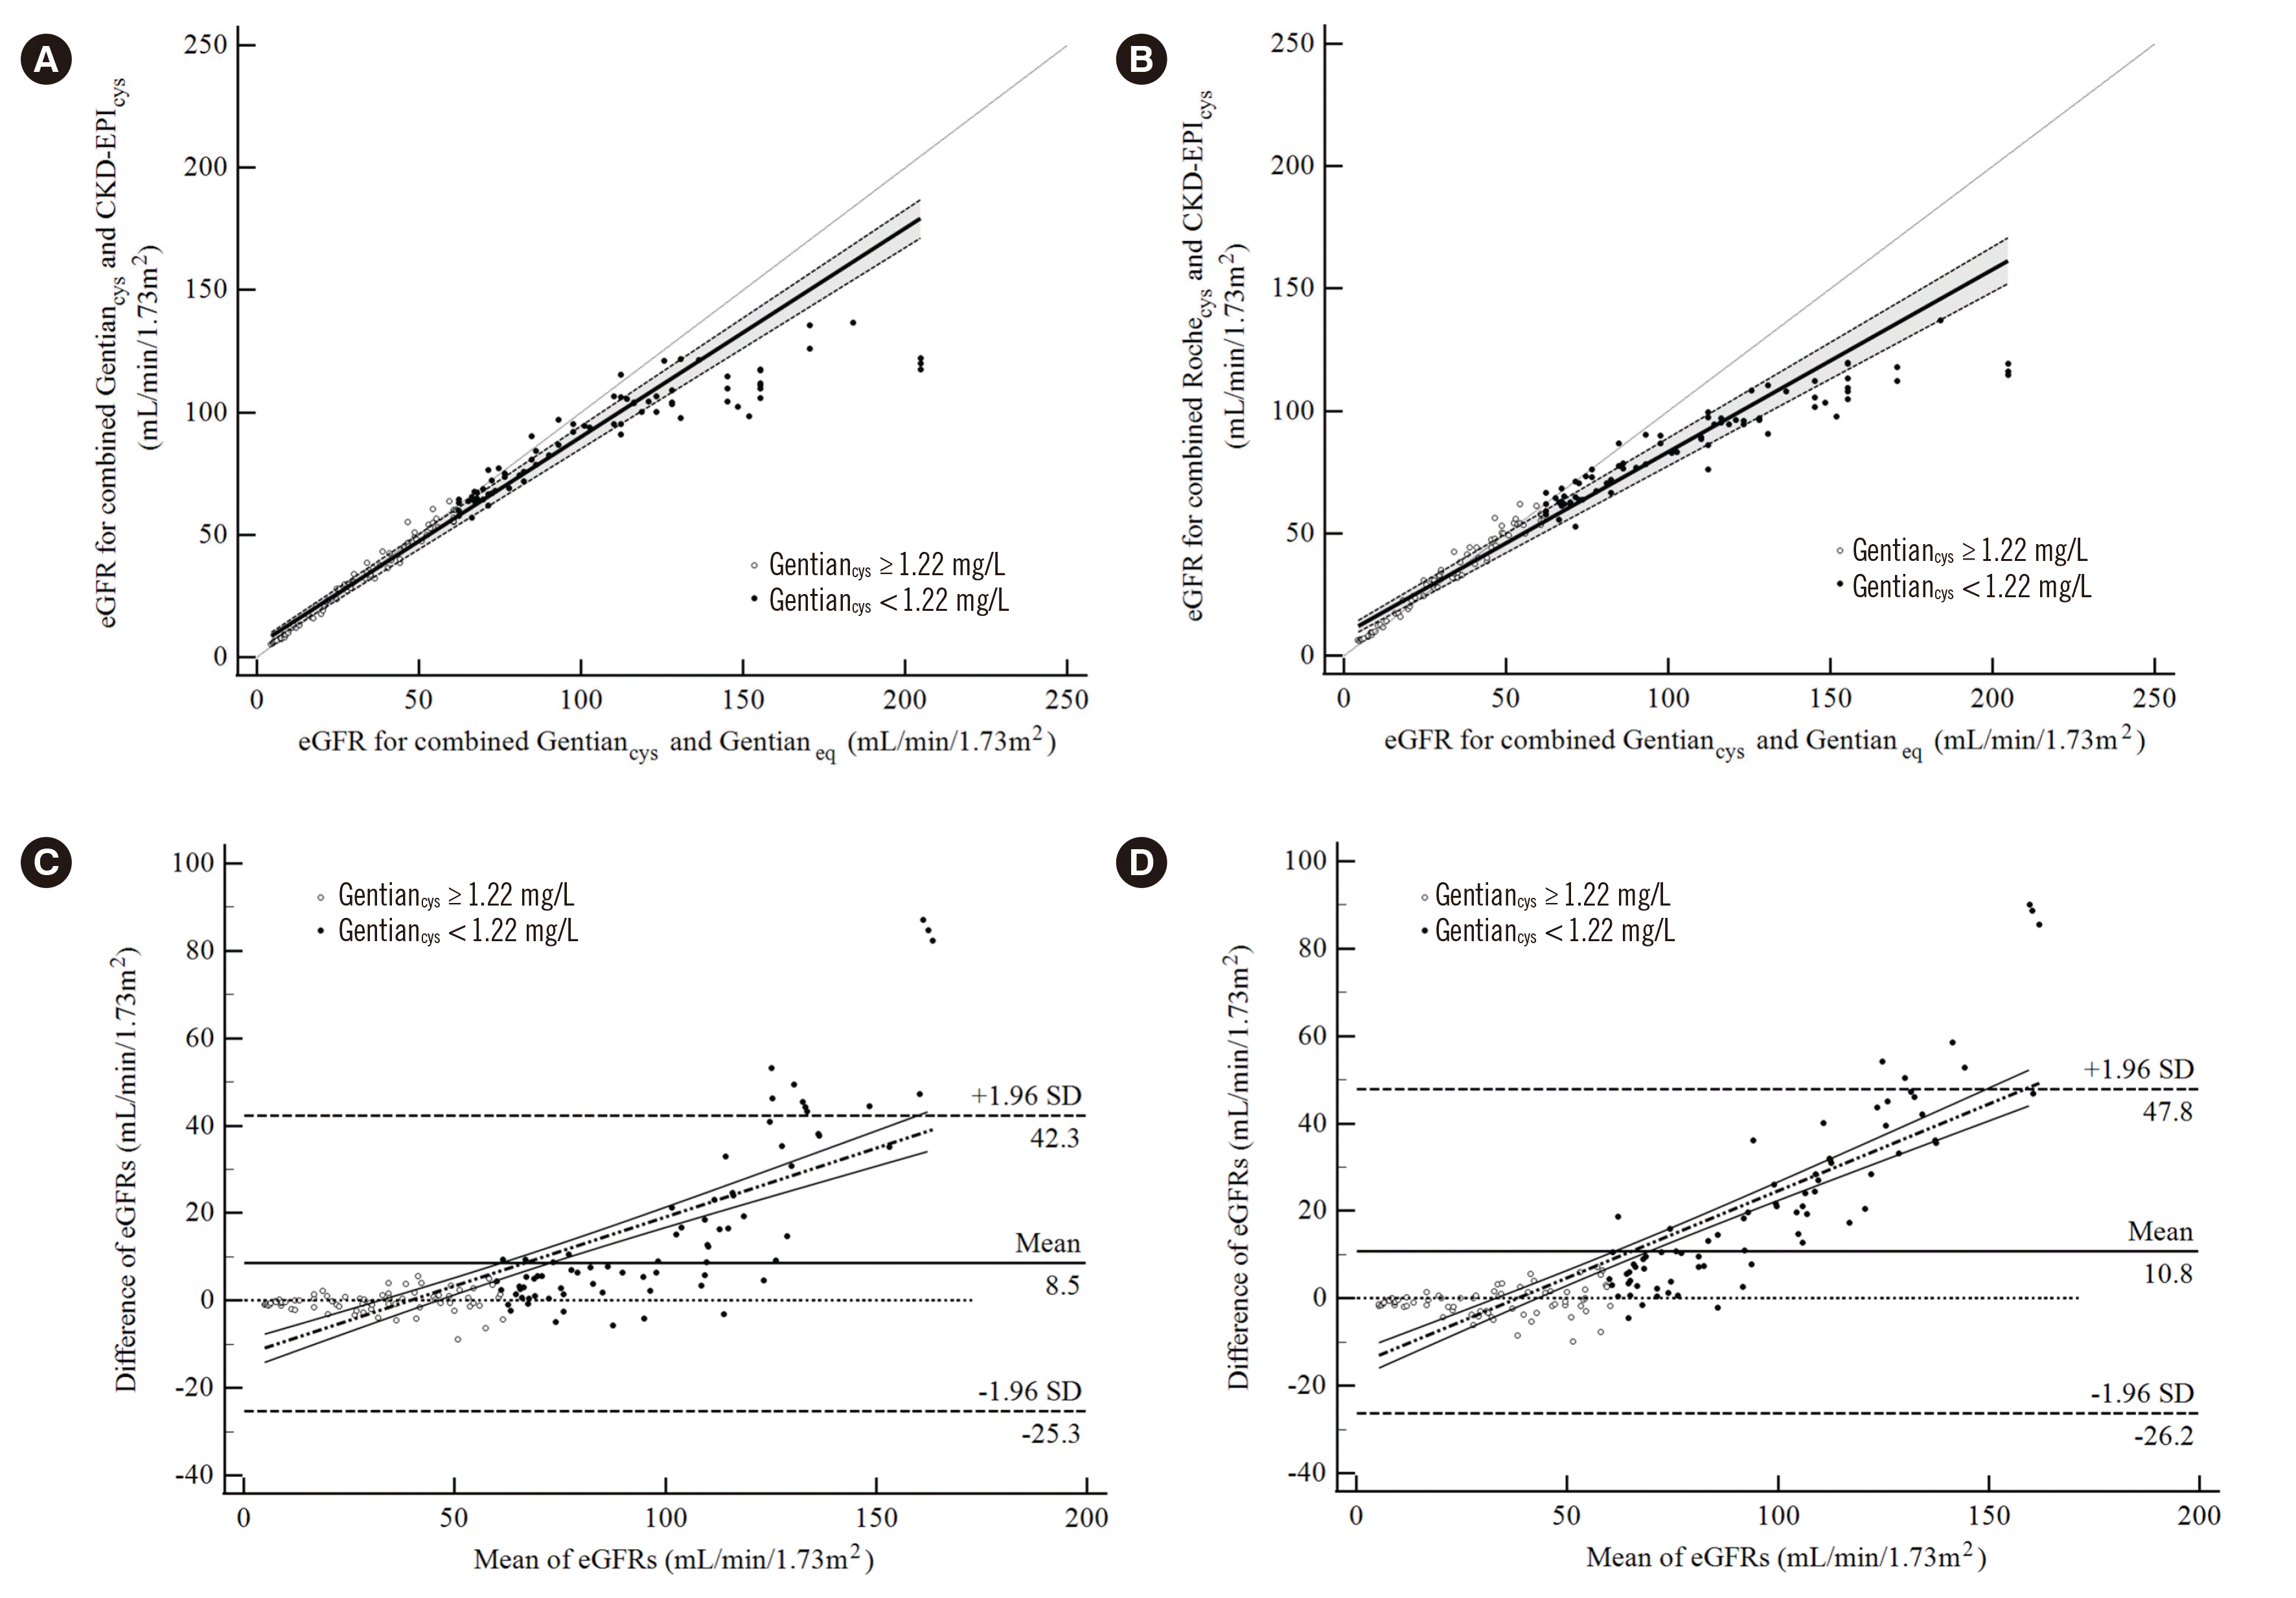
Fig. 2
![]()
Table 3
| Reagent | Equation | Mean eGFR values (mL/min/1.73 m2) according to groups based on Gentiancys values* | Total | |||
|---|---|---|---|---|---|---|
|
|
||||||
| Q1 (N=37) | Q2 (N=37) | Q3 (N=37) | Q4 (N=37) | |||
| Gentiancys | Gentiancys, mean ± SD (range), mg/L | 3.69 ± 1.68 (1.98–7.51) | 1.46 ± 0.20 (1.23–1.83) | 1.04 ± 0.10 (0.80–1.19) | 0.69 ± 0.09 (0.52–0.80) | 1.72 ± 1.44 (0.52–7.51) |
| CKD-EPIcys | 17.4 ± 9.2 | 47.3 ± 9.5 | 73.3 ± 11.1 | 109.7 ± 10.9 | 62.2 ± 35.7 | |
| Gentianeq (%diff, P) | 16.6 ± 8.9 | 47.7 ± 9.2 | 77.3 ± 11.6 | 141.0 ± 27.3 | 70.7 ± 48.8 | |
| (−5.2, P < 0.001) | (1.1, P < 0.001) | (5.6, P < 0.001) | (27.8, P < 0.001) | (7.2, P < 0.001) | ||
| CAPAeq (%diff, P) | 17.3 ± 10.3 | 48.0 ± 8.2 | 71.3 ± 9.0 | 115.9 ± 19.4 | 63.4 ± 38.4 | |
| (−6.9, P < 0.001) | (2.2, P < 0.001) | (−2.4, P < 0.001) | (5.6, P < 0.001) | (−0.4, P < 0.001) | ||
| FASeq (%diff, P) | 22.6 ± 10.2 | 50.3 ± 8.8 | 68.9 ± 10.6 | 105.8 ± 20.8 | 62.1 ± 33.4 | |
| (38.9, P < 0.001) | (7.5, P < 0.001) | (−5.6, P < 0.001) | (−3.8, P < 0.001) | (9.3, P < 0.001) | ||
| EKFCcys (%diff, P) | 24.9 ± 10.6 | 54.4 ± 8.5 | 75.8 ± 9.3 | 116.3 ± 18.6 | 67.8 ± 35.6 | |
| (53.8, P < 0.001) | (16.6, P < 0.001) | (−3.3, P < 0.001) | (5.2, P < 0.001) | (19.6, P < 0.001) | ||
| Rochecys | Rochecys, mean ± SD (range), mg/L | 3.55 ± 1.57 (1.96–6.70) | 1.45 ± 0.20 (1.20–1.85) | 1.08 ± 0.09 (0.92–1.20) | 0.77 ± 0.08 (0.63–0.92) | 1.71 ± 1.35 (0.63–6.70) |
| CKD-EPIcys (%diff, P) | 18.2 ± 9.8 | 47.7 ± 9.2 | 69.9 ± 9.7 | 102.9 ± 12.2 | 59.9 ± 32.9 | |
| (5.0, P < 0.001) | (1.0, P < 0.001) | (−4.7, P < 0.001) | (−6.1, P < 0.001) | (−1.2, P < 0.001) | ||
| CAPAeq (%diff, P) | 18.3 ± 10.9 | 48.4 ± 8.0 | 68.3 ± 7.8 | 101.2 ± 14.4 | 59.3 ± 32.3 | |
| (0.1, P < 0.001) | (3.1, P < 0.001) | (−6.5, P < 0.001) | (−7.7, P < 0.001) | (−2.8, P < 0.001) | ||
| FASeq (%diff, P) | 23.4 ± 10.6 | 50.7 ± 8.9 | 66.5 ± 9.8 | 94.1 ± 17.6 | 58.8 ± 28.6 | |
| (44.1, P < 0.001) | (8.4, P < 0.001) | (−8.9, P < 0.001) | (−14.4, P < 0.001) | (7.3, P < 0.001) | ||
| EKFCcys (%diff, P) | 25.8 ± 11.1 | 54.7 ± 8.4 | 73.0 ± 8.3 | 103.4 ± 14.9 | 64.2 ± 30.3 | |
| (59.6, P < 0.001) | (16.9, P < 0.001) | (−0.4, P < 0.001) | (−6.4, P < 0.001) | (17.4, P < 0.001) | ||
*According to previously recorded Gentiancys values, participants were divided into four groups: Q1 (>1.98 mg/L), Q2 (1.22–1.98 mg/L), Q3 (1.21–0.80 mg/L), and Q4 (<0.80 mg/L). The %diff was calculated as (A−B)/B×100, where B is the eGFR value of CKD-EPIcys with Gentiancys. All groups showed significant differences (P<0.001) when using the Wilcoxon signed-rank analysis to compare the difference between each eGFR combination and CKD-EPIcys with Gentiancys.
Abbreviations: eGFR, estimated glomerular filtration rate; Gentiancys, Gentian cystatin C immunoassay; Rochecys, Tina-quant Gen.2 analysis; Gentianeq, equation of Gentian manufacturer; CKD-EPIcys, CKD-EPI cystatin C equation; CAPAeq, equation of Caucasian, Asian, pediatric, and adult participants; FASeq, equation of full age spectrum; EKFCcys, EKFC cystatin C equation; %diff, percent difference.
![]()
 XML Download