

 PDF
PDF Citation
 Print
Print


INTRODUCTION
Exercise capacity, defined as the maximal amount of oxygen uptake for a given workload,12 can provide substantial clinical information. Metabolic equivalents (METs) and maximal oxygen uptake (VO2 max) are useful indices for assessing exercise capacity. Evidence from previous studies supports that cardiorespiratory fitness (CRF) is a powerful predictor of cardiac events and overall death in healthy individuals34567 and in patients with cardiovascular disease (CVD).8910111213 The prognostic importance of exercise capacity in those studies remains robust even after adjusting clinical confounding factors. Exercise capacity is accessed based on VO2 max or METs, which can be estimated by safe and inexpensive21415 symptom-limited exercise tests.
Because exercise capacity has a strong linear relationship with age and sex, some studies have established nomograms that estimate the percentage of predicted exercise capacity for a given age.251617 Reference values for exercise capacity differ between races and nations because of factors such as age, sex, physical activity, and ethnicity.1819202122 However, most of this evidence is based on Western populations of middle and upper socioeconomic status; information on Asian populations is scarce, especially regarding the relationship between exercise capacity and cardiovascular outcomes. It is necessary to evaluate CRF for each nation or ethnicity according to potential racial differences.
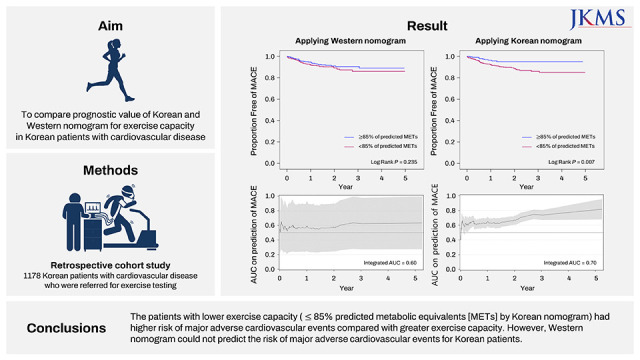
In the study, we sought to assess the prognostic value of exercise capacity among Korean individuals with CVD who have been referred for an exercise test. We also compare the prognostic value of Korean and Western nomograms applied to Korean patients with CVD.
METHODS
Study design
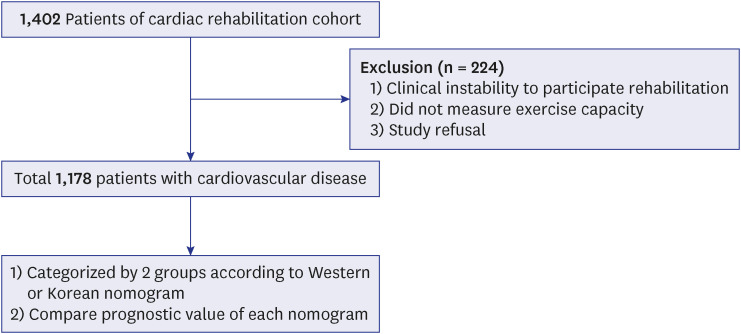
This retrospective study included patients with CVD who participated in the cardiac rehabilitation program at Korea University Guro Hospital between June 2015 and May 2020. Patients were excluded if physical fitness could not be assessed due to hemodynamic instability, comorbidities such as pulmonary or orthopedic disease, or noncooperation due to neurologic problems. Baseline physical fitness was assessed at the first outpatient visit after index admission. From 1,402 patients, a total of 1,178 patients with baseline physical fitness data were included in this study (Fig. 1). Outcome events were assessed up to the date of each patient’s final follow-up visit. The mean follow-up time was 600 days, and the median was 510 days (interquartile range, 252–812).
Procedures
A symptom-limited treadmill test according to a modified Bruce protocol was performed. The test ended at a predetermined level considered to be maximal effort. Heart rate and blood pressure were measured, and 12-lead ECG was recorded at each exercise stage. VO2 max was measured directly using a Quark b2 (COSMED) during the exercise test and was expressed as METs. Exercise capacity in METs (where 1 MET is 3.5 mL/kg/min of oxygen consumption [VO2]) was estimated.14 The following criteria were used to confirm maximal effort: no further increase in heart rate or VO2 with an increase in exercise intensity; respiratory exchange ratio of > 1.10; and rating of perceived exertion > 17 on the 6 to 20 scale or > 9 on the 0 to 10 scale. Since a plateau in VO2 with increased exercise intensity is rarely observed in patients with CVD, the peak VO2 value recorded was selected as VO2 max. Patients were categorized into two groups according to the proportion of predicted METs achieved (85%). This cutoff value was chosen based on previous studies,5616 which suggested that it was a significant predictor for mortality. The proportion of predicted exercise capacity achieved for each individual was calculated by dividing the observed METs achieved during exercise by the predicted METs [(actual METs/age- and gender- predicted METs) × 100], where 100% indicates a peak workload equal to that predicted for an individual based on age and sex.
Predicted exercise capacity equations
The nomogram for exercise capacity from healthy Korean individuals and a previous landmark Western study was used to determine the predicted exercise capacity. VO2 max or METs were calculated based on different prediction equations.
Male: Predicted METs = 18 – [0.15 × Age]
Female: Predicted METs = 14.7 – [0.13 × Age]
Nomogram from Korean cohort17
Male: Predicted VO2 max = 50.54 – [0.26 × Age]
Female: Predicted VO2 max = 40.0 – [0.22 × Age]
Study definitions and outcome
The study end points were major adverse cardiovascular events (MACE), defined as the composite of total death, acute myocardial infarction (MI), repeat revascularization, stroke, and hospitalization for heart failure. Acute MI was de\\xef\\xac\\x81ned as typical symptoms with new significant ST-segment change or elevation of cardiac markers to at least twice the upper limit of normal levels. Repeat revascularization was defined as repeat of percutaneous coronary intervention (PCI) or coronary artery bypass grafting for restoring blood flow to the coronary arteries after discharge after index PCI.23 After discharge, patients received optimal medical treatments at the discretion of the clinicians and according to contemporary guidelines.
Statistical analysis
Data were expressed as mean ± standard deviations or as numbers (percentages). For continuous variables, differences between two groups were evaluated by unpaired t-test or Mann–Whitney rank test. For discrete variables, differences between the groups were expressed as counts and percentages and analyzed with χ2 or Fisher’s exact test, as appropriate. To adjust for potential confounders, logistic regression analysis was performed. Results from multivariable analyses are described as odd ratios or hazard ratios with associated 95% confidence intervals. For all analyses, a two-sided P value of < 0.05 was considered statistically significant. Kaplan–Meier curves were plotted for the time to first event for clinical outcomes, and statistical differences between curves were assessed by the log-rank test. Cox proportional regression (with backward selection of covariates) was used to calculate hazard ratios between groups. The variance inflation factor was calculated for each variable, and a great collinearity was considered for values over 10. We computed concordance index (C-index) and time-dependent receiver operating characteristics (ROCs) curves to compare different models for predictions of time to primary end point.24 The C-index ranges from 0.5 to 1.0, where 1.0 would imply perfect discrimination. The area under the curve (AUC) was calculated at different time points. All data were processed with SPSS (version 24.0; IBM Corp., Armonk, NY, USA) and SAS (version 9.4, SAS Institute, Cary, NC, USA).
RESULTS
Of the initial 1,402 patients, 1,178 patients with CVD fulfilled the study inclusion criteria (Fig. 1). The average age was 62.3 ± 11.0, and 78.4% of the patients were male. Stable angina was the most common diagnosis (35.8%). MI, unstable angina, and vasospastic angina accounted for 23.2%, 22.6%, and 2.0%, respectively. Approximately 10.0% of patients had heart failure with reduced ejection fraction (left ventricular ejection fraction ≤ 40%) and 4.9% of patients had heart failure with preserved ejection fraction (left ventricular ejection fraction > 40% and NT-pro-B-type natriuretic peptide level of more than 300 pg per milliliter). Baseline characteristics are shown in Table 1 and Supplementary Table 1. During a mean follow-up of 1.6 years, MACE occurred as a primary outcome in 93 patients (7.9%). There were 16 deaths overall (1.4%). Acute MI occurred in 9 patients (0.8%), stroke in 7 (0.6%), revascularization in 59 (5.0%) and hospitalization for heart failure in 19 (1.6%).
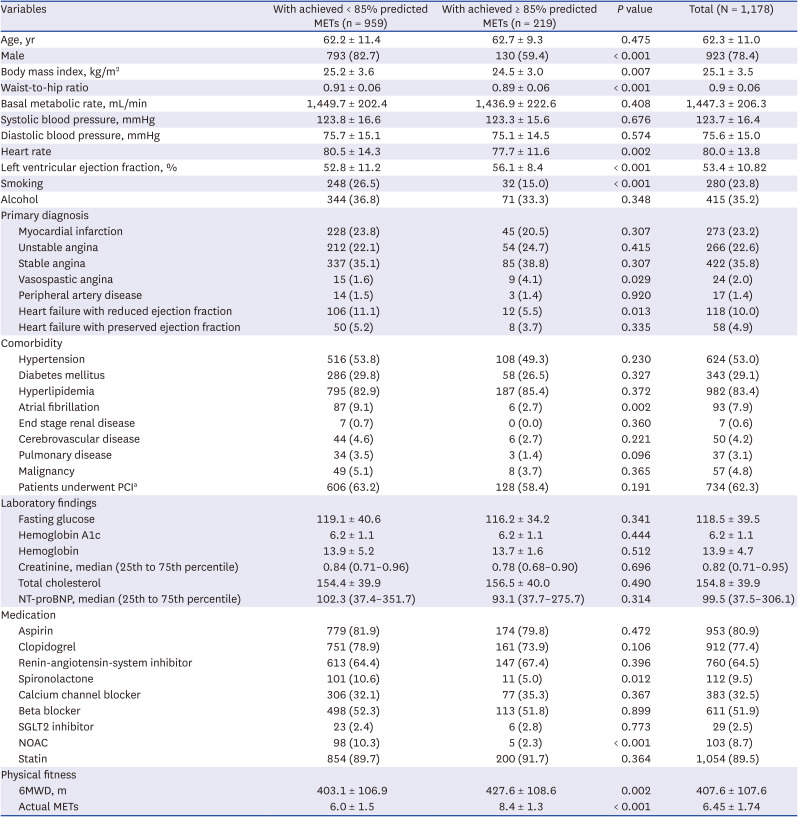
Table 1
Baseline clinical characteristics
Values are means ± standard deviation, median (interquartile range) or number (%).
MET = metabolic equivalent, PCI = percutaneous coronary intervention, NT-proBNP = N-terminal prohormone of brain natriuretic peptide, SGLT2 inhibitors = sodium-glucose cotransporter 2 inhibitors, NOAC = non-Vitamin K antagonist oral anticoagulants, 6MWD = 6-minute walking distance.
aThese patients underwent successful PCI due to de novo (new) or recurred coronary artery disease in initial admission.
![]()
Based on the equations from the Korean and Western cohorts to predict exercise capacity for age and sex, we determined the percentage of predicted exercise capacity achieved for each patient. The Korean population based-model showed that the participants who achieved less than 85% of the age- and gender-predicted METs (81% of total) included more male patients, smokers, and patients with heart failure and atrial fibrillation (Table 1). These patients were also more likely to have increased body mass index, waist-to-hip ratio, and heart rate, but decreased left ventricular ejection fraction compared with patients with greater exercise capacity. The average of actual METs and 6-minute walking distance (6MWD) was lower in patients with lower exercise capacity (6.0 METs and 403 m, respectively) than in those with greater exercise capacity (8.4 METs and 427 m, respectively).
The Western population based-model showed that the patients with lower exercise capacity (60% of total) included more male patients, smokers, and patients who currently drink alcohol (Supplementary Table 2). These patients had a higher prevalence of underlying diseases, such as heart failure and atrial fibrillation. The average of actual METs was lower in patients with lower exercise capacity (5.8 METs) than in patients with greater exercise capacity (7.4 METs). However, there was no significant difference in 6MWD between the two groups (408 m in the lower exercise capacity group and 407 m in the greater exercise capacity group). Furthermore, the patients with lower exercise capacity were younger than those with greater capacity (59.7 vs. 66.3 years).
The patients with lower exercise capacity by Korean nomogram had a hazard ratio for the MACE of 2.61 (95% confidence interval [CI], 1.31–5.20; P = 0.006) (Table 2). This result can be largely attributed to the increased risk of repeat revascularization (hazard ratio [HR], 2.39; 95% CI, 1.03–5.57). There was not a significant difference in risk of all-cause death, MI, stroke, or hospitalization for heart failure between the two groups. The incidence of each of those events was only 0 to 2% during the follow-up period. On the contrary, according to the Western population based-model, the patients with lower exercise capacity had a hazard ratio for the MACE of 1.36 (95% CI, 0.89–2.07; P = 0.160). For those patients, there was not a higher risk of any component of MACE compared with patients with greater exercise capacity. The Western population based-model did not predict clinical outcomes with statistical significance when it was applied to Korean patients. The relationship between exercise capacity and primary outcome was similar in both models, even after adjusting confounding factors. Time to event curve and hazard ratio of primary outcome on the basis of two models are shown in Fig. 2.
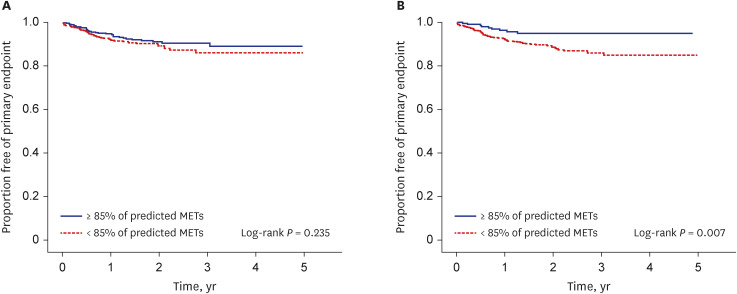
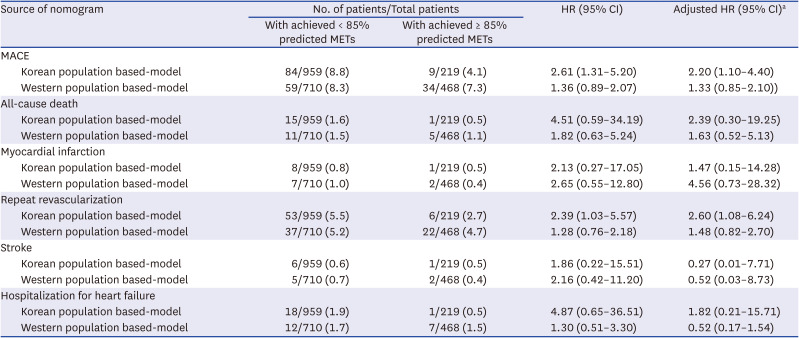
Fig. 2
Kaplan–Meier curves of freedom from primary endpoint; the composite of MACE and hospital readmission of heart failure according to predicted exercise capacity achieved. (A) Western nomogram; (B) Korean nomogram.
MET = metabolic equivalent, MACE = major adverse cardiovascular events including all-cause death, myocardial infarction, repeat revascularization, stroke and hospitalization for heart failure.
![]()
Table 2
Clinical outcomes by proportion of age- and sex-predicted METs achieved
Mean follow-up duration was 1.64 ± 1.22 years.
MET = metabolic equivalent, HR = hazard ratio, CI = confidence interval, MACE = major adverse cardiovascular events including all-cause death, myocardial infarction, repeat revascularization, stroke and hospitalization for heart failure.
aAdjusted for sex, age, diagnosis, left ventricular ejection fraction, smoking, alcohol, history of hypertension, diabetes mellitus, end stage renal disease, cerebrovascular disease, atrial fibrillation, malignancy, pulmonary disease, dyslipidemia, body mass index, hemoglobin.
![]()
The univariable analysis also showed age, smoking, diagnosis of heart failure with reduced ejection fraction, presence of atrial fibrillation, previous stroke, level of hemoglobin, total cholesterol, body mass index and left ventricular ejection fraction as predictors of primary outcome (Table 3). However, the multivariable analysis showed only age (hazard ratio [HR], 1.03; 95% CI, 1.01–1.05; P = 0.002), level of hemoglobin (HR, 0.89; 95% CI, 0.82–0.97; P = 0.009), left ventricular ejection fraction (HR, 0.96; 95% CI, 0.95–0.98; P < 0.001), and lower exercise capacity by Korean population based-nomogram (HR, 2.20; 95% CI, 1.10–4.40; P = 0.025) were predictors of primary outcome.
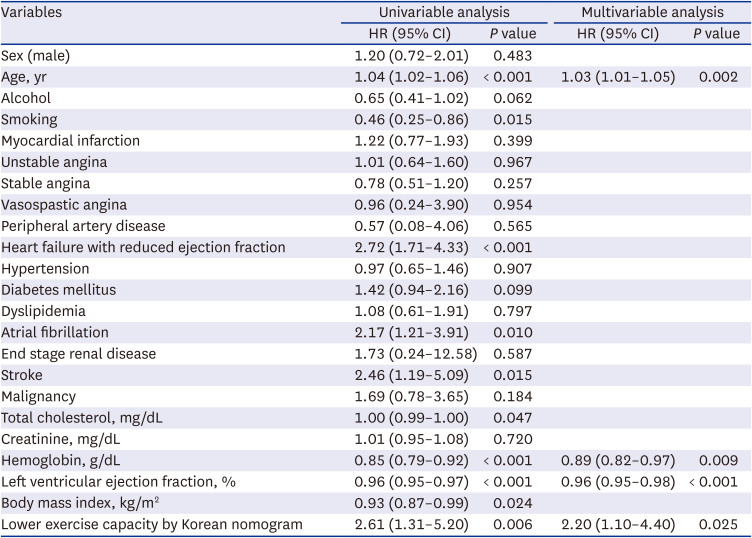
Table 3
Independent predictors for primary endpoint
HR = hazard ratio, CI = confidence interval.
The backward selection multivariable analysis used all covariates listed in the univariable analysis.
![]()
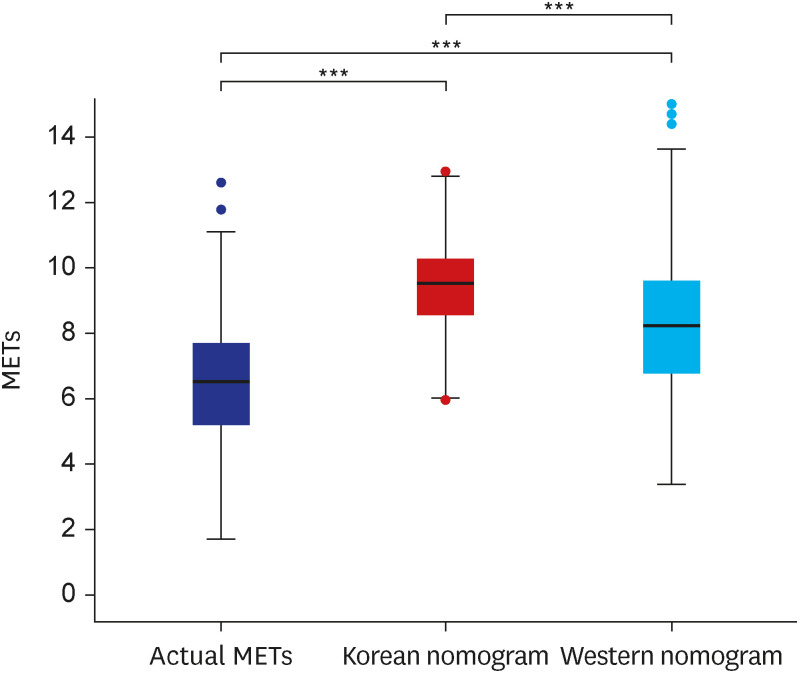
The mean performance of the participants was 6.45 ± 1.74 METs. The predicted METs based on the Korean nomogram was 9.32 ± 1.33, which was 1.10 ± 0.81 METs higher than the predicted METs based on the Western nomogram (Fig. 3). Using the Korean nomogram, 81.4% of the subjects failed to achieve 85% of predicted METs. However, only 60.3% of the subjects failed to achieve 85% of predicted METs by the Western nomogram. The Western nomogram showed significantly lower predicted METs and had wider interquartile range than the Korean nomogram (P < 0.001).
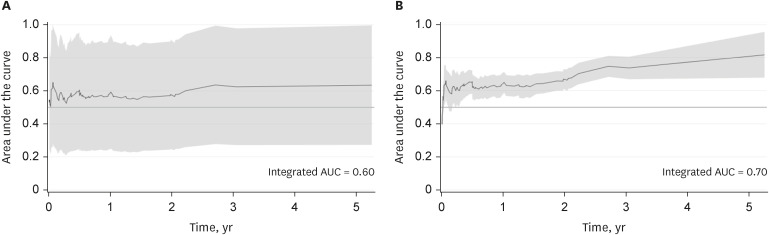
The proportion of predicted exercise capacity achieved by Korean nomogram provided greater prognostic accuracy in predicting MACE, when compared to Western nomogram. The Uno C-index value by each nomogram were 0.725 (95% CI, 0.561–0.88) and 0.604 (95% CI, 0.448–0.760), respectively (P = 0.050). Results of time-dependent ROC analysis on each model are shown in Fig. 4. Similarly, using the Korean nomogram showed greater intergraded AUC in predicting MACE than using the Western nomogram. ROC curves for MACE based on each nomogram between 1-year and 5-year are shown in Supplementary Fig. 1.
DISCUSSION
We aimed to evaluate the prognostic value of exercise capacity using the simple nomogram in predicting overall prognosis among Korean patients with CVD, and to compare the usefulness of two nomograms developed in different race groups for predicting future cardiovascular events. We found that patients with lower exercise capacity by the Korean cohort based-nomogram had an increased risk for the composite of total death, acute MI, repeat revascularization, stroke, and hospitalization for heart failure. However, patients with lower exercise capacity based on the Western cohort based-nomogram were not significantly associated with higher risk of primary outcome. Lower exercise (less than 85% of predicted METs by Korean nomogram) was one of the strongest predictors for the primary outcome. We observed that the prediction equation for METs developed for Western populations underestimated METs in Korean patients.
Several age- and gender-specific nomograms for predicting exercise capacity in Western populations have been suggested,125252627 but there could be substantial differences in their prognostic power or their ability to adjust for age-related effects.1628 In a previous study, Kim et al.16 externally validated the prognostic value of 11 different nomograms in patients referred for a treadmill exercise test. A nomogram based on a Veterans Affairs cohort [Predicted METs = 18 – (0.15 × Age)]14 performed best for men, and a nomogram based on the St. James Take Heart Project [Predicted METs = 14.7 – (0.13 × Age)]29 performed best for women. Although none of the models had strong predictive value of exercise capacity, of the available nomograms, authors highly recommend those two.
There is still scarce information about CRF reference values or nomograms for expected exercise capacity in Asian populations.213031 We have previously suggested the reference value of CRF using the treadmill tests for a healthy Korean population.17 A nomogram for predictive exercise capacity was derived from 2,646 participants; [VO2 max = 50.54 – 0.26 × (Age)] for men and [VO2 max = 40.0 – 0.22 × (Age)] for women. This cross-sectional data showed that young Korean participants had a lower CRF than American participants. However, the annual decrease of CRF was smaller in the Korean cohort; those older than 40 had higher CRF values than American older than 40. The exercise capacity of Koreans differed from that of Westerners in age-related reference values.
No definite causation of better predictability of Korean nomogram for poor prognosis was determined in our study. Nevertheless, partial explanations were available for results. This Korean nomogram was developed on the basis of findings in a population of healthy Korean. And the annual decrease of predicted METs is smaller in equation of Korean nomogram that that of Western. This difference is in line with the results of previous study that age-related change of actual METs was smaller in the Korean population compared to American.17 Thus, clear inter-ethnic differences in CRF exist, which may explain why the Western nomogram underestimated METs in Korean patients with CVD in our study, whose average age was 62.3. Of 1,178 participants, 959 patients (81%) was categorized as lower exercise capacity group by Korean nomogram and only 710 patients (60%) was categorized lower exercise capacity group by Western nomogram. The differed normal reference values of each model would affect power in predictability for worse prognosis. Guidelines from ATS/ACCP32 recommend that physicians consider age, sex, and anthropomorphic features for an optimal set of normal reference values. They have noted that participants studied should possess characteristics similar to those of the patient population to which the reference values will be applied. This should include the level of physical activity, racial composition, dwelling altitude, occupation, and knowledge of medical issues. The physiology of skeletal muscle, lung, and chest anatomy, such as lung capacity and functional residual capacity, are also important.33 In the present study, the difference in the predictive powers for worse prognosis between the two models may be explained by differences in these factors between races.
Arguably, exercise capacity is a powerful independent predictor for mortality and should be incorporated into real-world practice. However, most evidence for this comes from studies conducted in Western populations, and information on other ethnic groups is limited, especially for Asian populations. Few studies have focused on comparing the predictive values of nomograms from different nations or races. The value of exercise capacity is influenced by factors such as height, weight, physical activity, socioeconomic status, and genetic differences,1718203435 which differ between Western and Asian populations. To the best of our knowledge, this is first study suggesting that applying nomograms for exercise capacity to populations of different ethnicities would not be appropriate for predicting adverse cardiovascular events.
This trial had a few limitations. First, both nomograms were established from data on healthy cohorts, while the referral participants in our data set had CVD. Subjects with CVD have a higher risk of primary outcome than asymptomatic patients, and they tend to be older and have more diverse comorbidities. However, abundant evidence has shown that nomograms based on asymptomatic cohorts are also powerful predictors of mortality in selected symptomatic populations.56363738 It is uncertain that using a new nomogram created from symptomatic cohorts for patients with CVD would have better predictive value for clinical events. It would not be practical or cost-effective to create different nomograms from every clinical subset of populations and validate each nomogram as an effective predictor of prognosis.
Second, there was heterogeneity of diagnoses among participants, including coronary artery disease, peripheral artery disease, or heart failure. This aspect may affect the generalizability of this data for different clinical subsets of patients. Nevertheless, the cohort is homogenous when it comes to ethnicity, race, and nationality. Exercise capacity to predict future risk should be evaluated in diverse groups of a population.
Third, VO2 max was indirectly measured from a treadmill test for a healthy Korean reference population. Although the estimated values from treadmill test tended to overestimate the exercise capacity,3940 the Bruce equation for predicting actual VO2 max in healthy Korean adults has been validated.41
Fourth, because this was a retrospective study for cardiovascular patients conducted in a single tertiary medical center in Korea, results may not apply to other populations. There were more men than women, and the study participants were mainly older people. The results might be also affected by unmeasured selection bias.
Finally, this study has limited power to prove significant differences in each component of hard outcomes, such as mortality, due to the relatively short follow-up period of mean 1.6 years. Although the risk of each outcome was higher in patients with lower exercise capacity, the results were not statistically significant. The outcomes of our study promote further multicenter research with larger samples for longer periods in order to strengthen our results.
In conclusion, reduced exercise capacity, using the nomogram based on a Korean population, was a powerful and independent factor associated with a two-fold higher risk of major cardiovascular events in Korean patients with CVD. However, using the nomogram based on a Western population did not predict the risk of major cardiovascular events in Korean patients. This study has important implications that inter-ethnic difference in CRF should be considered and the reference values should be assessed in accordance with ethnic or national standards.
 XML Download