

 PDF
PDF Citation
 Print
Print


INTRODUCTION
Diabetes mellitus is a chronic illness that affects several organs, including the eyes, gastrointestinal tract, liver, and blood vessels, affecting nearly 6.4% of the global population.1 In South Korea, the prevalence of diabetes was 16.7% in 2020, steadily rising from 11.8% in 2012.2 Lack of exercise, westernized lifestyles, increased body mass index (BMI), small size of pancreatic beta cells, and decreased insulin secretion are thought to contribute to this rising prevalence.34
Blood sugar control using oral glucose-lowering medications or insulin injections is the main treatment for diabetes. However, patients should be equally taught about lifestyle modifications, such as engaging in regular exercise, smoking cessation, and weight control, as about medication, as these factors significantly affect disease progression. The general recommendation in terms of physical activity for patients with diabetes is to engage in 150 min or more of moderate-to-vigorous physical activity (MVPA) per week.5 Recently, a cohort study of patients with diabetes in South Korea revealed that those who exercised 5–6 times per week had the lowest mortality rate among those who exercised within the range of 0–7 times per week, emphasizing the positive impact of exercise on the prognosis of this disease.6
However, patients with diabetes reportedly have a higher risk of almost all types of infections, including respiratory infections, than those without diabetes.7 Diabetes compromises a patient’s immunity by reducing T cell-mediated immune responses and impairing neutrophil function. Thus, both the innate and adaptive immune systems are disrupted, thereby increasing the risk of infectious diseases, such as respiratory, urinary tract, soft tissue, and central nervous system infections.89
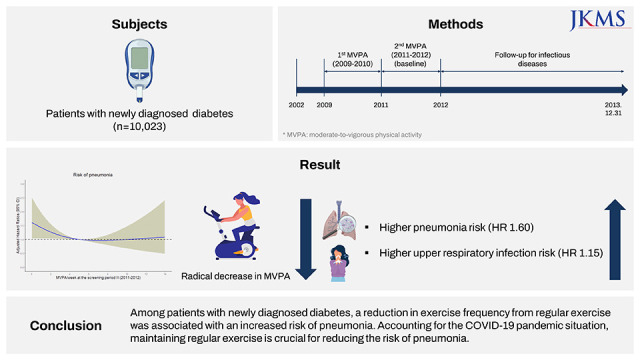
Given that the coronavirus disease 2019 (COVID-19) pandemic has resulted in many individuals being isolated owing to social distancing policies, physical inactivity has become a significant public health concern. However, only a few studies have been conducted to investigate the association between a reduction in exercise and the risk of infectious diseases in patients with diabetes. Therefore, the aim of this study was to examine the association between exercise frequency reduction and risk of infectious diseases among patients with newly diagnosed diabetes.
METHODS
Study population
The Korean National Health Insurance Service (NHIS) provides obligatory health insurance services for all South Korean citizens, covering almost all aspects of healthcare, including biennial health screening, which is carried out for every adult aged at least 40 years. The NHIS collects data on sociodemographic characteristics, medical history, hospitalization and outpatient department visits, serological characteristics, medication prescriptions, and lifestyle behaviors, for research purposes. The study population was derived from the NHIS-Health Screening Cohort, which is a random sample of the entire NHIS database, built with the intent of representing all South Korean adults.
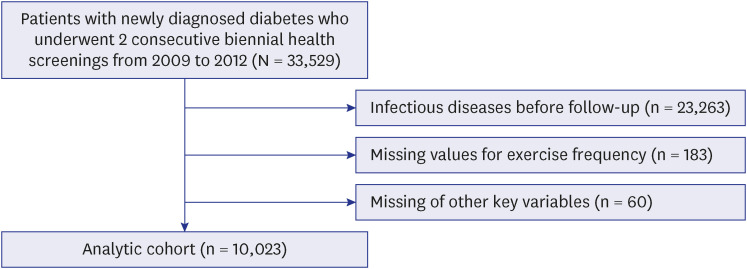
In the present study, patients with newly diagnosed diabetes who underwent consecutive health screenings in two periods (both 2009–2010 and 2011–2012) were identified to evaluate the association between changes in exercise frequency and the risk of infectious disease (n = 33,529). We excluded patients who were diagnosed with infectious diseases before the follow-up investigation (n = 23,263), those for whom information on changes in exercise frequency (n = 183) were missing, and those for whom information of other key variables for the adjusted analyses (n = 60) were missing. Finally, 10,023 patients with newly diagnosed diabetes were included in the analysis (Fig. 1). This study was reported in accordance with the STROBE statement.10
Newly diagnosed diabetes and follow-up for infectious diseases
Patients with newly diagnosed diabetes were identified using the International Classification of Diseases 10th Revision (ICD-10) codes E10-E14 along with the prescription of antidiabetic medications to minimize bias caused by advanced stages of diabetes. Infectious diseases were categorized based on seven different types of organs and identified using previously reported ICD-10 codes (Supplementary Table 1).7 All patients were followed up from the date of the second health screening (carried out from January 1, 2011 to December 31, 2012) until death, diagnosis of infectious disease, or December 31, 2013, whichever occurred earliest.
Changes in exercise frequency
The patients in the NHIS cohort provided responses to self-reported questionnaires on lifestyle behaviors, including moderate physical activity (e.g., dancing, gardening, brisk walking; ≥ 30 min/day) and vigorous physical activity (e.g., running, aerobics, fast cycling; ≥ 20 min/day) per week, at two consecutive, biennial health screenings. Exercise was evaluated using MVPA, which was calculated by adding the frequencies of self-reported moderate physical activity and vigorous physical activity per week. All patients were classified as physically inactive (no MVPA/week), 1–2 times of MVPA/week, 3–4 times of MVPA/week, and ≥ 5 times of MVPA/week. The primary analysis was conducted by examining the change in MVPA between the two periods and its association with the risk of infectious diseases. Each MVPA category for period I (2009–2010) was set as a reference and compared with the MVPA category for period II (2011–2012). Secondary analysis was performed by comparing the patients who continuously engaged in ≥ 5 times/week during both periods with those who had performed ≥ 5 times/week during period I but < 5 times/week during period II, to further examine the association of detraining. The validity and reliability of the physical activity questionnaire have been described previously.11
Key variables
Relevant information was collected for adjusted and stratified analyses, including socioeconomic factors (age [continuous; years], sex [categorical; men or women], and household income [categorical; upper half and lower half]), BMI (continuous; kg/m2), systolic blood pressure (continuous; mmHg), fasting serum glucose (continuous; mg/dL), smoking (categorical; current, former, or never), alcohol consumption (categorical; yes or no), and comorbidities (continuous; Charlson Comorbidity Index [CCI]). Household income was used as a proxy for insurance premiums. The CCI was calculated as described in a previous study.12
Statistical analysis
Descriptive characteristics are presented as number (%) and median (interquartile range; IQR) for categorical and continuous variables, respectively. The crude rate was calculated based on the total number of events per 1,000 person-years (PY) for each group. The hazard ratio (HR) and 95% confidence interval (CI) were calculated using Cox proportional-hazards regression. The first model was minimally adjusted for age and sex. The adjusted HR (aHR) and 95% CI of the final model were calculated after adjusting for key variables including age, sex, household income, BMI, systolic blood pressure, fasting serum glucose, smoking, alcohol consumption, and CCI. The proportional-hazards assumption was graphically tested using a log-log plot. Restricted cubic splines were generated based on three knots to present the consecutive aHR (95% CI) according to changes in MVPA frequency. Two-sided P values less than 0.05 were considered statistically significant. All statistical analyses were performed using SAS (version 9.4; SAS Institute, Cary, NC, USA) and R (version 3.4.0, 2017; R Development Core Team; Vienna, Austria).
RESULTS
Study population characteristics
Among the 10,023 patients with newly diagnosed diabetes, the median age was 62 years (IQR, 55–70) in period II. The proportions of all categories of exercise frequency were similar in both periods. In period I, 48.0% (n = 4,815) of participants were physically inactive, followed by ≥ 5 (n = 2,438; 24.3%), 1–2 (n = 1,469; 14.7%), and 3–4 (n = 1,301; 13.0%) times of MVPA/week. Similarly, approximately half of the patients (n = 4,903; 48.9%) were physically inactive during period II, followed by ≥ 5 (n = 2,446; 24.4%), 1–2 (n = 1,418; 14.1%), and 3–4 (n = 1,256; 12.5%) times of MVPA/week. All the descriptive characteristics of the patients are summarized in Table 1.
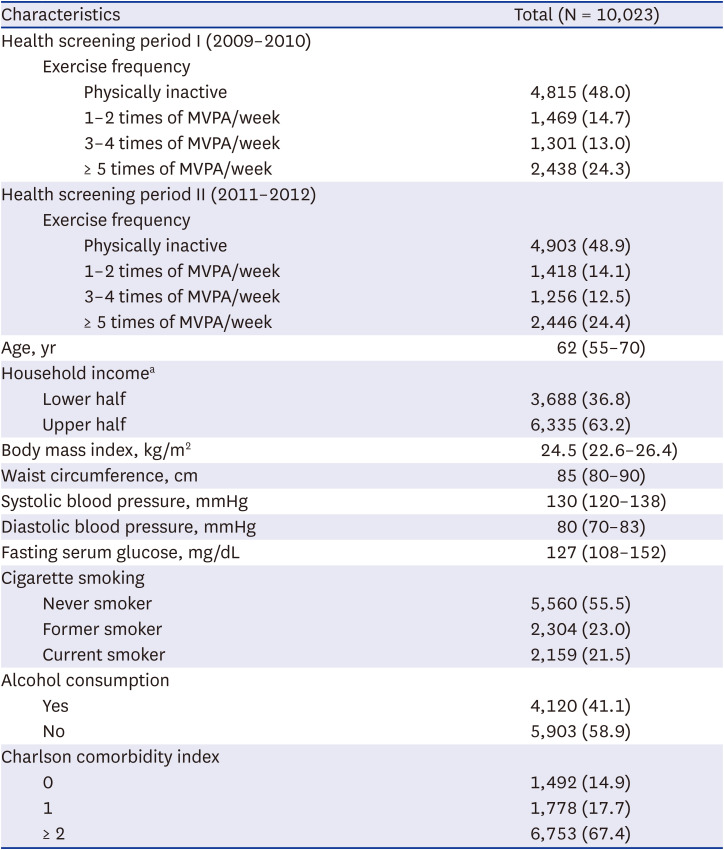
Table 1
Baseline characteristics of the study population
Continuous variables were presented as median (interquartile range) and categorical variables as number (%) unless otherwise specified.
MVPA = moderate-to-vigorous physical activity.
aProxy for socioeconomic status based on the insurance premium of the National Health Insurance Service.
![]()
Changes in MVPA frequency and risk of infection
Compared to continuous engagement in ≥ 5 times of MVPA/week during both periods, a radical decrease in MVPA frequency (from ≥ 5 times of MVPA/week to a state of physical inactivity) was associated with a higher risk of pneumonia (aHR, 1.60; 95% CI, 1.03–2.48) and upper respiratory tract infection (aHR, 1.15; 95% CI, 1.01–1.31; Table 2). In addition, a reduction in MVPA from ≥ 5 to 3–4 times/week was associated with a higher risk of upper urinary tract infection (aHR, 3.49; 95% CI, 1.22–10.02); however, the wide CI indicates an imprecise estimate owing to the relatively small infection events in these groups (n = 28).
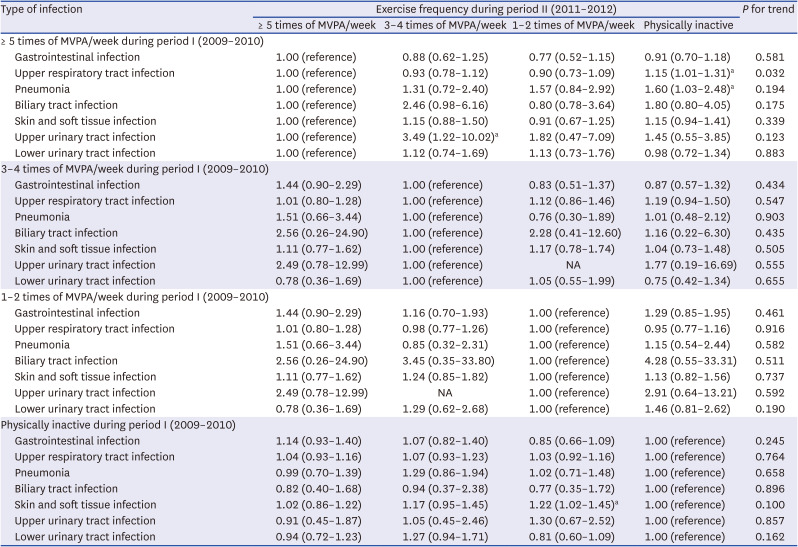
Table 2
Association of exercise frequency reduction with risk of infection
Data are adjusted hazard ratio calculated using the Cox proportional hazards model after adjustments for age, sex, household income, body mass index, systolic blood pressure, fasting serum glucose, smoking, alcohol consumption, and Charlson Comorbidity Index.
MVPA = moderate-to-vigorous physical activity, NA = not applicable.
aP < 0.05.
![]()
Compared to maintained physical inactivity during both periods, an increase in MVPA from a state of physical inactivity to 1–2 times/week was associated with a higher risk of skin and soft tissue infection (aHR, 1.22; 95% CI, 1.02–1.45). However, no infectious diseases significantly increased when MVPA radically increased from a state of physical inactivity to ≥ 5 times/week.
Table 3 summarizes the results of the secondary analysis of the risk of pneumonia and upper respiratory tract infection, which showed a statistical significance at the primary analysis when MVPA radically decreased. The crude rates of these diseases per 1,000 PY of those who engaged in ≥ 5 times of MVPA/week during period II (2011–2012) and those who performed < 5 times of MVPA/week in that period among participants engaged in ≥ 5 times of MVPA/week during period I (2009–2010) were 16.2 and 27.6, respectively, for pneumonia, and 344.2 and 374.1, respectively, for upper respiratory tract infection. A reduction in MVPA frequency was associated with a higher risk of pneumonia (aHR, 1.52; 95% CI, 1.02–2.27), but not with that of upper respiratory tract infection. Other infectious diseases were analyzed in the same manner but did not yield significant results when the MVPA frequency was reduced (Supplementary Table 2).
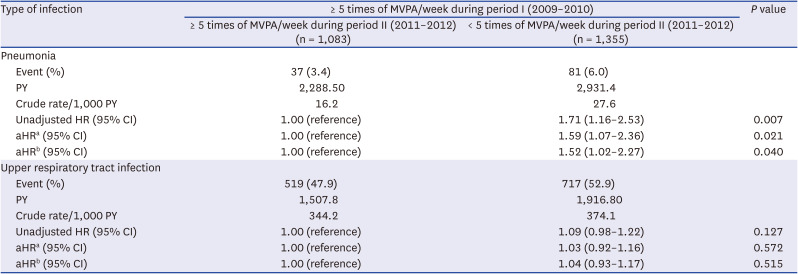
Table 3
Association of exercise frequency reduction with risk of infection among participants with ≥ 5 times of MVPA/week during period I (2009–2010)
Data are adjusted hazard ratio calculated using the Cox proportional hazards.
MVPA = moderate-to-vigorous physical activity, PY = person-years, HR = hazard ratio, aHR = adjusted hazard ratio, CI = confidence interval.
aaHR adjusted for age and sex.
baHR adjusted for age, sex, household income, body mass index, systolic blood pressure, fasting serum glucose, smoking, alcohol consumption, and Charlson Comorbidity Index.
![]()
Restricted cubic splines were generated for the presentation of consecutive aHR and 95% CI with the risk of pneumonia and upper respiratory tract infection according to the changes in MVPA. As illustrated in Fig. 2, the risk of pneumonia was significantly elevated when the frequency of MVPA decreased from ≥ 5 times of MVPA/week in period I to < 5 times of MVPA/week in period II. However, no significant associations were discovered with the risk of upper respiratory tract infection (Supplementary Fig. 1).
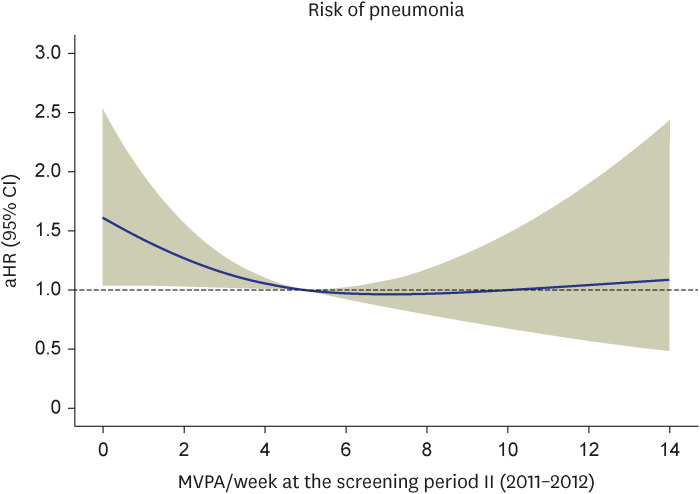
Fig. 2
Restricted cubic spline evaluating the association of MVPA frequency during period II (2011–2012) with the risk of pneumonia among patients with ≥ 5 times of MVPA/week during period I (2009–2010). aHR was calculated using Cox proportional hazards regression after adjustments for age, sex, household income, body mass index, systolic blood pressure, fasting serum glucose, smoking, alcohol consumption, and Charlson Comorbidity Index. Blue solid line indicates aHR and beige shaded area indicates 95% CIs.
MVPA = moderate-to-vigorous physical activity, aHR = adjusted hazard ratio, CI = confidence interval.
![]()
DISCUSSION
In this study, the risks of both pneumonia and upper respiratory tract infection increased when MVPA frequency was reduced from ≥ 5 times of MVPA/week to a state of physical inactivity. However, a reduction in MVPA frequency from ≥ 5 to < 5 times/week only increased the risk of pneumonia, emphasizing the role of maintaining regular exercise in pneumonia. Therefore, being physically active may provide additional benefits to patients with diabetes regarding their future risks of pneumonia.
Our results showed a limited effect of MVPA in that they demonstrated only the detrimental effects of a reduction in MVPA: an increased risk of pneumonia. Many previous studies have demonstrated the beneficial effects of regular exercise on the risk of pneumonia. A systematic review and meta-analysis of 10 prospective studies involving 1,044,492 participants revealed strong evidence for a lower risk of pneumonia among the most physically active group than that in the least physically active group (relative risk, 0.69; 95% CI, 0.64–0.74).13 Moreover, a randomized controlled trial of 154 US adults aged ≥ 50 years revealed that 8 weeks of MVPA was effective in preventing acute respiratory illness.14 However, few studies have been conducted to examine the effects of exercise reduction and physical inactivity on the risk of pneumonia. A cohort study of 48,440 adult patients diagnosed with COVID-19 revealed that patients with COVID-19 who were consistently physically inactive had a greater risk of hospitalization (odds ratio [OR], 2.26; 95% CI, 1.81–2.83), intensive care unit admission (OR, 1.73; 95% CI, 1.18–2.55), and mortality rate (OR, 2.49; 95% CI, 1.33–4.67) than those who were consistently physically active, which was similar to the results in our study: detraining can have detrimental effects in the pneumonia risk.15 MVPA levels were separated into three categories (consistently inactive, inconsistently active, and consistently active) in the study by Sallis et al.,15 based on self-reported exercise vital signs, which was similar to what we did in this study. In addition, key variables that were used for adjustment included chronic diseases, which could represent current conditions on exercise, which were similar to our study. However, Sallis et al.15 targeted the severe outcomes of COVID-19 which was different from the case in our study, considering that we mainly targeted the incidence of infectious diseases. Another cohort study of 1,365 women revealed a significantly high risk of infection that precipitates hospitalization when physically inactive (OR, 4.08; 95% CI, 1.73–9.63).16 Among the infectious diseases in the study by Leveille et al.,16 pneumonia was the most frequent (33%) during the follow-up, which is similar to our results. However, the authors analyzed the risk of infections in general and did not conduct further analysis to evaluate the risk of pneumonia itself, which made it difficult to compare with our results.
Patients with diabetes have a higher risk of immune dysfunction owing to depressed polymorphonuclear leukocyte function.17 Moreover, several studies have revealed that detraining leads to impaired insulin sensitivity, as tested using the euglycemic clamp technique.18 Therefore, reducing exercise may result in the progression of diabetes in a poorly controlled state, leading to immune dysfunction and an increased risk of pneumonia, as it is the most common cause of hospitalization among patients with diabetes.719 However, we could not detect any dose-response relationship between MVPA and risk of respiratory infections, which is inconsistent with the results of previous studies.202122 The main difference between this study and prior studies is the measurement of physical activity. In most studies in which such a dose-response relationship was demonstrated, physical activity was measured as the metabolic equivalent of tasks (METs),2122 whereas physical activity measured using self-reported questionnaires had a direct but not dose-response relationship between physical inactivity and increased risk of respiratory infections.16 When measuring physical activity obtained with self-reported questionnaires, assessment of moderate-intensity physical activity is less robust than assessment of heavy-intensity physical activity owing to its susceptibility to recall bias.2324 Therefore, the inconsistency between the reduction in exercise and the risk of respiratory infections requires further investigation.
Our results did not include a significant relationship between the risk of upper respiratory tract infection and a reduction in MVPA, except for a reduction due to physical inactivity. As our data were medical claims data, upper respiratory tract infections may have been underestimated owing to relatively mild symptoms and the use of over-the-counter pharmaceuticals. As most previous studies regarding the risk of upper respiratory tract infections also made use of self-reported data,142022 the true association might have been confounded because of response bias.
The risk of skin and soft tissue infections increased when the patients became more active compared with those who were physically inactive. Physical inactivity caused by a decreased general condition or other disease states might have increased skin infection owing to poor personal hygiene, even though we adjusted the risk with the CCI score. In addition, exercise itself may be a risk factor for skin infection owing to the sweaty environment and high skin contact.25
The reason why an increase in MVPA did not result in a decrease in the risk of infection and was inconsistent with previous studies in which exercise-induced, immunoprotective effects on the risk of respiratory infections were demonstrated, is unclear.1314202627 The main confounder responsible for this inconsistency is possibly the MVPA level prior to the infection, as suggested in prior studies.21 We attempted to reflect the trend of each individual’s MVPA level by comparing the previous MVPA frequency with the latest (changes in MVPA from periods I to II), self-reported during biennial health screening tests, which holds promise in minimizing reverse causality of MVPA frequency. However, owing to the nature of this retrospective, observational cohort study, the MVPA frequency just before the infection is unknown, and the reported MVPA frequency could have changed after the health screening test. As short-term physical inactivity can lead to deterioration of insulin resistance and immune functions,282930 the MVPA frequency before infection is likely to bias the true association. As we focused on investigating the long-term effect of changes in MVPA frequency on the risk of infection, further studies are required to investigate the combined short- and long-term effects of MVPA frequency on the risk of infection. Other possible reasons accounting for the insignificant results are heavy exertion or repeated exercise that may cause transient immune dysfunction, inadequate statistical power of specific infections, or unmeasured confounders that account for the lack of relationships between changes in MVPA frequencies and infection risk.2631
To the best of our knowledge, this is the first cohort study in which the infection risk was compared among patients, newly diagnosed with diabetes, with different exercise frequencies. In addition, we discovered evidence of detrimental effects of reduced exercise frequency on the risk of infection. Owing to the COVID-19 pandemic, social distancing and mass quarantine have led to increased concerns about physical inactivity and its consequences on global public health.32 Our results highlight the clinical impact and health consequences of physical inactivity and detraining among patients with diabetes. However, this study had several limitations. First, as only a few studies have been conducted to analyze the effect of detraining on infection risk, we were unable to compare our results with those of previous studies. Second, the self-reported questionnaires provided insufficient information on MVPA duration, intensity, and type (e.g., aerobic, resistance, and combined). Future studies should make use of METs, which are more accurate in the evaluation of MVPA. Third, owing to the retrospective nature of the study, the cause-effect relationship could not be established with certainty. Fourth, we could not divide the study population into those with type 1 and type 2 diabetes because of the retrospective operational definitions for diabetes. The proposed mechanisms of detrimental effects of detraining are based on changes in insulin sensitivity, which are incompatible with type 1 diabetes. As the main pathophysiology of type 1 diabetes is immune-mediated destruction of pancreatic beta cells, different results might have been obtained if such subgroup analysis were performed.33 However, given the low prevalence of type 1 diabetes among South Korean adults (approximately 0.02%), our results may be applicable to patients with type 2 diabetes.34 Finally, potential confounders might have remained in our analyses owing to the lack of detailed clinical information (e.g., dietary information and total energy intake). Even though our study included patients with newly diagnosed diabetes and was adjusted for key variables, diabetes-related complications were not sufficiently evaluated owing to the lack of detailed clinical information for diabetes, such as results of the Michigan Neuropathy Screening Instrument and carotid Doppler ultrasonography.
In conclusion, a reduction in MVPA frequency was associated with an increased risk of pneumonia among patients with newly diagnosed diabetes. For patients with diabetes, a modest level of physical activity may need to be maintained to reduce the risk of pneumonia. Further research is needed to determine the incremental and decremental effects of type-specific exercise on infection risk among patients with diabetes.
 XML Download