Journal List > Nutr Res Pract > v.17(3) > 1516082928

Kyung, Kim, and Ham: Factors affecting the willingness to pay extra for safe food

Abstract

BACKGROUND/OBJECTIVES

With the outbreak of infectious diseases, such as coronavirus disease 2019 (COVID-19), public interest in health and safety has increased, and consequently, interests in food safety have been heightened too. The purpose of this study was to compare and analyze the involvement of various categories of consumers in food safety, the subjective evaluation of food safety in Korea, and the willingness of the consumers to pay extra for safe food according to their demographic and socioeconomic characteristics.

MATERIALS/METHODS

This study used data from the 2020 Consumer Behavior Survey for Food provided by the Korea Rural Economic Institute (KREI). The subjects were 6,355 adult household members aged 19 to 75 years old. The survey was conducted from June 10th to August 21st, 2020. The data for the study were subjected to statistical analyses, including descriptive statistics, complex sample general linear model, k-means cluster, and multiple regression analyses.

RESULTS

The factors affecting the willingness to pay extra for safe food were education level, occupation, monthly household income, presence of a young (teenager) household member, and the subjects’ involvement in food safety. the significant factors affecting the willingness to pay extra for safe food were sex, age, and income level for the group exhibiting a low level of involvement in food safety, while education level and presence of a young household member were the statistically significant factors for the group exhibiting a high level of involvement in food safety.

CONCLUSION

This study verified the differences in the factors associated with the willingness to pay extra for safe food according to the demographic and socioeconomic characteristics, involvement in food safety, subjective evaluation of food safety. This study offers practical implications to the industry and government that would help in directing strategies to strengthen safe food management.

INTRODUCTION

Food safety is defined as a set of methods for handling, preparation, and storage of food aimed to preserve the quality of food to prevent contamination and food-borne illnesses [12]. Interest in food safety has increased in tandem with the concern for boosting health for better immunity and the implementation of hygiene management for preventing the spread of infectious diseases such as coronavirus disease 2019 (COVID-19) [3]. In other words, the outbreak of the COVID-19 pandemic can be regarded as one of the important factors affecting concerns about food safety. Among the various social changes brought about by the pandemic, the importance of choosing safe food is also being given an increased emphasis [45].
Food safety can cause varying levels of anxiety among consumers based on a subjective evaluation of food safety [6]. According to the Korea Rural Economic Institute (KREI), the subjective evaluation of food safety is described as “the degree to which one feels about the overall level of food safety in Korea assuming a 100 points score when food safety is perfectly managed.” [7]. There are differences in the subjective evaluation of food safety according to the demographic and socioeconomic characteristics of the consumers. It was found that women and highly educated consumers displayed higher anxiety regarding food safety [8]. Also, according to Kim et al. [9], the results of an analysis of how consumers evaluate food safety showed that they experienced higher anxiety about the safety of foods they consume (39.1%) than social anxiety (34.5%).
An increase in the frequency of occurrences of food-borne illnesses can lead to heightened consumer anxiety about food safety. Hazards that cause food safety incidents can be divided into 3 main categories; 1) microbiological hazards such as bacterial and viral pathogens, 2) chemical hazards caused by natural toxins or radioactive substances in food, and 3) physical hazards caused by a variety of foreign substances [10]. Major food safety accidents that have occurred in Korea include the following: radiation detection in Japanese food following the Fukushima nuclear disaster (2011); coliform detection in cereal products (2014); the fake Baeksuo (Cynanchum wilfordii) incident (2015); and the scandal of naked kimchi made in China (2021) [111213]. Major food safety issues that have occurred abroad include the following: incidents caused due to bacterial contamination of ingredients such as Listeria, Escherichia coli, etc.; incidents of exceeding the pesticide residue standard; problems due to packaging defects; and incidents due to improper labeling of allergens [14].
Efforts are being made by the government and the corporate sector to preemptively prevent such food safety incidents. In the case of the government, this has taken the form of the enaction of laws and implementation of policies to enhance food safety. In 2010, the Ministry of Food and Drug Safety (MFDS), Korea announced the “Regulations on the scope, investigation, and procedure of foreign substances to be reported,” which requires business operators to report consumer complaints about the presence of foreign substances in food to administrative agencies [15]. In addition, the “Imported Food Safety Management Special Act” was implemented to prevent harm to imported food and to maintain order at the distribution stage [16]. Under the regulations on restaurant hygiene grade designation and operation management, the standards and evaluation items for assessing the status of restaurant hygiene are formulated and hygiene grades are designated through on-site evaluation [1718]. Companies are also making an effort to abide by the regulations and are investing in the requisite facilities to ensure that food safety standards are met. Companies apply and operate under the “Hazard Analysis and Critical Control Point of Food and Livestock” (HACCP) for food safety management [19]. Recently, various efforts have been made to develop and apply a food safety system through the use of smart technologies such as food poisoning bacteria detection using microfluidic chips, lab-on-a-disc (LOD), a food poisoning bacteria detection method applicable to automated technology, and paper-based analytical devices (PAD) [20].
There have been several studies regarding consumer attitudes toward food safety and their willingness to pay extra to enhance food safety. Some studies on food safety have found that consumers attribute greater importance to food safety aspects such as quality certification and hygiene rather than the quantity, taste, or price of food [82122]. Also, one study investigated the consumer characteristics that influence their perceptions [823] and knowledge [24] of food safety. In another study related to the subjective evaluation of food safety the extent to which consumers’ demographic and socioeconomic characteristics, etc., affect their subjective evaluation of food safety was investigated. There have also been studies about food safety and the willingness of the consumer to pay extra for safe food. According to a study that surveyed consumers' willingness to pay extra to ensure the absence of foreign substances in food, 56.8% of respondents said they were willing to pay extra to ensure food safety. The additional charges would compensate manufacturers who incur additional costs to reduce the occurrence of foreign substances in food [25].
Food safety management is an expensive proposition. It is therefore necessary to incur costs commensurate with food safety pursuit behavior or the consumers’ intention to pay extra for safe food. Food safety pursuit behavior consciously reflects the pursuit of safety through behavior that preemptively anticipates and prevents food poisoning or food safety accidents [2627]. The consumer’s intention to pay extra for safe food indicates a willingness to pay more for food to compensate for the increase in cost caused by the equipment or systems introduced to reduce the incidence of foreign substances in food material by the food producer and distributor [2829]. It is, therefore, necessary to analyze the factors affecting the consumers’ intention to pay extra for safe food and to come up with a strategy to stimulate this willingness. However, few studies have analyzed the factors related to consumer characteristics in this context.
Therefore, the purpose of this study was to compare and analyze the involvement of consumers in food safety, subjective evaluation of food safety in Korea, and consumer willingness to pay extra for safe food according to their demographic and socioeconomic characteristics. The study further sought to evaluate the results according to the classification of consumers into various food safety interest groups. This study thus had 3 objectives; 1) to analyze the variations in the level of consumer involvement in food safety, carry out a subjective evaluation of food safety in Korea, and assessment of consumer willingness to pay extra for safe food according to their demographic and socioeconomic characteristics; 2) to analyze the differences in demographic and socioeconomic characteristics, carry out a subjective evaluation of food safety and willingness to pay extra for safe food according to the categories of food safety interest groups; 3) to investigate the factors affecting the willingness to pay extra for safe food according to the categories of food safety interest groups.

MATERIALS AND METHODS

Subjects and data collection

This study used data from the “2020 Food Consumption Behavior Survey” by the KREI [7], and it was approved for a review exemption by the Institutional Review Board (7001988-202202-HR-1478-01E).
The Food Consumption Behavior Survey has been conducted annually since 2013 by the KREI to enhance the competitiveness of food suppliers (agricultural) and the satisfaction of food consumers (consumers) [30]. The subjects of the survey were 6,355 adults aged 19 to 75 years old, and the survey was conducted using a paper or an online based self-enumeration method [31]. Samples representative of Korean consumers across the nation and various constituencies were extracted using the census output areas by Statistics Korea and the DB of KB real estate [31]. The study was conducted after obtaining consent using a consent form for the provision and use of personal information from the selected survey subjects. The data collected in this investigation were rechecked to eliminate errors thrown up through verification, coding, data input, and statistical processing. If it was not possible to rectify the errors, the data were discarded. The number of subjects who dropped out from the data collection process was not presented in the study. The survey was carried out from June 10 to August 21, 2020.

Research instrument

The questionnaires for adult household members included the following: dietary behavior, food safety, food labeling, food-related education/publicity information, food-related illnesses/remedies, food-related consumer policy, diets and lifestyles, agrifood consumer competency index, and the basic information of the respondents [31].
The three items related to food safety (involvement in food safety, subjective evaluation of food safety in Korea, and the willingness to pay extra for safe food) were measured as follows: First, the question measuring the level of involvement in food safety was “How much are you concerned and involved with food safety issues?” to be answered based on a 5-point Likert scale (“Not at all interested” to “Very interested”). In addition, by carrying out a non-hierarchical cluster analysis using the K-means method, the participants were divided into two groups based on their levels of interest and involvement in food safety; the low-interest group and the high-interest group. Second, the subjective evaluation of food safety in Korea was done in response to the question “Assuming that a score of 100 points implies that food safety is perfectly managed, how much do you evaluate the degree of the overall level of food safety in Korea?” Third, the willingness to pay extra for safe food was evaluated by the question “Are you willing to pay a higher price for safe food?” on a 5-point Likert scale from “Strongly disagree” to “Strongly agree.”
Sex, age, educational background, occupation, average monthly household income, number of household members, the presence or absence of young household members, and the administrative district (Dong/Eup/Myeon) were used as markers of the demographic and socioeconomic characteristics of the survey subjects. These were measured on a categorical statistical scale.

Statistical analysis

Data analysis was done on the SPSS 25.0 for Windows (IBM Corp, Armonk, NY, USA). A complex sampling design was used in the Food Consumption Behavior Survey. Thus, data analysis was performed based on the sum of the weighted samples, wherein the survey value of each responder was multiplied by the corresponding sample weight [32]. In this study, analysis was done using a complex sample analysis method reflecting the strata, cluster, and weights based on the characteristics of the data from the Food Consumption Behavior Survey [30].
The 4 analysis methods of this study were as follows: First, a frequency analysis was conducted to understand the general characteristics of the subjects. Second, a complex sample general linear model analysis was performed to verify the differences in the level of involvement in food safety, and a subjective evaluation was carried out of food safety based on demographic and socioeconomic characteristics. For the analysis of demographic and socioeconomic characteristics which are categorical variables, the t-test was used for 2 groups, and analysis of variance was used in the case of three or more groups. Third, the demographic and socioeconomic characteristics, the subjective evaluation of food safety, and the willingness to pay extra for safe food were compared and analyzed according to the groups of subjects classified by their levels of interest in food safety. These groups comprised the low-interest and high-interest groups categorized by performing k-means cluster analysis. Fourth, multiple regression analysis was performed using complex samples and general linear model analysis was used to identify the factors affecting the intention to pay extra for safe food. Also, the influence of the factors of demographic and socioeconomic characteristics, the level of involvement in food safety, and subjective evaluation of food safety on the intention to pay additional amounts for safe food was statistically verified. In addition, the factors affecting the willingness to pay extra for safe food were compared and analyzed by groups based on the levels of interest in food safety.

RESULTS

The profiles of the respondents

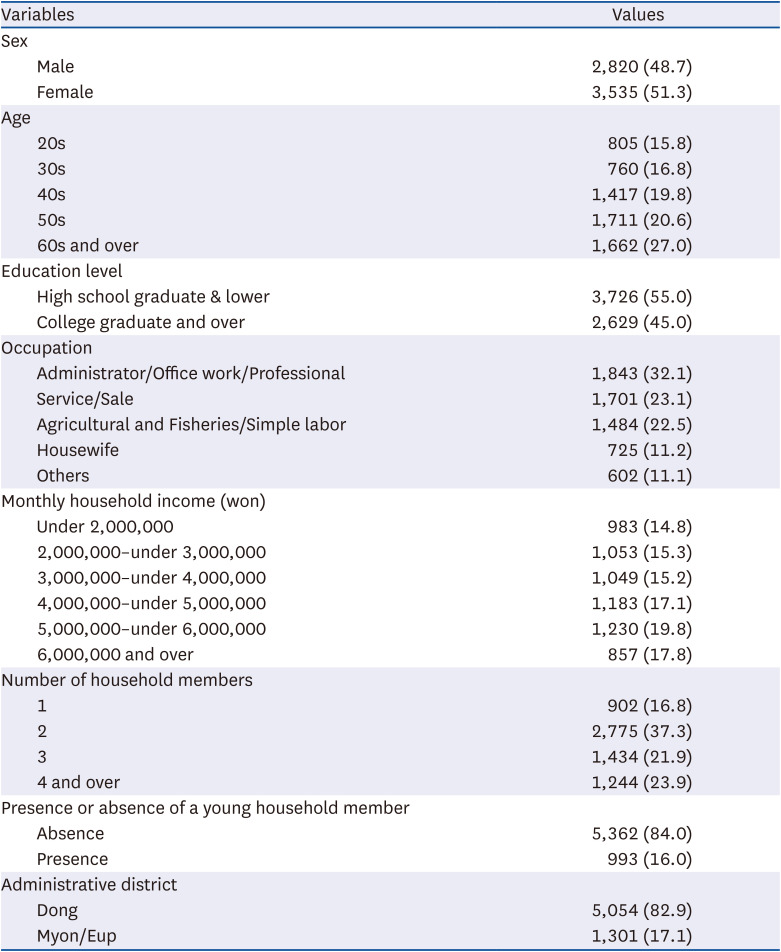
The general demographic and socioeconomic profiles of the respondents are presented in Table 1. Of the total of 6,355 survey respondents, 51.3% were female and 48.7% were male. The age groups were distributed as follows: 20–29 years (15.8%), 30–39 years (16.8%), 40–49 years (19.8%), 50–59 years (20.6%), and over 60 years (27.0%). Data on the educational background was as follows: 55.0% of respondents stated that they were high school graduates or less. The occupation of 32.1% was categorized as managerial/office/professional. In terms of average monthly household income, 19.8% of respondents earned between 5 to 6 million won. Two-person households constituted 37.3% of the subjects, 84.0% stated that they had no young household members and the majority (82.9%) were city dwellers.
Table 1

General demographic and socioeconomic characteristics of the study subjects (n = 6,355)

nrp-17-565-i001
Variables Values
Sex
Male 2,820 (48.7)
Female 3,535 (51.3)
Age
20s 805 (15.8)
30s 760 (16.8)
40s 1,417 (19.8)
50s 1,711 (20.6)
60s and over 1,662 (27.0)
Education level
High school graduate & lower 3,726 (55.0)
College graduate and over 2,629 (45.0)
Occupation
Administrator/Office work/Professional 1,843 (32.1)
Service/Sale 1,701 (23.1)
Agricultural and Fisheries/Simple labor 1,484 (22.5)
Housewife 725 (11.2)
Others 602 (11.1)
Monthly household income (won)
Under 2,000,000 983 (14.8)
2,000,000–under 3,000,000 1,053 (15.3)
3,000,000–under 4,000,000 1,049 (15.2)
4,000,000–under 5,000,000 1,183 (17.1)
5,000,000–under 6,000,000 1,230 (19.8)
6,000,000 and over 857 (17.8)
Number of household members
1 902 (16.8)
2 2,775 (37.3)
3 1,434 (21.9)
4 and over 1,244 (23.9)
Presence or absence of a young household member
Absence 5,362 (84.0)
Presence 993 (16.0)
Administrative district
Dong 5,054 (82.9)
Myon/Eup 1,301 (17.1)
Values are presented as number (%).

Food safety involvement, subjective evaluation of food safety, and willingness to pay extra for safe food according to demographic and socioeconomic characteristics

Food safety involvement according to demographic and socioeconomic characteristics

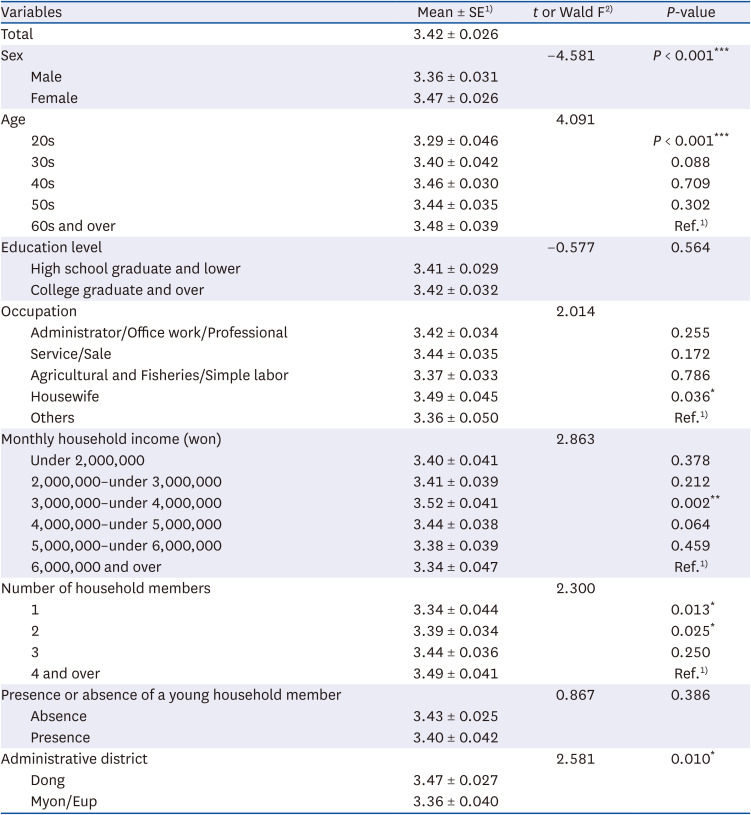
The level of involvement of the subjects in food safety according to their demographic and socioeconomic characteristics is presented in Table 2. By sex, females (3.47) had a higher level of involvement (P < 0.001) than males (3.36). According to age, those in their 60s and over had the highest score of 3.48, and those in their 20s had the lowest score of 3.29. There was a significant difference in scores between those in their 20s and those in their 60s (P < 0.001). An analysis of the occupation showed that housewives had the highest score at 3.49 points, and other occupations scored the lowest at 3.36 points. There was a significant difference in scores between housewives and other occupations (P < 0.05). In terms of monthly average household income, the group having an income of 3–4 million won had the highest score of 3.52 points, and the group with an income of 6 million won or more had the lowest score of 3.34 points. There was a significant difference in scores between the group with an average monthly household income of 3 to 4 million won and that with 6 million won or more (P < 0.01). When categorized by administrative district, the level of involvement in food safety was higher among city dwellers (Dong, 3.47) compared to those living in rural areas (Eup/Myeon) (3.36, P < 0.05).
Table 2

Involvement in food safety according to demographic and socioeconomic characteristics (n = 6,355)

nrp-17-565-i002
Variables Mean ± SE1) t or Wald F2) P-value
Total 3.42 ± 0.026
Sex −4.581 P < 0.001***
Male 3.36 ± 0.031
Female 3.47 ± 0.026
Age 4.091
20s 3.29 ± 0.046 P < 0.001***
30s 3.40 ± 0.042 0.088
40s 3.46 ± 0.030 0.709
50s 3.44 ± 0.035 0.302
60s and over 3.48 ± 0.039 Ref.1)
Education level −0.577 0.564
High school graduate and lower 3.41 ± 0.029
College graduate and over 3.42 ± 0.032
Occupation 2.014
Administrator/Office work/Professional 3.42 ± 0.034 0.255
Service/Sale 3.44 ± 0.035 0.172
Agricultural and Fisheries/Simple labor 3.37 ± 0.033 0.786
Housewife 3.49 ± 0.045 0.036*
Others 3.36 ± 0.050 Ref.1)
Monthly household income (won) 2.863
Under 2,000,000 3.40 ± 0.041 0.378
2,000,000–under 3,000,000 3.41 ± 0.039 0.212
3,000,000–under 4,000,000 3.52 ± 0.041 0.002**
4,000,000–under 5,000,000 3.44 ± 0.038 0.064
5,000,000–under 6,000,000 3.38 ± 0.039 0.459
6,000,000 and over 3.34 ± 0.047 Ref.1)
Number of household members 2.300
1 3.34 ± 0.044 0.013*
2 3.39 ± 0.034 0.025*
3 3.44 ± 0.036 0.250
4 and over 3.49 ± 0.041 Ref.1)
Presence or absence of a young household member 0.867 0.386
Absence 3.43 ± 0.025
Presence 3.40 ± 0.042
Administrative district 2.581 0.010*
Dong 3.47 ± 0.027
Myon/Eup 3.36 ± 0.040
DV: food safety involvement. A 5-point Likert-type scale from 1 (very low) to 5 (very high) was used.
1)Mean ± SE: Weighted mean ± SE.
2)t or Wald F: independent samples t-test or one-way analysis of variance F-test (ANOVA-F).
*P < 0.05, **P < 0.01, ***P < 0.001.

Subjective evaluation of food safety in Korea according to demographic and socioeconomic characteristics

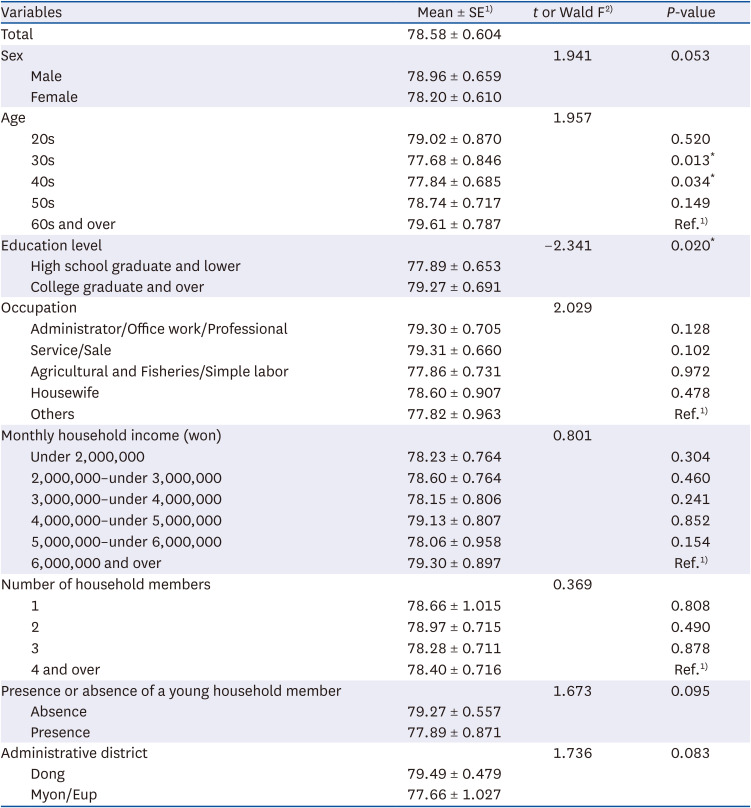
Table 3 shows the differences in the subjective evaluation of food safety in Korea according to the demographic and socioeconomic characteristics of the subjects. By age, those in their 60s and over scored the highest (79.61), and those in their 30s scored the lowest (77.68). There was a significant difference between the two age groups (P < 0.05). Based on educational background, the subjective evaluation of those who graduated from high school or higher (79.27) was higher (P < 0.05) than those who were high school graduates or lower (77.89).
Table 3

Subjective evaluation of food safety in Korea according to demographic and socioeconomic characteristics (n = 6,355)

nrp-17-565-i003
Variables Mean ± SE1) t or Wald F2) P-value
Total 78.58 ± 0.604
Sex 1.941 0.053
Male 78.96 ± 0.659
Female 78.20 ± 0.610
Age 1.957
20s 79.02 ± 0.870 0.520
30s 77.68 ± 0.846 0.013*
40s 77.84 ± 0.685 0.034*
50s 78.74 ± 0.717 0.149
60s and over 79.61 ± 0.787 Ref.1)
Education level −2.341 0.020*
High school graduate and lower 77.89 ± 0.653
College graduate and over 79.27 ± 0.691
Occupation 2.029
Administrator/Office work/Professional 79.30 ± 0.705 0.128
Service/Sale 79.31 ± 0.660 0.102
Agricultural and Fisheries/Simple labor 77.86 ± 0.731 0.972
Housewife 78.60 ± 0.907 0.478
Others 77.82 ± 0.963 Ref.1)
Monthly household income (won) 0.801
Under 2,000,000 78.23 ± 0.764 0.304
2,000,000–under 3,000,000 78.60 ± 0.764 0.460
3,000,000–under 4,000,000 78.15 ± 0.806 0.241
4,000,000–under 5,000,000 79.13 ± 0.807 0.852
5,000,000–under 6,000,000 78.06 ± 0.958 0.154
6,000,000 and over 79.30 ± 0.897 Ref.1)
Number of household members 0.369
1 78.66 ± 1.015 0.808
2 78.97 ± 0.715 0.490
3 78.28 ± 0.711 0.878
4 and over 78.40 ± 0.716 Ref.1)
Presence or absence of a young household member 1.673 0.095
Absence 79.27 ± 0.557
Presence 77.89 ± 0.871
Administrative district 1.736 0.083
Dong 79.49 ± 0.479
Myon/Eup 77.66 ± 1.027
DV: subjective evaluation of Korea’s food safety. Minimum 0 points to maximum 100 points. The higher the score, the better the food safety management is perceived.
1)Mean ± SE: weighted mean ± standard error.
2)t or Wald F: independent samples t-test or one-way analysis of variance F-test (ANOVA-F).
*P < 0.05.

Willingness to pay extra for safe food according to demographic and socioeconomic characteristics

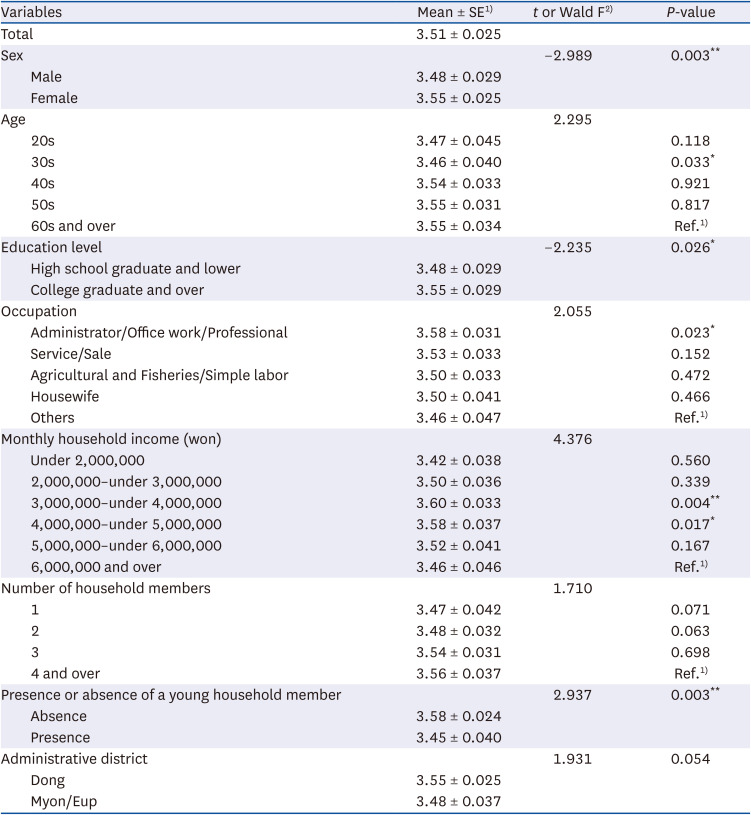
The difference in the willingness to pay extra for safe food according to demographic and socioeconomic characteristics is presented in Table 4. By sex, males scored 3.51 which was higher than the score of the females (3.48), and by age, the groups of subjects in their 50s and 60s and over showed the highest score (3.55), and the group of subjects in their 30s scored 3.46 which was the lowest (P < 0.05). By education, college graduates and over (3.55) showed a higher willingness to pay extra for safe food than those who were high school graduates or had lower levels of education (3.49, P < 0.05). Those employed as administrators, office workers, or professionals scored 3.58 which was the highest among other occupations in terms of their willingness to pay extra for safe food (P < 0.05). Subjects with income levels of 3 to 4 million won scored the highest (3.60), and the score of those having a young household member was 3.58 which was higher than those not having a young family member (3.45, P < 0.01).
Table 4

Willingness to pay extra for safe food according to demographic and socioeconomic characteristics (n = 6,355)

nrp-17-565-i004
Variables Mean ± SE1) t or Wald F2) P-value
Total 3.51 ± 0.025
Sex −2.989 0.003**
Male 3.48 ± 0.029
Female 3.55 ± 0.025
Age 2.295
20s 3.47 ± 0.045 0.118
30s 3.46 ± 0.040 0.033*
40s 3.54 ± 0.033 0.921
50s 3.55 ± 0.031 0.817
60s and over 3.55 ± 0.034 Ref.1)
Education level −2.235 0.026*
High school graduate and lower 3.48 ± 0.029
College graduate and over 3.55 ± 0.029
Occupation 2.055
Administrator/Office work/Professional 3.58 ± 0.031 0.023*
Service/Sale 3.53 ± 0.033 0.152
Agricultural and Fisheries/Simple labor 3.50 ± 0.033 0.472
Housewife 3.50 ± 0.041 0.466
Others 3.46 ± 0.047 Ref.1)
Monthly household income (won) 4.376
Under 2,000,000 3.42 ± 0.038 0.560
2,000,000–under 3,000,000 3.50 ± 0.036 0.339
3,000,000–under 4,000,000 3.60 ± 0.033 0.004**
4,000,000–under 5,000,000 3.58 ± 0.037 0.017*
5,000,000–under 6,000,000 3.52 ± 0.041 0.167
6,000,000 and over 3.46 ± 0.046 Ref.1)
Number of household members 1.710
1 3.47 ± 0.042 0.071
2 3.48 ± 0.032 0.063
3 3.54 ± 0.031 0.698
4 and over 3.56 ± 0.037 Ref.1)
Presence or absence of a young household member 2.937 0.003**
Absence 3.58 ± 0.024
Presence 3.45 ± 0.040
Administrative district 1.931 0.054
Dong 3.55 ± 0.025
Myon/Eup 3.48 ± 0.037
DV: willingness to pay extra for safe food. A 5-point Likert-type scale from 1 (very low) to 5 (very high) was used.
1)Mean ± SE: weighted mean ± standard error.
2)t or Wald F: Independent samples t-test or one-way analysis of variance F-test (ANOVA-F).
*P < 0.05, **P < 0.01.

Demographic and socioeconomic characteristics, subjective evaluation of food safety, and willingness to pay extra according to the food safety involvement groups

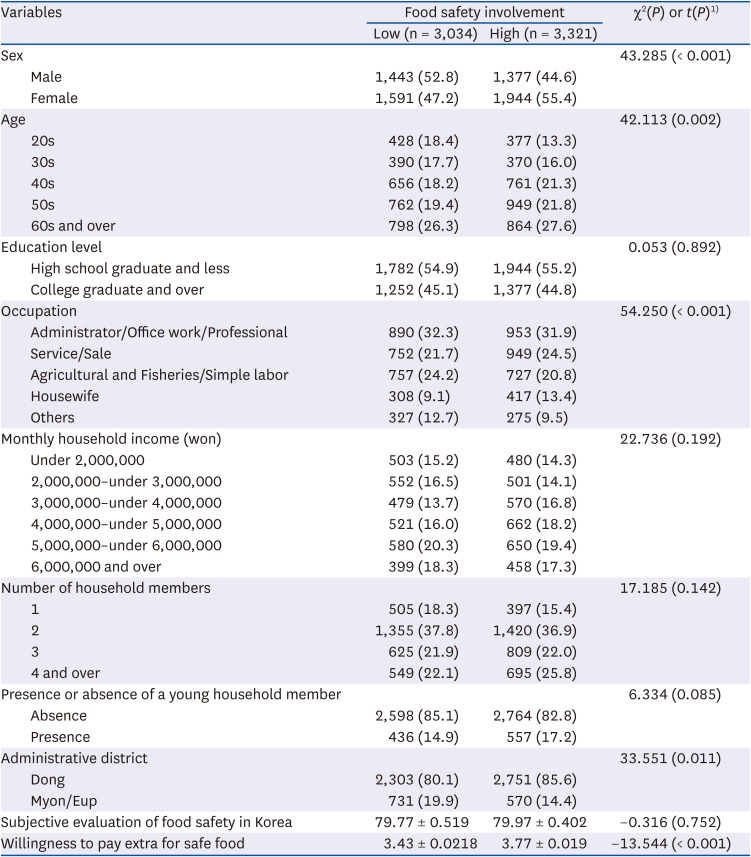
The demographic and socioeconomic characteristics, subjective evaluation of food safety, and willingness to pay extra according to the involvement in food safety are presented in Table 5. There were statistically significant differences in demographic and socioeconomic characteristics viz. sex (P < 0.001), age (P < 0.01), occupation (P < 0.001), and administrative district (P < 0.05) based on the levels of involvement in food safety. Also, there was no significant difference in the subjective evaluation of food safety but there was a significant difference in the willingness to pay extra for safe food (P < 0.001).
Table 5

Demographic and socioeconomic characteristics, subjective evaluation of food safety, and willingness to pay extra according to extent of involvement in food safety (low and high groups) (n = 6,355)

nrp-17-565-i005
Variables Food safety involvement χ2(P) or t(P)1)
Low (n = 3,034) High (n = 3,321)
Sex 43.285 (< 0.001)
Male 1,443 (52.8) 1,377 (44.6)
Female 1,591 (47.2) 1,944 (55.4)
Age 42.113 (0.002)
20s 428 (18.4) 377 (13.3)
30s 390 (17.7) 370 (16.0)
40s 656 (18.2) 761 (21.3)
50s 762 (19.4) 949 (21.8)
60s and over 798 (26.3) 864 (27.6)
Education level 0.053 (0.892)
High school graduate and less 1,782 (54.9) 1,944 (55.2)
College graduate and over 1,252 (45.1) 1,377 (44.8)
Occupation 54.250 (< 0.001)
Administrator/Office work/Professional 890 (32.3) 953 (31.9)
Service/Sale 752 (21.7) 949 (24.5)
Agricultural and Fisheries/Simple labor 757 (24.2) 727 (20.8)
Housewife 308 (9.1) 417 (13.4)
Others 327 (12.7) 275 (9.5)
Monthly household income (won) 22.736 (0.192)
Under 2,000,000 503 (15.2) 480 (14.3)
2,000,000–under 3,000,000 552 (16.5) 501 (14.1)
3,000,000–under 4,000,000 479 (13.7) 570 (16.8)
4,000,000–under 5,000,000 521 (16.0) 662 (18.2)
5,000,000–under 6,000,000 580 (20.3) 650 (19.4)
6,000,000 and over 399 (18.3) 458 (17.3)
Number of household members 17.185 (0.142)
1 505 (18.3) 397 (15.4)
2 1,355 (37.8) 1,420 (36.9)
3 625 (21.9) 809 (22.0)
4 and over 549 (22.1) 695 (25.8)
Presence or absence of a young household member 6.334 (0.085)
Absence 2,598 (85.1) 2,764 (82.8)
Presence 436 (14.9) 557 (17.2)
Administrative district 33.551 (0.011)
Dong 2,303 (80.1) 2,751 (85.6)
Myon/Eup 731 (19.9) 570 (14.4)
Subjective evaluation of food safety in Korea 79.77 ± 0.519 79.97 ± 0.402 −0.316 (0.752)
Willingness to pay extra for safe food 3.43 ± 0.0218 3.77 ± 0.019 −13.544 (< 0.001)
Values are presented as number (%) or mean ± SE.
1)χ2(P) or t(P): P-values were analyzed by complex sample χ2 test or complex sample general linear model t-test.
Specifically, in the group with a low level of involvement in food safety, the proportion of males (52.8%) was higher than that of females (47.2%). On the other hand, in the group with a high level of involvement in food safety, the proportion of females (55.4%) was higher than that of males (44.6%). Also, in the group with a low level of food safety involvement, the proportion of subjects was in the order of 60s and over, 50s, 20s, 40s, and 30s, and in the group with a high level, in the order of 60s and over, 50s, 40s, 30s, 20s. A higher proportion of participants in the group with a low level of involvement in food safety (32.3%) were administrators, office workers, and professionals compared to the high-level group (31.9%). Service and sales personnel and housewives formed a significantly higher proportion of participants in the group with a high level of involvement in food safety. As regards monthly household income levels, the group with a low level of food safety involvement showed a higher proportion of subjects with income levels of 5 to 6 million won (20.3%) and 6 million won and over (18.3%), while in the high-level group, income levels a higher proportion of subjects were in the income ranges 5 to 6 million won (19.4%) and 4 to 5 million won (18.2%). In the classification by types of administrative district, 85.6% of the group with a high level of involvement in food safety lived in “Dong” and 14.4% in “Myon/Eup.” In addition, 80.1% of the group with a low level of involvement in food safety lived in “Dong” and 19.9% in “Myon/Eup.” In other words, the group with a high level of involvement in food safety showed a higher rate of living in “Dong.”
The group with a high level of food safety involvement scored 3.77 out of 5 in their willingness to pay extra for safe food compared to the low-level group (3.43).

Factors affecting the willingness to pay extra for safe food

Analysis of the factors affecting the willingness to pay extra for safe food

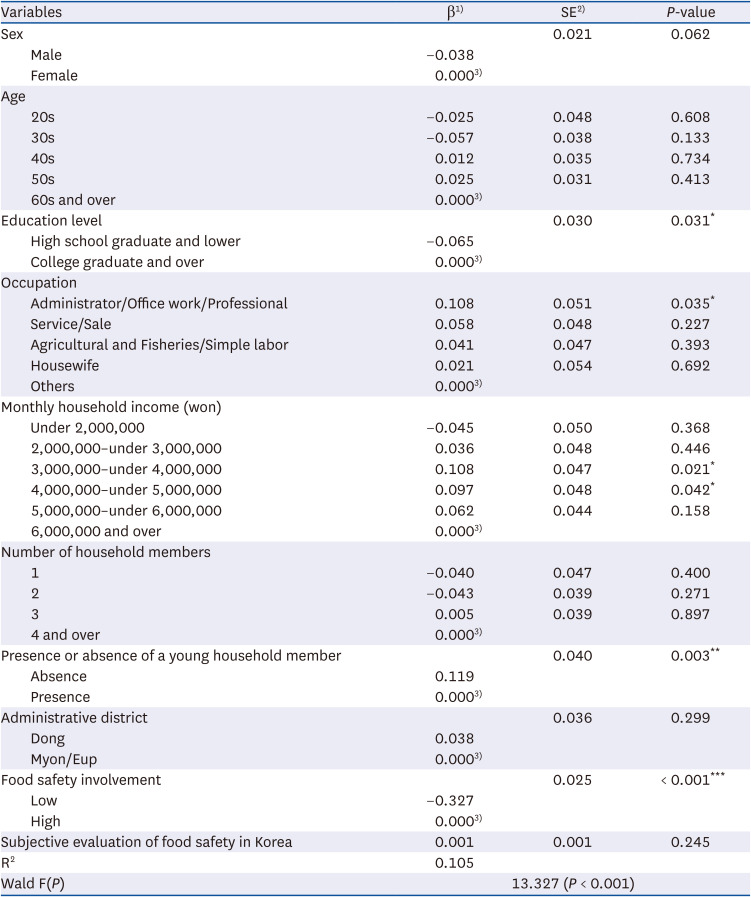
Table 6 shows the results of multiple regression analysis of the factors affecting the willingness to pay extra for safe food. Educational background, occupation, monthly household income, presence, or absence of a young household member, and food safety involvement were identified as the variables affecting the willingness to pay extra for safe food.
Table 6

Analysis of factors affecting willingness to pay extra for safe food (n = 6,355)

nrp-17-565-i006
Variables β1) SE2) P-value
Sex 0.021 0.062
Male −0.038
Female 0.0003)
Age
20s −0.025 0.048 0.608
30s −0.057 0.038 0.133
40s 0.012 0.035 0.734
50s 0.025 0.031 0.413
60s and over 0.0003)
Education level 0.030 0.031*
High school graduate and lower −0.065
College graduate and over 0.0003)
Occupation
Administrator/Office work/Professional 0.108 0.051 0.035*
Service/Sale 0.058 0.048 0.227
Agricultural and Fisheries/Simple labor 0.041 0.047 0.393
Housewife 0.021 0.054 0.692
Others 0.0003)
Monthly household income (won)
Under 2,000,000 −0.045 0.050 0.368
2,000,000–under 3,000,000 0.036 0.048 0.446
3,000,000–under 4,000,000 0.108 0.047 0.021*
4,000,000–under 5,000,000 0.097 0.048 0.042*
5,000,000–under 6,000,000 0.062 0.044 0.158
6,000,000 and over 0.0003)
Number of household members
1 −0.040 0.047 0.400
2 −0.043 0.039 0.271
3 0.005 0.039 0.897
4 and over 0.0003)
Presence or absence of a young household member 0.040 0.003**
Absence 0.119
Presence 0.0003)
Administrative district 0.036 0.299
Dong 0.038
Myon/Eup 0.0003)
Food safety involvement 0.025 < 0.001***
Low −0.327
High 0.0003)
Subjective evaluation of food safety in Korea 0.001 0.001 0.245
R2 0.105
Wald F(P) 13.327 (P < 0.001)
DV: willingness to pay extra for safe food. A 5-point Likert-type scale from 1 (very low) to 5 (very high) was used.
1)β: standardized regression coefficients.
2)SE: standard error of the coefficient.
3)Ref. means a reference group in the dummy variable.
*P < 0.05, **P < 0.01, ***P < 0.001.
In terms of demographic and socioeconomic characteristics, those with a high school diploma or lower were less willing to pay extra than those with a university degree or higher (β = −0.065, P < 0.05). Managerial/office/professional personnel had a higher willingness to pay extra than those in the other occupational groups (β = 0.108, P < 0.05). Compared with the group with a monthly household income of 6 million won or more, the groups with an income of 3-4 million (β = 0.108, P < 0.05) and 4-5 million had a lower willingness to pay extra for safe food (β = 0.097, P < 0.05). The willingness to pay extra for safe food was also higher in the group with no young household member than in the group having such a member (β = 0.119, P < 0.01). In addition, the group with a low level of involvement in food safety was less willing to pay extra compared to the high-level group (β = −0.327, P < 0.001).
Educational level, occupation, monthly household income, presence or absence of a young household member, and level of involvement in food safety explained 10.5% of the willingness to pay extra for safe food, and this model was termed suitable (Wald F = 13.327, P < 0.001).

Analysis of factors affecting the willingness to pay extra for safe food according to the level of involvement in food safety

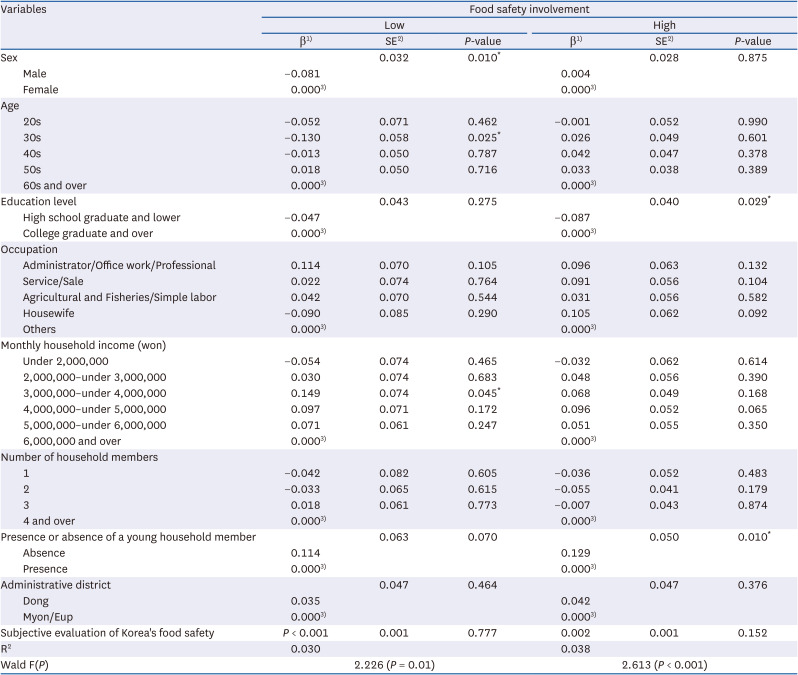
The results of multiple regression analysis of the factors affecting the willingness to pay extra for safe food according to the levels of involvement in food safety are presented in Table 7.
Table 7

Analysis of factors affecting the willingness to pay extra for safe food according to food safety involvement (n = 6,355)

nrp-17-565-i007
Variables Food safety involvement
Low High
β1) SE2) P-value β1) SE2) P-value
Sex 0.032 0.010* 0.028 0.875
Male −0.081 0.004
Female 0.0003) 0.0003)
Age
20s −0.052 0.071 0.462 −0.001 0.052 0.990
30s −0.130 0.058 0.025* 0.026 0.049 0.601
40s −0.013 0.050 0.787 0.042 0.047 0.378
50s 0.018 0.050 0.716 0.033 0.038 0.389
60s and over 0.0003) 0.0003)
Education level 0.043 0.275 0.040 0.029*
High school graduate and lower −0.047 −0.087
College graduate and over 0.0003) 0.0003)
Occupation
Administrator/Office work/Professional 0.114 0.070 0.105 0.096 0.063 0.132
Service/Sale 0.022 0.074 0.764 0.091 0.056 0.104
Agricultural and Fisheries/Simple labor 0.042 0.070 0.544 0.031 0.056 0.582
Housewife −0.090 0.085 0.290 0.105 0.062 0.092
Others 0.0003) 0.0003)
Monthly household income (won)
Under 2,000,000 −0.054 0.074 0.465 −0.032 0.062 0.614
2,000,000–under 3,000,000 0.030 0.074 0.683 0.048 0.056 0.390
3,000,000–under 4,000,000 0.149 0.074 0.045* 0.068 0.049 0.168
4,000,000–under 5,000,000 0.097 0.071 0.172 0.096 0.052 0.065
5,000,000–under 6,000,000 0.071 0.061 0.247 0.051 0.055 0.350
6,000,000 and over 0.0003) 0.0003)
Number of household members
1 −0.042 0.082 0.605 −0.036 0.052 0.483
2 −0.033 0.065 0.615 −0.055 0.041 0.179
3 0.018 0.061 0.773 −0.007 0.043 0.874
4 and over 0.0003) 0.0003)
Presence or absence of a young household member 0.063 0.070 0.050 0.010*
Absence 0.114 0.129
Presence 0.0003) 0.0003)
Administrative district 0.047 0.464 0.047 0.376
Dong 0.035 0.042
Myon/Eup 0.0003) 0.0003)
Subjective evaluation of Korea's food safety P < 0.001 0.001 0.777 0.002 0.001 0.152
R2 0.030 0.038
Wald F(P) 2.226 (P = 0.01) 2.613 (P < 0.001)
DV: willingness to pay extra for safe food. A 5-point Likert-type scale from 1 (very low) to 5 (very high) was used.
1)β: standardized regression coefficients.
2)SE: standard error of the coefficient.
3)Ref. means a reference group in the dummy variable.
*P < 0.05.
In the group with a low level of involvement in food safety, the statistically significant variables were sex (β = −0.081, P < 0.05), age (β = −0.130, P < 0.05), and income level (β = 0.149, P < 0.05) whereas education level (β = −0.087, P < 0.05) and the presence or absence of a young household member (β = 0.129, P < 0.05) were confirmed as statistically significant variables in the group with a high level of involvement in food safety.
Also, in the group with a low level of involvement in food safety, males were less willing to pay extra than females, and those in their 30s were more willing to pay extra than those in their 60s. Further, the group having an income level of 6 million won and over showed a higher willingness to pay extra than the 3 to 4 million won income group. In terms of the administrative districts, people living in the ‘Dong’ area showed a higher willingness to pay extra for safe food than those living in the ‘Myon/Eup’ area. In the group with a high level of involvement in food safety, those with a low level of education showed a lower willingness to pay extra. It was also found that the willingness to pay extra was higher when there was no young household member.

DISCUSSION

The purpose of this study was to compare and analyze the involvement of consumers in food safety, subjective evaluation of food safety in Korea, and the willingness to pay extra for safe food according to the demographic and socioeconomic characteristics of the subjects and to investigate the factors affecting the willingness to pay extra for safe food. Also, an analysis was undertaken of the demographic and socioeconomic characteristics, subjective evaluation of food safety in Korea, and the willingness to pay extra for safe food according to groups created based on levels of involvement in food safety. The conclusions of this study are as follows:
First, in the case of involvement in food safety according to demographic and socioeconomic characteristics, by sex, females (3.47) showed a higher involvement in food safety (P < 0.001) than males (3.36). By age, those in their 60s and over had the highest score of 3.48, and those in their 20s had the lowest score of 3.29 (P < 0.001). In terms of occupation, housewives showed the highest score (3.49), and other occupations showed the lowest score (3.36, P < 0.05). The group with a monthly household income of 3–4 million won had the highest score (3.52) and the 6 million won or more group had the lowest (3.34, P < 0.01). By administrative district, the level of food safety involvement was higher in the case of those living in a city area (Dong, 3.47) than those living in a rural area (Eup/Myon, 3.36, P < 0.05).
These results were similar to those of previous studies which revealed that women had a higher perception of food safety compared to men, housewives more than other occupations, and groups with an average monthly household income of 3 million won more than other income groups [8]. In addition, in a previous study that confirmed the difference in knowledge levels regarding food safety according to demographic and socioeconomic characteristics, it was found that the groups of women, groups with an average monthly household income of 2 to 4 million won, and those comprising housewives had a high level of knowledge about food safety [24], which are similar to the results of this study. According to Jung [23], when college students purchase food, 46.6% give importance to food taste, and only 19.3% consider food safety as the main factor for their purchase decision. This is similar to the results of this study wherein people in their twenties showed relatively lower interest in food safety than other age groups.
Second, the subjective evaluation of food safety in Korea according to the demographic and socioeconomic characteristics was the highest in those aged 60s and over at 79.61, and lowest at 77.68 for those in their 30s. By age, there was a significant difference between those in their 30s to 40s and those in their 60s (P < 0.05). In the results of the analysis by educational background, the group of subjects who graduated from college and over scored higher (79.27, P < 0.05) than those who graduated from high school or lower (77.89).
The subjective evaluation of food safety in Korea in this study refers to the degree to which one perceives the overall food safety level in the country when a perfectly managed food safety score is 100 points. The subjective evaluation can be indicative of consumer confidence regarding food safety. In a study by Choe et al. [33], the group with the highest degree of anxiety about food safety among housewives was those with young household members and those with a higher-level educational background. A higher score in the subjective evaluation of food safety implies low anxiety about food safety. Since, in this study, the group of subjects who had a young household member showed a lower score, and the high education group received a high score, there is a difference from the study by Choe et al. [33]. Compared with the study by Lee and Lee [34], this study had a similar result in that the group with a higher educational level displayed higher confidence in food safety. In the study by Jin et al. [35], it was observed that the residential area among the demographic and socioeconomic characteristics, satisfaction with the food labeling system, and the government’s food safety policy were factors affecting the subjective evaluation of food safety. The results of this study differed from the results of Jin et al. [35] due to a difference in the evaluation of food safety according to age and educational background. In a study by Lin and Lee [36], it was observed that an increase in the subjective evaluation of food safety had a significant effect on overall dietary satisfaction. In other words, an increase in the subjective evaluation of food safety may increase confidence in, and satisfaction with food safety.
Third, in terms of the willingness to pay extra for safe food according to demographic and socioeconomic characteristics, males were more likely to pay more than females (P < 0.01), those aged 60 or more were more willing to pay extra than those in their 30s (P < 0.05), and those who were graduates from college or higher were more willing to pay extra than those who graduated from high school or lower (P < 0.05). Administrators, office workers, and professionals (P < 0.05), those with monthly household income levels of 3 to 4 million won (P < 0.01), and families having a young household member (P < 0.05) showed a higher willingness to pay extra.
According to Park et al. [37], it was found that the group with a high interest in health showed a greater willingness to pay extra when purchasing quality certified agricultural products. Also, this attitude had a positive (+) effect on the willingness compared to the group with low interest in health. Thus, it can be seen that subjects with a high interest in health were more willing to pay extra for quality food. Health interest was found to be high when the age, education, and income levels were high [38], or when the subjects had children [39]. The results of this study are different from those of previous studies since the 3 to 4 million won income group and families without a young member showed a higher willingness to pay extra.
Fourth, the demographic and socioeconomic characteristics, subjective evaluation of food safety, and willingness to pay extra for safe food according to the groups formed based on involvement in food safety levels were as follows: There were statistically significant differences in the sex (P < 0.001), age (P < 0.01), occupation (P < 0.001) and administrative district (P < 0.05) according to the involvement in food safety. In addition, the willingness to pay extra for safe food was relatively higher in the group with a high involvement in food safety than in the group with a low involvement, and this difference was statistically significant (P < 0.001).
In the study by Yoo [40], the perception, response behavior, and satisfaction with regulations regarding genetically modified foods and food recall regulations were high in the ‘sensitive response’ group with the highest interest and involvement in food safety. High interest in food safety indicates that food safety was a prime concern of consumers while purchasing food [826]. In other words, the level of food safety involvement can be seen as a measure of the overall perception of consumers when purchasing food.
Fifth, educational background, occupation, monthly household income, the existence of young household members, and food safety involvement were found to be the variables influencing the willingness to pay extra for safe food. In terms of demographic and socioeconomic characteristics, those with a high school diploma or lower showed a lower willingness to pay extra than those with a college degree or higher (β = −0.065, P < 0.05). In the case of those in a managerial/office/professional occupation, the willingness to pay extra was higher than those in other occupational groups (β = 0.108, P < 0.05). Compared to those who had an average monthly household income of 6 million won or more, those in the 3-4 million won (β = 0.108, P < 0.05) and the 4–5 million won (β = 0.097, P < 0.05) income groups had a higher willingness to pay extra for safe food. The willingness to pay extra for safe food was higher in the group with no young household members than in the group with a young household member (β = −0.327, P < 0.01).
The educational level, occupation, monthly household income, presence or absence of a young household member, and level of involvement in food safety explained 10.5% of the willingness to pay extra for safe food, and this model was thus found suitable (Wald F = 13.327, P < 0.001).
Meanwhile, the factors affecting the willingness to pay extra for safe food by the groups based on the extent of their involvement in food safety (defined as low or high) were as follows: The statistically significant variables were sex (β = −0.081, P < 0.05), age (β = −0.130, P < 0.05), and income level (β = 0.149, P < 0.05) in the group with low involvement in food safety. Education level (β = −0.087, P < 0.05), and the presence or absence of a young household member (β = 0.129, P < 0.05) were observed to be the statistically significant variables in the group with high involvement in food safety.
Chung et al. [28] studied the willingness to pay extra to reduce the incidence of foreign substances in food, and 57.3% of the respondents stated that they would pay extra for safe food. It was identified that more people had the willingness to pay more for food safety, but the factors affecting the willingness to pay extra were not researched. However, in this study, it was confirmed that educational background, occupation, monthly household income, the presence of young household members, and involvement in food safety were factors that affected the willingness to pay extra for safe food.
In a study by Yoo [40], it was found that confirmation behavior levels with respect to food labeling, which provides a variety of information about the food, had a positive (+) effect on the willingness to pay extra. A high level of food labeling confirmation behavior indicates a high level of interest in food safety. This study had results similar to the study by Yoo [40] as it showed that the level of involvement in food safety had a positive (+) effect on the willingness to pay extra.
The willingness to pay extra for safe food can be interpreted as the attitude of consumers who are willing to pay more if food prices rise due to the establishment of a safe food management system [8]. Thus, it was observed that the attitude toward the willingness to pay extra for safe food varied according to the characteristics of the consumers. Therefore, in this study, the consumer characteristics influencing food safety involvement and the factors affecting the willingness to pay extra for safe food were derived.
The institution of government policies relating to food safety and the installation of systems for food safety management by the industry can result in a safe food production and distribution environment. However, this requires investment in facilities and equipment which increases costs for companies and thereby leads to an increase in product prices. Therefore, there is a need to change the attitude of the consumers to make them willing to pay extra for safe food. Thus, various consumer education and publicity programs should be formulated to improve consumers’ awareness of food safety and to induce interest in that direction. Specifically, food safety education that reflects consumer characteristics or publicity and campaigns involving public participation can be considered.
The academic implications of this study include the verification of the influence of various variables that can identify consumers’ characteristics, such as demographic and socioeconomic characteristics, perceptions of food safety, and food safety involvement. Specifically, the differences in involvement in food safety, which had the greatest influence on the willingness to pay extra for safe food, were verified for each group. This is believed to be a precedent study involving in-depth analysis that identified factors that can increase the willingness to pay extra for safe food according to the level of involvement in food safety. At the same time, this study has implications for the industry as it has analyzed various consumer characteristics regarding food safety perceptions and the willingness to pay extra for safe food.
The limitations of this study are as follows: Food safety variables such as involvement in food safety, subjective evaluation of food safety, and the willingness to pay extra for safe food, can be considered to be directly related to health. Therefore, in the future, a study on the relationship of the above with health-related variables is also required. In addition, it is necessary to provide inputs for the formulation of marketing strategies by companies by confirming the consumer intention to pay extra for each food item.
This study verified the demographic and socioeconomic characteristics, involvement in food safety, evaluation of food safety, and the willingness to pay extra for safe food, and it presents basic data for policy-making and cost budgeting to strengthen food safety management.
Notes

Conflict of Interest: The authors declare no potential conflicts of interests.

Author Contributions:

  • Conceptualization: Ham S.

  • Formal analysis: Kyung M.

  • Investigation: Kyung M.

  • Methodology: Kim D, Ham S.

  • Validation: Ham S.

  • Writing - original draft: Kyung M, Kim D.

  • Writing - review & editing: Ham S.

References

1. Song YJ, Yoo HJ. The covariance structural analysis of perceived risk on food safety consciousness and food safety pursuit between seoul & shanghai consumers: focused on food consumption. J Consum Stud. 2008; 19:215–244.
2. Yoon YY, Kim KJ. A qualitative study on consumers' perceptions of food safety risk factors. J Korean Home Manag Assoc. 2013; 19:15–31.
3. Kim OH. The effects of health beliefs and prevention behavior intentions on eating out during the COVID-19 pandemic: applying a health belief model. Int J Tour Hosp Res. 2020; 34:169–185.
4. Galanakis CM. The food systems in the era of the coronavirus (COVID-19) pandemic crisis. Foods. 2020; 9:523. PMID: 32331259.
5. Park JH, Jo SJ. The effect of health concern on heal care behavior: Focused on moderating effect of the cooking shows information acceptance. Culin Sci Hosp Res. 2021; 27:80–89.
6. Choi KS, Kim JE. The relationship of consumer anxiety of food hazard, and food consumer information literacy with dietary life satisfaction. J Rural Dev. 2020; 43:91–116.
7. Korea Rural Economic Institute. 2020 Food consumption behavior survey [Internet]. Naju: Korea Rural Economic Institute;2021. cited 2022 February 9. Available from: http://www.krei.re.kr/ .
8. Kim HA, Jung HY. A study of consumer perceptions of food safety and food buying behavior. Culin Sci Hosp Res. 2018; 24:93–103.
9. Kim JS, Song TM, Lee NH, Sim BR. Strategy Formulation Plan for Public Health and Safety. Sejong: Korea Institute for Health and Social Affairs;2015. p. 16–46.
10. World Health Organization. Who global strategy for food safety: safer food for better health. Geneva: World Health Organization;2002. p. 9–13.
11. Kim JS, Song TM, Lee NH, Sim BR. Strategy formulation plan for public health and safety. KIHASA R&D Report. Sejong: Korea Institute for Health and Social Affairs;2015. p. 16–46.
12. Ministry of Food and Drug Safety. Radioactive Safety Information for Imported Food: Restrictions on Import of Food from Japan [Internet]. Cheongju: Ministry of Food and Drug Safety;2020. cited 2022 February 9. Available from: https://radsafe.mfds.go.kr/ .
13. YTN Plus. Controversy over Chinese pickled cabbage... Ministry of Food and Drug Safety “Strengthen safety management” [Internet]. Seoul: YTN Plus;2021. cited 2022 February 9. Available from: https://www.ytn.co.kr/ .
14. Ministry of Agriculture, Food and Rural Affairs. Investigation of Food Safety Accidents and Import Sanitation Standards in Major Countries. Sejong: Ministry of Agriculture, Food and Rural Affairs;2017. p. 3–9.
15. Ministry of Food and Drug Safety. Regulations on scope, investigation and procedure of reporting foreign substance [Internet]. Cheongju: Ministry of Food and Drug Safety;2019. cited 2022 February 9. Available from: https://www.law.go.kr/ .
16. Ministry of Food and Drug Safety. Special Act on Imported Food Safety Control [Internet]. Cheongju: Ministry of Food and Drug Safety;2021. cited 2022 February 9. Available from: https://www.law.go.kr/ .
17. Ministry of Food and Drug Safety. Regulations on restaurant hygiene grade designation and operation management [Internet]. Cheongju: Ministry of Food and Drug Safety;2021. cited 2022 February 9. Available from: https://www.law.go.kr/ .
18. Ministry of Food and Drug Safety. Notification of restaurant hygiene grade designation (22. 2. 4. Notice) [Internet]. Cheongju: Ministry of Food and Drug Safety;2022. cited 2022 February 9. Available from: https://www.mfds.go.kr/ .
19. Ministry of Food and Drug Safety. Hazard analysis and critical control point of food and livestock [Internet]. Cheongju: Ministry of Food and Drug Safety;2021. cited 2022 February 9. Available from: https://www.law.go.kr/ .
20. Lim MC, Woo MA, Choi SW. Current status of food safety detection methods for Smart-HACCP system. Food Sci Ind. 2021; 54:293–300.
21. Kim S, Huh KO. A study on food consumption life style of main food buyer, food safety consciousness, environmental consciousness and eco-friendly food consumption. J Consum Cult. 2019; 22:23–44.
22. Kim KD, Lee JY. A survey on the housewives’ purchasing behavior and needs for food safety information. J Korean Soc Food Sci Nutr. 2010; 39:392–398.
23. Jung HY. Study of students’ perception of food safety and food purchasing behavior. Korean J Community Living Sci. 2018; 29:247–257.
24. Jun SM. The influence of consumer anxiety about food hazards on food label use and safe food purchase: focusing on the difference test by knowledge level of safety labeling. J Consum Cult. 2017; 20:87–108.
25. Jung KH, Jung JW, Yoon SM, Shin JH, Kim JS, No JW, Jang HG, Lee Y. A study on willingness to pay survey and development educational material for consumers about foreign matters in food. MFDS R&D Report. Cheongju: Ministry of Food and Drug Safety;2010. p. 149–151.
26. Lee YA. Determinants of consumers’ awareness, satisfaction and trust of food labeling. Consum Policy Educ Rev. 2019; 15:97–122.
27. Ryu MH. A study on safety pursuit behavior and safety information needs for processed food - focused on adolescent consumers. Consum Policy Educ Rev. 2014; 10:59–82.
28. Chung KH, Jeong JW, Yoon SM, Shin JH, Kim JS, Noh JW, Chang HG, Lee Y. A study on willingness to pay survey and development educational material for consumers about foreign matters in food. MFDS R&D Report. Cheongju: Ministry of Food and Drug Safety;2010. p. 229–232.
29. Yang SB, Yang SR. Analysis of benefit and cost on management of foreign matters in food. Korean J Food Mark Econ. 2013; 30:73–92.
30. Korea Rural Economic Institute. Food consumption behavior survey raw data user guide [Internet]. Naju: Korea Rural Economic Institute;2021. cited 2022 February 9. Available from: http://www.krei.re.kr/ .
31. Korea Rural Economic Institute. The consumer behavior survey for food 2020 [Internet]. Naju: Korea Rural Economic Institute;2020. cited 2022 February 9. Available from: http://www.krei.re.kr/ .
32. Korea Rural Economic Institute. Food consumption behavior survey: sample composition and weights [Internet]. Naju: Korea Rural Economic Institute;2022. cited 2022 February 9. Available from: http://www.krei.re.kr/ .
33. Choe JS, Chun HK, Hwang DY, Nam HJ. Consumer perceptions of food-related hazards and correlates of degree of concerns about food. J Korean Soc Food Sci Nutr. 2005; 34:66–74.
34. Lee YH, Lee SS. Consumer trust and food safety pursuit behavior by purchase stage. J Consum Cult. 2011; 14:5–26.
35. Jin HJ, Lim JY, Lee KI. The sentiment index of consumers about food safety and analysis for influential factors. J Consum Policy Stud. 2014; 45:1–21.
36. Lin HB, Lee SS. A study of Korean consumers on dietary satisfaction to sentiment index about food safety: focusing on moderating effects of reliance to food safety information. J Korean Home Manage Assoc. 2016; 34:15–26.
37. Park MS, Lee BJ, Ham S. Comparison of consumer’s perceptions of quality certified agricultural products by consumer’s health-concern and environmental concern. J Foodserv Manag. 2014; 17:107–132.
38. Kim EJ, Hwang SS, Park JM, Lee HI. A study on health promotion behaviors of a group of middle aged men in K-Ku, Incheon City. J Korean Acad Community Health Nurs. 2004; 15:408–418.
39. Lee SY, Kim IH, Jang JH. A study on the relationship between health concern and purchase behavior of the environmental friendly agricultural products. Korean J Local Gov Adm Stud. 2011; 25:77–100.
40. Yoo HJ. The effects of concerns on food safety and trust in label information on label use and willingness to pay among Korean consumers. Crisisonomy. 2016; 12:167–177.
TOOLS
Similar articles