

 PDF
PDF Citation
 Print
Print


INTRODUCTION
Eating behavior is a broad term encompassing food choices and motives, feeding practices, dieting, and eating-related problems, such as obesity, eating disorders, and feeding disorders [1]. Various biological, physical, social, and economic determinants affect eating behavior. Meal companions are an important social determinant, and are related to what and how much people eat as well as the communicative function within the social context.
Where meals are consumed and whether one eats with others may affect food choice. A previous study of diet quality focused on family eating. In children and adolescents, family eating has been consistently associated with healthy dietary outcomes [23]. These outcomes included the following: high diet quality scores [45]; high intake of fruit [678], vegetables [789], and dairy foods [789]; lower intake of fried foods [7] and sugar-sweetened beverages [710]; less frequent breakfast and lunch skipping [411]. On the other hand, adults showed mixed findings [21012131415].
Recent research focused on eating alone rather than family eating, particularly in older adults. A higher frequency of eating alone has also been associated with less healthy tendencies in dietary habits [16] and lower diet quality and variety [1718]. However, a study of 6,094 community-dwelling older Japanese women showed that eating alone most of the time was not associated with the Healthy Eating Index (HEI)-2010 scores [19].
Only one study has examined the association between commensality and diet quality in Korean adults [16]. Lee et al. [16] identified that a higher frequency of eating alone in Korean adults showed an unhealthier tendency in dietary habits. Their study had the following limitations: the age of the study subjects was 20–50 years; the diet quality was evaluated using the mean adequacy ratio; the dimensions of diet quality were not evaluated.
Most people eat at least one or two meals in the company of others, primarily their spouses or other family members, depending on their age, work, and housing situation [2021]. With the recent increase in single-person households and lifestyle changes, the form of meal companions has also diversified. Considering these points, more study is needed to classify the types of meal companions in more detail and use the Korean Healthy Eating Index (KHEI) to provide the overall diet quality and component scores. Thus, this study examined the difference in diet quality according to the type of meal companion and which components of the KHEI lead to a difference in the overall diet quality.
SUBJECTS AND METHODS
Data and study population
This cross-sectional study used data from the 6th Korea National Health and Nutrition Examination Survey (KNHANES), which includes health interviews, behavioral and nutritional surveys, and a health examination. The KNHANES VI was approved by the Institutional Review Board (IRB) of the Korea Centers for Disease Control and Prevention (approval number: 2013-07CON-03-4C and 2015-01-02-6C), and written informed consent was obtained from all the participants [22]. Details of the study design and method are reported elsewhere [23].
Among 18,034 adults aged 19 or older who participated in the 6th KNHANES, those who did not participate in all studies, including health interviews, behavioral and nutritional surveys, and a health examination study (n = 2,886), those who did not answer the question about eating companions (n = 58), and those who did not provide the KHEI score (n = 69) were excluded. Finally, 15,074 adults (6,180 men and 8,894 women) were included in the analysis.
Dietary assessment, KHEI, and classification of meal companion
The total daily energy and nutrient intake were assessed using a validated food frequency questionnaire (FFQ) [24] and a 24-h recall from a nutritional survey by a trained nutritionist. The KHEI scores were calculated using the FFQ data. The standards and methods for calculating the KHEI score are described elsewhere [2526]. Briefly, the KHEI consists of 14 components: eight adequacy components (breakfast, whole grains, fruits, vegetables, meat/fish/eggs and beans, and milk and dairy), three moderation components (saturated fatty acids, sodium, and sweets and beverages), and three balance components (carbohydrates, total fat, and energy). The maximum scores for the total were 100 points, and higher total and component KHEI scores indicate better compliance with the diet recommendations of the dietary guidelines for Koreans [26].
The usual meal companions were measured by the question, “Have you had breakfast, lunch, and dinner with others over the past year?” If the participant answered yes, there was an additional question about dining with someone other than their family members [23]. The participants were classified into four groups based on the answers to this question: 1) Ordinary group, mixed type such as eating with family members, other people or eating alone; 2) Family eating group, an individual who always eats with family members; 3) Eating with others group, an individual who always eats with others than a family; and 4) Eating alone group, a person who always eats alone.
Assessment of covariates
The health interview and behavior surveys consisted of sociodemographic and lifestyle factors, including age, sex, presence of a spouse, family income, household type, smoking status, alcohol consumption, and physical activity [26]. Family income was categorized as < 100 × 104 (Korean currency; 1 dollar = 1,194 won), 100–199 × 104, 200–299 × 104, 300–399 × 104, 400–499 × 104, and ≥ 500 × 104 won/month. Alcohol consumption was divided into 4 groups according to the average amount of alcohol consumed per day: none, 1–14.9 g/day, 15–29.9 g/day, and ≥ 30 g/day. Smoking status was classified as current smoker, ex-smoker, and never smoker. The total weekly metabolic equivalent of the task energy expenditure was calculated using the Global Physical Activity Questionnaire (GPAQ) [27].
The health examination study contained anthropometric, blood pressure, and biochemical measurements [26]. Height and body weight were measured, and the body mass index (BMI) was computed as weight (kg) divided by the square of the height (m2). Blood pressure was measured three times in a sitting position using a standardized mercury sphygmomanometer. The average of the last two measurements was recorded as the blood pressure. Hypertension was defined as blood pressure ≥ 140 mmHg systolic or ≥ 90 mmHg diastolic or currently taking antihypertensive medications. The fasting blood sugar (FBS) and total cholesterol (TC) were analyzed using the enzyme-linked immunosorbent assay method (COBAS 8000 C702; Roche, Rotkreuz, Switzerland). Type 2 diabetes was defined as FBS levels of ≥ 126 mg/dL or the use of insulin or oral glucose-lowering medication. Hypercholesterolemia was defined as TC levels of ≥ 240 mg/dL or taking cholesterol-lowering medications.
Statistical analysis
Survey sample analyses were performed using weight considering the complex survey design [28]. The means with SEs for continuous variables and the frequency (%) for categorical variables were reported. Differences between the groups were tested using a survey regression analysis for the continuous variables and a χ2 test for the categorical variables. Survey multivariate linear regression analysis was used to assess the association of the meal companion type and nutrient intake or KHEI scores after adjusting for age, spouse, BMI, smoking status, family income, total weekly physical activity, daily alcohol intake, presence of type 2 diabetes, hypertension, and hypercholesterolemia. Post-hoc analyses using the Bonferroni adjustment were implemented to examine the specific differences among the groups. Stratified analysis was performed to explore further the independent risk associated with the meal companion types and specific sociodemographic factors, such as age, presence of occupation, and presence of a spouse. Test for effect modification was conducted by including the cross-product term between categorical terms for meal companion types and stratification factors in the multivariate model. In sensitivity analysis, we additionally or alternatively adjusted for the presence of occupation or monthly income per household member in multivariate models. All statistical analyses were carried out using the STATA statistical analysis package (version 14.2; Stata Corp., College Station, TX, USA). A P-value < 0.05 was considered significant.
RESULTS
Characteristics of the study subjects
The percentage of each meal companion type, i.e., ordinary, family eating, eating alone, and eating with others group was 65.3%, 16.4%, 8.3%, and 10.0% in men and 64.4%, 18.1%, 13.0%, and 4.5% in women, respectively. The mean KHEI score was 61.7 ± 0.22 in men and 64.8 ± 0.20 in women, respectively.
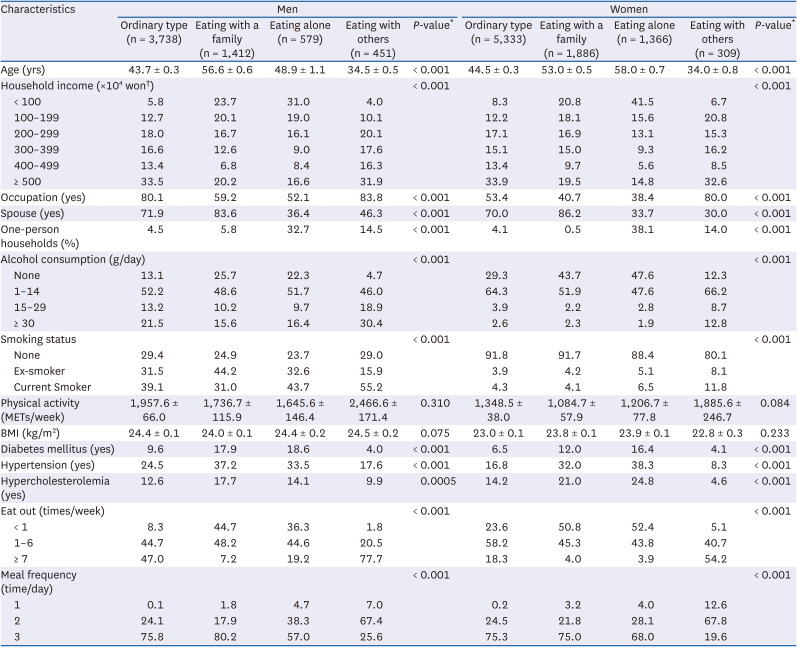
Table 1 lists the general characteristics of the study subjects according to the type of meal companions. The eating with others group was relatively young, consumed more alcohol, had a higher proportion of current smokers, ate out more often, and was less likely to eat three meals a day in both men and women. In contrast, the family eating group was older and had a higher frequency of having a spouse and comorbidities, such as diabetes, hypertension, and hypercholesterolemia. The eating alone group showed a higher proportion of lower income and comorbidities, and a lower proportion of having a spouse.
Table 1
General characteristics of study subjects according to the type of meal companion
KHEI according to the type of dining companion
Fig. 1 presents the total KHEI scores according to the type of dining companion. People who exclusively ate with someone other than family or exclusively ate alone had lower total KHEI scores in both men (57.23 ± 0.67, 58.56 ± 0.73 vs. 62.71 ± 0.26) and women (57.63 ± 0.97, 63.89 ± 0.58 vs. 65.79 ± 0.22) when compared to persons with ordinary type. In particular, women who ate with others showed the lowest total KHEI score (57.63 ± 0.97).
Fig. 1
Multivariate adjusted total scores of KHEI by the type of dining companion and sex.
The models were adjusted for age, BMI, family income level, smoking status, daily alcohol intake, total weekly physical activity, total daily energy intake, spouse, type 2 diabetes, hypertension, and hypercholesterolemia. Higher scores indicate a better diet quality
KHEI, Korean Healthy Eating Index; BMI, body mass index.
a-cDifferent superscripts are significantly different at the P-value < 0.05 by the Bonferroni-adjusted test.
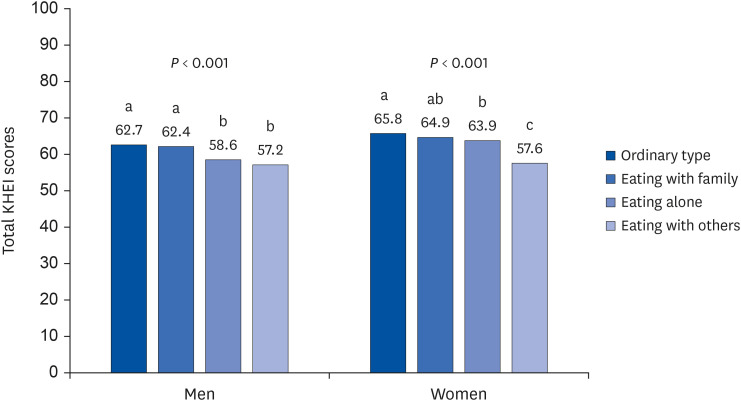
Table 2 lists the mean score of the components of KHEI by the type of dining companion after adjusting for all potential confounders. Men and women who exclusively ate with someone other than family had lower KHEI component scores for breakfast (men, 4.53 ± 0.22 vs. 7.57 ± 0.07, 7.51 ± 0.13; women, 4.06 ± 0.24 vs. 7.71 ± 0.06, 7.56 ± 0.12), whole grains (men, 1.33 ± 0.1 vs. 2.30 ± 0.05, 2.58 ± 0.09; women, 1.73 ± 0.14 vs. 2.37 ± 0.04, 2.36 ± 0.07), and fruit excluding juice (men, 1.80 ± 0.12 vs. 2.12 ± 0.05, 2.28 ± 0.10; women, 2.37 ± 0.17 vs. 2.93 ± 0.04, 2.91 ± 0.08) compared to the ordinary group and family eating group. Compared to the eating alone group, the component scores for breakfast (men, 4.53 ± 0.22 vs. 6.22 ± 0.22; women, 4.06 ± 0.24 vs. 6.67 ± 0.16) and whole grains (men, 1.33 ± 0.1 vs. 1.97 ± 0.12; women, 1.73 ± 0.14 vs. 2.39 ± 0.09) in both men and women and those for milk and dairy (3.27 ± 0.31 vs. 3.99 ± 0.19) and empty calorie foods (8.42 ± 0.25 vs. 9.22 ± 0.10) in women were lower in the eating with others group.
Table 2
Comparison of KHEI component scores by the type of meal companion
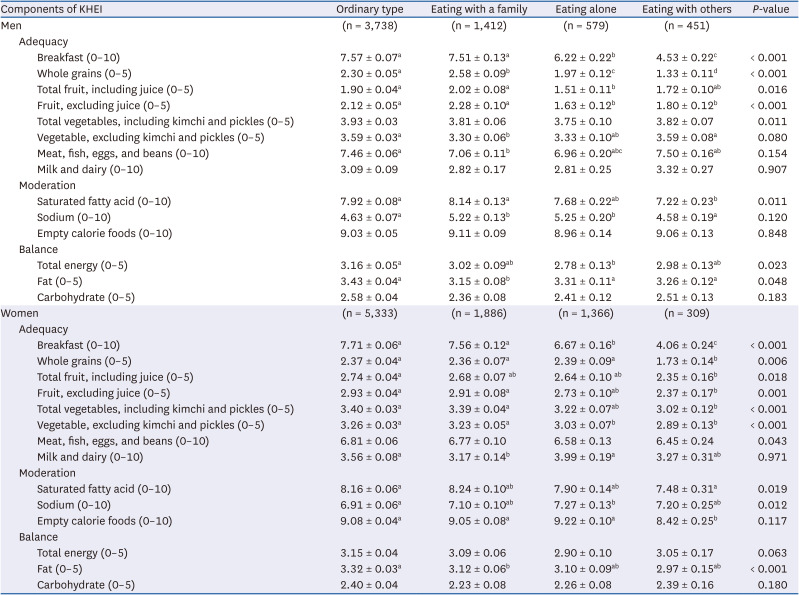
Adjusted means ± SE and P-values for mean differences between 4 groups were calculated using multivariate linear regression after adjusting for age, BMI, family income level, smoking status, daily alcohol intake, total weekly physical activity, total daily energy intake, spouse, type 2 diabetes, hypertension, and hypercholesterolemia.
KHEI, Korean Healthy Eating Index; BMI, body mass index.
*Higher scores indicate a better dietary state of each item.
a-dDifferent superscripts are significantly different at the P-value < 0.05 by the Bonferroni-adjusted test.
Men eating alone showed higher KHEI component scores for sodium (5.25 ± 0.20 vs. 4.63 ± 0.07) and lower scores for breakfast (6.22 ± 0.22 vs. 7.57 ± 0.07), whole grains (1.97 ± 0.12 vs. 2.30 ± 0.05), total fruit (1.51 ± 0.11 vs. 1.90 ± 0.04), fruit excluding juice (1.63 ± 0.12 vs. 2.12 ± 0.05), and total energy (2.78 ± 0.13 vs. 3.16 ± 0.05) than the common ordinary pattern. Women who always ate alone had lower scores for breakfast (6.67 ± 0.16 vs. 7.71 ± 0.06) and vegetables, excluding kimchi and pickles (3.03 ± 0.07 vs. 3.26 ± 0.03), and higher KHEI component scores for sodium (7.27 ± 0.13 vs. 6.91 ± 0.06) compared to the common ordinary group.
The family eating group showed lower HEI components scores for vegetables, excluding kimchi and pickles (3.30 ± 0.06 vs. 3.59 ± 0.03), meat, fish, eggs, and beans (7.06 ± 0.11 vs. 7.46 ± 0.0), and fat (3.15 ± 0.08 vs. 3.43 ± 0.04) in men and milk and dairy (3.17 ± 0.14 vs. 3.56 ± 0.08) and fat (3.12 ± 0.06 vs. 3.32 ± 0.03) in women compared to the common ordinary group.
Subgroup and sensitivity analysis
Subgroup analysis revealed the interactions between the meal companion type and age, presence of occupation, and presence of a spouse (all P-interaction < 0.001) (Table 3).
Table 3
Subgroup analysis of the multivariate-adjusted total scores of KHEI by the type of meal companion and sex
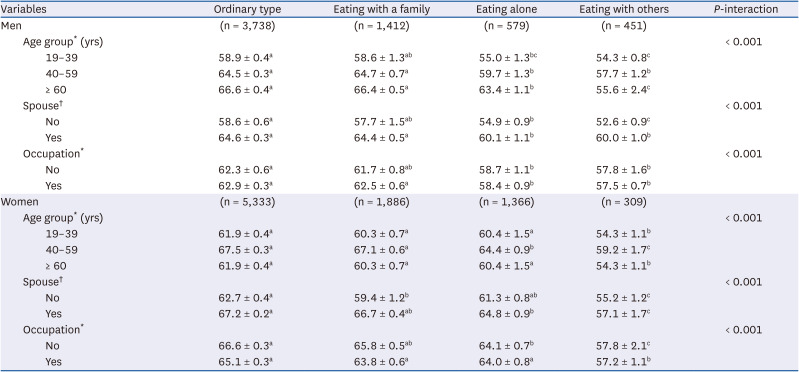
Values are adjusted means ± SE calculated using multivariate linear regression.
KHEI, Korean Healthy Eating Index; BMI, body mass index.
*Adjusted for age, BMI, family income level, smoking status, daily alcohol intake, total weekly physical activity, total daily energy intake, spouse, type 2 diabetes, hypertension, and hypercholesterolemia.
†Adjusted for age, BMI, family income level, smoking status, daily alcohol intake, total weekly physical activity, total daily energy intake, type 2 diabetes, hypertension, and hypercholesterolemia.
a-cDifferent superscripts are significantly different at the P-value < 0.05 by the Bonferroni-adjusted test.
In particular, the eating with others group in all subgroups showed significantly lower KHEI scores than the common ordinary group. Sensitivity analyses showed that additional or alternative adjustments for occupation or monthly income per household member in multivariate models also yielded similar results (data not shown).
DISCUSSION
This study examined whether the type of meal companion and important social aspects of eating were associated with diet quality using a validated KHEI in a representative sample of Koreans. The diet quality differed according to the meal companion type. Low diet quality scores were identified in men who always ate alone or in both men and women who always ate with others compared to the ordinary type. The low quality of diet in these groups resulted from the score differences in the adequacy and moderation component of KHEI.
These contrasted with previous studies showing a higher diet quality in individuals eating with others [1329]. There is a methodological difference in that meals with family members were combined in a group eating with others, and a person eating alone was classified as a reference group. Hence, caution is needed when comparing them directly. The distinguishing feature of this study was that people who always eat with people other than their families were classified into individual groups.
The diet quality was affected differently by whether a meal companion was a family member or not. People who always ate with others had a lower diet quality. The main differences mostly occurred in the adequacy items, i.e., saturated fatty acids and sugars, sweets, and beverages (only in women). Both men and women eating with others ate less breakfast and had a lower whole grain and fruit intake (excluding juice) but a higher intake of saturated fat. In women, the score of fresh vegetables was low, which was associated with low dietary fiber intake (Supplementary Table 1). Both men and women eating with others had the highest percentage of fiber, iron, and vitamin C intake, less than the estimated average requirement (EAR). Men eating with others showed a higher frequency of energy more than 125% of the estimated energy requirement (EER). On the other hand, women eating with others showed a higher frequency of energy less than 75% of EER (Supplementary Table 2). This can suggest what food group targets to prioritize to improve the diet quality in this group.
In this study, there were differences in age, spouse, occupation, income level, health status, current disease, and dietary behavior by type of companion meal. Subjects who ate all meals with others tended to be young, less likely to have a spouse, more likely to be workers or in single-person households, to have less healthy behaviors, and to eat out frequently. Even when these factors were adjusted in the statistical model, they might not have been sufficient. Hence, caution is needed to interpret the results. Previous studies have shown that diet quality varies with age and living arrangements [30]. Young adults tended to be low in diet quality [31]. They were likely to eat out more frequently to choose deliciously, more fat-, sugar-, and salt-oriented palatable food rather than healthy when deciding on a menu [323334]. In this study, however, the total KHEI score of young adults was higher than that of the elderly in all meal companion types. Furthermore, those in their 60s and older had the lowest KHEI scores despite the very low rate of eating with others (Table 3). In subgroup analysis, the presence of an occupation or spouse, which causes differences in opportunities to eat with others or family members, affected the relationship between meal companion type and diet quality (all P-interaction < 0.05; Table 3). Even considering various sociodemographic characteristics, the fact that measures are needed to improve the meal quality of adults eating with others remains unchanged because a low-quality diet will cause health problems in the future. Therefore, interventions are needed to choose healthy foods and establish healthy eating habits, which can provide many benefits and contribute to a healthy lifestyle in adults.
Family meals in men showed better quality than men with eating alone. Women showed better scores for breakfast and vegetables, excluding kimchi eating in a family eating group compared to eating alone, but the total KHEI scores were not different between the two groups. This was consistent with Pachucki et al. [13], which showed a gender difference in that the higher the frequency of meals at home, the higher the diet quality score in men but not in women.
Given social facilitation, eating with other people (i.e., friends, neighbors, or co-workers) is a great way to connect and add enjoyment to life. A meta-analysis of 42 studies on social facilitation found that people eat more food when eating with familiar others than when eating alone. This social facilitation was not observed across studies that examined eating among groups of strangers or acquaintances [35]. In the present study, it was impossible to distinguish whether others were intimate persons.
There was a gender difference in diet quality in eating alone groups, i.e., the lower quality in men but not women. This was consistent with the study of 6,094 community-dwelling older Japanese women, which showed that eating alone most of the time was not associated with the HEI-2010 scores [19]. In another Japanese study, including 856 community-dwelling elderly aged ≥ 65, eating alone was a barrier to food diversity compared to eating with others [36]. The author’s previous study showed that men eating alone showed an increased risk of metabolic syndrome but not women [37], suggesting the possibility that gender differences in diet quality may have contributed in part to the different health outcomes between men and women.
The strength of this study is that the overall diet quality score according to the nationwide dietary guidelines and the components that cause the difference were evaluated comprehensively using the data from representative samples. Second, the advantage of this study, which was different from previous studies, was that the type of meal companion was classified in detail, i.e., whether it was a family member or someone other than a family member. Third, this study adjusted for possible confounders in the relationship between meal companion type and diet quality.
The present study had some limitations. The study was a cross-sectional design in which causality could not be determined. Residual confounding could not be excluded, despite finely adjusted for potential confounding factors, with detailed information on social, lifestyle, and health-related factors. For example, the influence of household type on eating behavior may be different, but subgroup analysis by the presence of single-person households could not be performed. Further investigation will be needed to identify the health-related behaviors, living conditions, and sociodemographic factors that each group should modify.
This study showed that the diet quality differed according to the meal companion type, and low diet quality scores were identified in people who always ate with others and men who ate alone. The low diet quality was due mainly to the aspect of adequacy. Therefore, additional efforts will be needed to improve the adherence to dietary recommendations focusing on low-scored components within the dietary patterns of individual groups. Considering that the coronavirus disease 2019 (COVID-19) pandemic may have changed dietary behaviors due to social distancing [38], future research on changes in diet quality due to changes in commensality after the COVID-19 era will be needed.
 XML Download