

 PDF
PDF Citation
 Print
Print


INTRODUCTION
The late infant period, to which preschool children belong, is a crucial period for physical and emotional growth and cognitive development. During this period, adequate nutrition and a balanced food intake are important factors affecting healthy growth and development. Furthermore, it is critical to cultivate proper eating habits, because eating habits formed during this period can affect eating habits and lifestyle-related diseases in adulthood [1234].
Recently, changes in the dietary environment and household structure have led to problems such as an unbalanced nutrient intake, skipping breakfast, frequent eating out, and irregular eating habits among Korean children [567]. The seventh Korea National Health and Nutrition Examination Survey VIII-2 [8] reported that 3.4% of 3- to 5-year-olds have an insufficient nutritional intake and 17.8% have an excessive energy intake. Hence, about 21% have a poor or excessive nutritional intake. Further, the rate of skipping breakfast has been increasing every year, from 8.1% in 2018 to 10.2% in 2019 and 12.1% in 2020, while 38.6% of children in this age group eat out more than once a day [8]. Such unhealthy eating behavior can hinder the proper growth and development of infants and young children and may lead to childhood obesity or overweight. It is, therefore, very important to understand the eating behaviors of preschool children and promote the formation of desirable eating behavior [567910].
In particular, the eating behaviors of preschool children can affect both their current nutrition and health status and the occurrence of future diseases [25]. Therefore, it is necessary to identify problems by evaluating children’s eating behavior and describing influencing factors [7]. In response to this need, Lee et al. [2] developed the nutrition quotient for preschool children (NQ-P) to comprehensively evaluate the nutritional status and meal quality of this population of children. The NQ-P is a survey tool for parents/guardians of children aged 3–5 years and comprises 14 questions across the three domains of balance, moderation, and environment. This tool has been applied to studies evaluating children’s eating habits and identifying influencing factors [5671011].
The eating behaviors of preschool children are influenced by the demographic factors, eating behaviors, food intake, nutrition knowledge, education level, and health interests of the primary caregivers or parents who prepare meals [712131415161718]. According to previous studies, beliefs and thoughts underlie behavior and are its determining factor [18192021]. In this context, examining the beliefs or thoughts that predict parents’ eating behavior will help understand infants’ eating behaviors and aid the formation of proper eating behaviors.
A number of studies have applied the health belief model (HBM) to explain people’s preventive health behaviors, identify factors affecting healthy eating behavior, and evaluate the development and effectiveness of nutrition education [182021222324252627]. The HBM was introduced by Hochbaum [28] in 1958 to explain the psychological intention of individuals to engage in health behaviors, and has been subsequently expanded by various researchers [293031]. Perceived severity refers to the degree of severity of a situation related to a disease, and perceived benefit refers to the perception that health behavior is effective in eliminating or reducing the risk of contracting diseases. In addition, perceived barriers are a negative result obtained from health behaviors that act as a hindrance to other health behaviors, and self-efficacy is the ability to change behavior with the conviction that healthy behavior can be performed [30]. The HBM is therefore a theoretical conceptual framework used to explain and predict human health behavior in various fields [182230313233].
Although it is meaningful to predict parents’ behavior by recognizing the importance of eating behavior in infancy and examining parents’ health beliefs as a factor influencing this behavior, few previous studies have considered this relationship. Therefore, this study regards the eating behaviors of preschool children as health behavior, analyzes such behavior using the NQ-P, and applies the HBM to identify the influencing factors. It aims to understand the formation of preschool children’s eating behavior and provide meaningful preliminary data for the development of nutrition education programs.
MATERIALS AND METHODS
Study subjects
Before the main survey, a preliminary survey was administered targeting the parents of seven preschool children to inform revision and supplementation of the survey questions. The main survey was then conducted from August to September 2018 in the Seoul and Gyeonggi provinces, the two regions with the highest number of children aged 3 to 5 in South Korea. Among the panels registered with an online survey company, the parents of children aged 3 to 5 years living in Seoul and Gyeonggi provinces completed an online survey. Participants began the survey after they comprehensively read the purpose and method and provided informed consent. A total of 257 responses were collected, of which 248 were analyzed after excluding incomplete or invalid responses. This study was conducted with the approval of the Institutional Review Board (IRB) of Hanyang Women’s University (IRB No. AN01-201801-HR-001-01).
Measurements
The questionnaires were developed with reference to research tools used in previous studies [218202324252627], and the questions were determined through preliminary research. The questionnaire gathered general information on parents and children, including residential area, sex, age, education background, family type, monthly income, frequency of eating out, and meal decision-makers. It also collected children’s NQ-P scores and parents’ health beliefs.
The NQ-P, which consisted of three domains and 14 evaluation items, was used to evaluate children’s eating behaviors [2]. The “balance” domain comprised the frequency of consumption of soybean products, fish, meat, white milk, and vegetable side dishes. The “moderation” domain consisted of the frequency of consumption of processed meat, fast food, sweet or oily bread, and processed beverages. The “environment” domain consisted of five items: eating at a place determined by the question, the level of effort required to eat properly, the frequency of handwashing before eating, the frequency of eating breakfast, and the time spent looking at screens (TV, computer, and tablet).
Parents’ health beliefs were measured using the constructs of the HBM, namely, “perceived severity,” “perceived benefit,” “perceived barrier,” and “self-efficacy” [18202324252627]. It was constructed based on the items used in the study, and each item was rated on a 5-point Likert-type scale (1 = strongly disagree, 5 = strongly agree). The Cronbach’s alpha of “perceived severity” was 0.795, “perceived benefit” was 0.856, “perceived barrier” was 0.861, and “self-efficacy” was 0.842.
Statistical analysis
Statistical analysis was conducted using the IBM SPSS Statistics 25.0 program (IBM Corporation, Armonk, NY, USA). A descriptive analysis was performed to gather participants’ demographics. The total NQ-P score and three sub-domain scores were calculated using the weights for each NQ-P domain and for each item [2], and are presented as mean and standard deviation. One-way ANOVA and Tukey’s multiple comparison were performed to test the differences according to participants’ individual characteristics. In addition, Pearson correlation and multiple regression analysis were performed to detect the factors that affect children’s eating behavior by applying the HBM.
RESULTS
General characteristics of study subjects
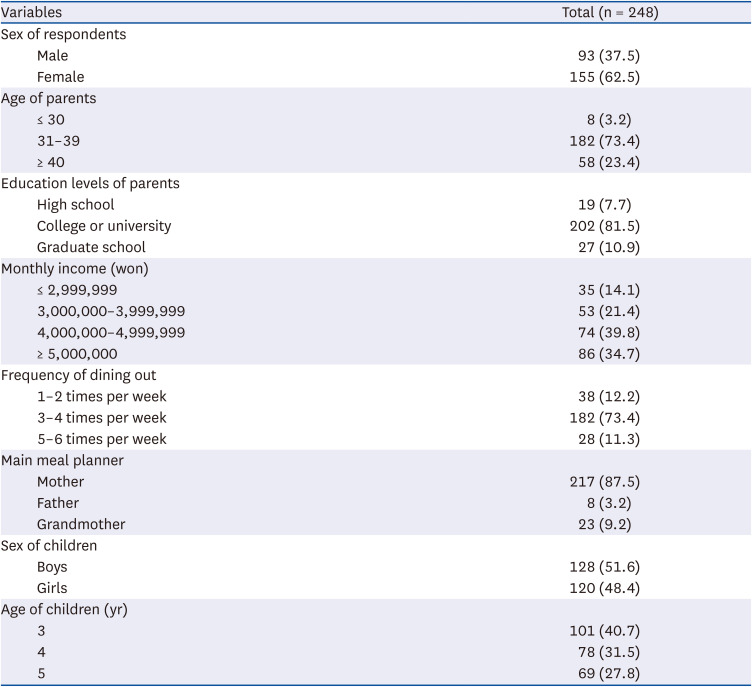
Table 1 shows the general information about the parents and preschool children who participated in the survey. Overall, 62.5% of parents were women (37.5% men), and 73.4% were between 31 and 40 years old. For monthly income, 39.8% of respondents responded that they earned between four and five million won. The mother (87.5%) was mainly responsible for preparing meals at home, and 73.4% of participants answered that they eat out three to four times a week. The number of children surveyed were 128 boys (51.6%) and 120 girls (48.4%), who were 3 years old (40.7%), 4 years old (31.5%), and 5 years old (27.8%).
Table 1
General characteristics of children and parents
NQ-P factor score difference based on parents’ characteristics and NQ-P score
Table 2 shows the results of examining the differences in the total NQ-P score and balance, moderation, and environment scores of the subjects by age of parents, education levels of parents, monthly income, frequency of dining out/week, main meal planner, and NQ-P group by calculating the score weighted by each NQ-P factor. Subjects’ total NQ-P score was 59.47 points, the balance score was 61.63 points, the moderation score was 48.54 points, and the environment score was 68.71 points. There was a significant difference in the NQ-P score according to parents’ education level and monthly income (P < 0.01). In the balance domain, parents who had graduated from graduate school scored significantly higher than those who had graduated from high school (P < 0.05). In the moderation domain, mothers who prepared the meals had the highest score of 49.64 points, whereas fathers who prepared the meals had the lowest score of 34.18 points (P < 0.05). In the environment domain, those with a monthly income of five million won or more had the highest score of 71.60, and it was demonstrated that the higher the income, the higher the score (P < 0.05). The total NQ-P score was divided into groups to examine the differences in the scores in each domain. Significant differences were found in all domains (P < 0.001).
Table 2
NQ-P factor scores by parents’ characteristics and NQ-P score (n = 248)
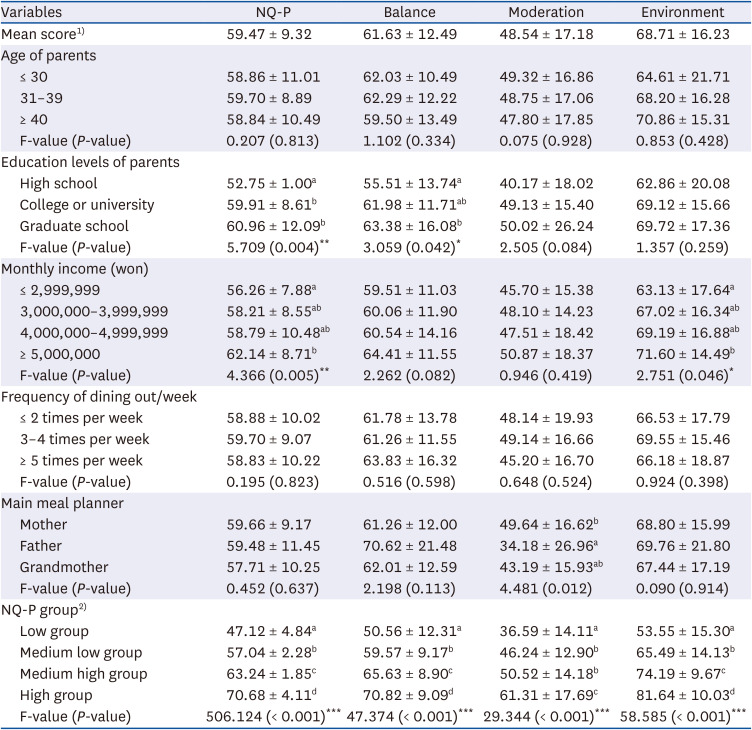
Values are presented as mean ± SD. Different letters in the same row are significantly different according to Tukey’s test. P-values were derived from a one-way ANOVA test.
NQ-P, nutrition quotient for preschool children.
1)The NQ-P and each domain score in the nationwide survey: NQ-P = 60.64, balance = 60.49, moderation = 51.49, environment = 71.66 [2].
2)Low: 0–53.7, medium-low: 53.8–60.7, medium-high: 60.8–66.3, high: 66.4–100 [2].
*P < 0.05, **P < 0.01, ***P < 0.001.
Factor scores in the HBM
Table 3 shows the scores for each factor in the HBM. Among the factors, “perceived benefit” had the highest score with 4.37 points, followed by “perceived severity” with 3.85 points, “self-efficacy” with 3.81 points, and “perceived barrier” with 3.15 points. In the category of “perceived severity” the item “I feel guilty if my child does not eat the right diet and develops a disease” (PSE 1) was the highest with 3.96 points. For “perceived benefit”, “I think it will help improve the immunity of my child” (PBE 2) was the highest with 4.39 points. In terms of “perceived barrier”, “The process of providing regular, healthy meals to my children is tiring” (PBA 3) was the highest with 3.24 points. For “self-efficacy”, “I know how to eat right and can continue to help my child’s healthy growth and development” (SEF 3) was the highest with 3.79 points. Comparing the differences in the HBM according to parental education level and monthly income showed a significant difference in the NQ-P score, and there was a difference in PBE 1, PBE 3, and SEF 1 by monthly income (P < 0.05).
Table 3
Parents’ health beliefs on the eating behaviors of preschool children (n = 248)
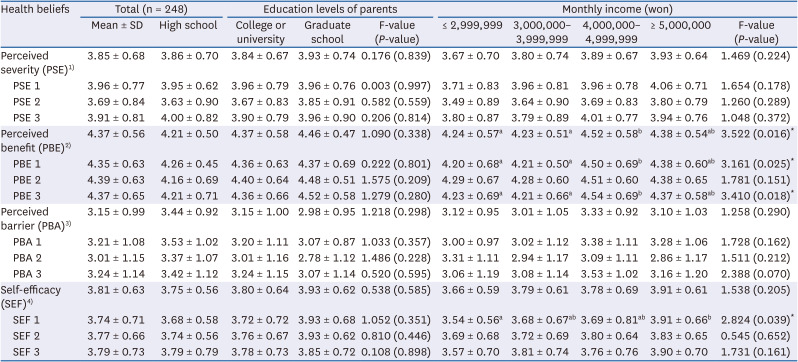
All measurement items were scored on a 5-point Likert scale (1 = strongly disagree, 5 = strongly agree). Values are presented as mean ± SD.
1) PSE 1: I feel guilty if my child does not eat the right diet and develops an illness; PSE 2: I am afraid that if my child does not eat the right diet, they will get sick; PSE 3: I am worried that if my child does not eat the right diet, growth retardation or advanced puberty may occur.
2)PBE 1: I think that a proper diet will help my child’s physical health; PBE 2: I think that a proper diet will help improve the immunity of my child; PBE 3: I think that eating right will help my child grow.
3)PBA 1: I am burdened by the time it takes to provide my children with regular, healthy meals; PBA 2: I provide healthy meals to my children, but the cost is burdensome; PBA 3: The process of providing regular, healthy meals to my children is tiring.
4)SEF 1: I can consistently provide my child with a well-balanced diet and snacks; SEF 2: I can continue to practice the right diet for the growth of my children; SEF 3: I know how to eat right and can continue to help my child’s healthy growth and development.
Correlation between parents’ health beliefs and eating behaviors of preschool children
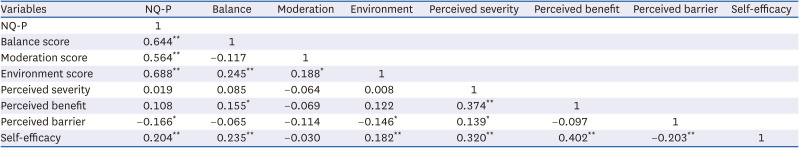
Table 4 shows the results of the correlation analysis to examine the relationship between parents’ health beliefs and preschool children’s eating behaviors. Among the four factors of the HBM, “perceived barrier” and “NQ-P” had a negative correlation (r = −0.166, P < 0.05), whereas “self-efficacy” and “NQ-P” had a positive correlation (r = 0.204, P < 0.01). The balance score had a positive correlation with “perceived benefit” (r = 0.155, P < 0.05) and “self-efficacy” (r = 0.235, P < 0.01). The environment score had a negative correlation with “perceived barrier” (r = −0.146, P < 0.05) and a positive correlation with “self-efficacy” (r = 0.182, P < 0.01).
Table 4
Correlation between the constructs of health beliefs and NQ-P scores (n = 248)
Effect of parents’ health beliefs on the eating behaviors of preschool children
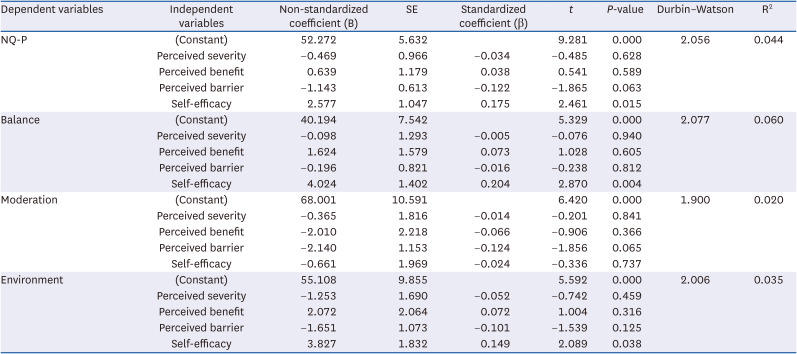
Multiple regression analysis was performed to examine which factors of the HBM affect the eating behaviors of preschool children. Table 5 presents the results of the analysis with the total NQ-P score and each domain score as the dependent variables and the HBM factors as the independent variables. Of the HBM factors, only parents’ “self-efficacy” was confirmed to increase the NQ-P scores (β = 0.175, P < 0.05), balance scores (β = 0.204, P < 0.01), and environment scores of preschool children (β = 0.149, P < 0.05). In the case of “perceived barrier,” there was a tendency to lower the NQ-P score (β = −0.122) and moderation score (β = −0.124), although this tendency was not significant.
Table 5
Association between health beliefs and NQ-P scores (n = 248)
DISCUSSION
This study evaluated the eating behaviors of preschool children in the Seoul and Gyeonggi provinces of South Korea using the NQ-P. It provided preliminary data for the preparation of a plan to improve the eating habits of preschool children by identifying the factors affecting their eating behaviors. To this end, an online survey was conducted targeting the parents of preschool children residing in the Seoul and Gyeonggi provinces, and the influencing factors were identified based on the HBM. The results of this study are as follows.
The NQ-P score of the nationwide survey was 60.64, the balance score was 60.49, the moderation score was 51.49, and the environment score was 71.66 [2]. Previous studies have reported that if preschool children continue to eat less than the nutritional index standard, they make have an insufficient intake of vitamin A, vitamin C, riboflavin, vitamin B6, calcium, and iron [2]. Therefore, to prevent such problems from occurring, it is necessary to improve their diet through continuous monitoring and education.
The comparison of the NQ-P scores with related factors indicated that the higher parents’ education level and monthly income, the higher the NQ-P score (P < 0.01). The analysis showed that in the balance domain, the scores of children whose parents completed graduate school were significantly higher than those of children whose parents graduated from high school (P < 0.05). In the moderation domain, the score of fathers preparing meals was significantly lower (P < 0.05), and in the environment domain, the higher the monthly income, the higher the score (P < 0.05). A previous study that explored the factors affecting child obesity demonstrated that the mother’s education level affects child obesity [34]. A study examining the nutrition status of children according to their parents’ socioeconomic level found that the average daily nutrient intake of the group with low parental education and monthly income was significantly lower than that of the group with high education and income [35]. In particular, the group with a high socioeconomic level showed a relatively low intake of fruit/vegetables and fat, whereas the group with a low socioeconomic level showed a high frequency of snacks and ramen consumption and irregular eating patterns.
Another study showed that people’s intake of micronutrients such as vitamins and minerals is insufficient and that the salt intake of those with a low socioeconomic level is relatively high [36]. In contrast, Jung and Kim [37] reported that when the father prepares meals, the NQ-P score is lower than when the mother or grandparents prepare breakfast. In this study, the moderation score related to the intake of sweet and fast foods was significantly lower when the father prepared the meal. The higher parents’ nutrition knowledge, the lower the exposure to sweet foods, fast foods, and instant noodles [37]. It is necessary to refrain from consuming processed meat, processed drinks, and fast food, and nutrition education is required to eat healthy foods in a balanced manner [38]. Eating behaviors related to the “moderation” domain such as sweet and fast food consumption, involve parents’ dietary guidance and intervention; therefore, parents should receive dietary education [39]. It is also necessary to educate fathers on how to form and practice the right eating habits to improve their children’s eating behavior by increasing their nutrition knowledge.
Analyzing the scores of each factor in the HBM showed that “perceived benefit” had the highest score at 4.37 points, followed by “perceived severity” at 3.85 points, “self-efficacy” at 3.81 points, and “perceived barrier” at 3.15 points. Analyzing the correlation between the HBM factors and children’s eating behavior variables showed that “perceived barrier” had a negative correlation (r = −0.166, P < 0.05), whereas “self-efficacy” had a positive correlation (r = 0.204, P < 0.01). The balance score had a positive correlation with “perceived benefit” (r = 0.155, P < 0.05) and “self-efficacy” (r = 0.235, P < 0.01). The environment score was negatively correlated with “perceived barrier” (r = −0.146, P < 0.05) and positively correlated with “self-efficacy” (r = 0.182, P < 0.01). The multiple regression analysis of the factors influencing children’s eating behaviors found that parental self-efficacy significantly increased the NQ-P scores (β = 0.175, P < 0.05), balance scores (β = 0.204, P < 0.001), and environment scores (β = 0.149, P < 0.05) of preschool children. The findings show that preschool children can adopt healthy eating behaviors when parents have high self-efficacy for those behaviors.
This result aligns with those of previous studies that have shown that self-efficacy has the biggest influence on eating behavior, and highlights the importance of this HBM component for the field [22274041]. As self-efficacy strongly influences changes to an individual’s behavior in the long term [2142], it is necessary to strengthen parents’ self-efficacy to improve children’s healthy eating behavior. From a practical perspective, the findings of the present study could be used to develop eating behavior intervention programs for parents of preschool children. Such programs could not only deliver nutrition knowledge but also allow participants to examine their eating habits, find ways to exercise newly gained knowledge, and practice cooking healthy meals. In a previous study, it was reported that a number of activities increase participants’ sense of self-efficacy, including watching videos on recipes and menus during nutrition education, receiving education on the role of nutrition for the body and mind, adopting behavior change strategies, and deploying stress management techniques [2241].
Perceived barrier showed a negative effect (β = −0.115, P = 0.075), although it was not significant according to the multiple regression analysis. The higher the recognition of obstacles such as “cost, time, and fatigue” in the practice of healthy eating, the lower the eating behavior score of preschool children. The effectiveness of education can be increased if the motivation to lead a healthy lifestyle is formed by overcoming obstacles while encouraging the development of healthy eating habits.
Preschool children’s proper nutrition through appropriate eating behaviors has an impact on their health, growth, and development. Their food choices are made by their parents, and parents can serve as role models when it comes to intake. Therefore, identifying the parental factors affecting the formation of eating behaviors will help preschool children practice healthy and proper eating behaviors. Research that has investigated the factors affecting the formation of preschool children’s eating behaviors has mainly considered parents’ dietary knowledge, eating behaviors, and demographic factors.
In this study, to provide a more practical understanding of preschool children’s eating behaviors, these behaviors were evaluated and the relationship was verified by applying the HBM. The results of the present study indicate that it will be helpful for preschool children to form proper eating habits if parents increase their self-efficacy through participatory education on practicing a balanced diet, proper food selection, and healthy eating habits.
The study’s limitations and suggestions for future research are as follows. First, as this study targets specific regions, it is difficult to generalize the findings to all preschool children. Therefore, in future research, it is necessary to expand the research area and increase the number of participants. Second, in the multiple regression analysis examining the effect of health beliefs on the eating behaviors of preschoolers, the explanatory power of the model was rather low. This shows the possibility that other variables could mediate the influence of health beliefs. In particular, since beliefs and perceptions can be changed through education, it is thought that more effective nutrition education for parents will be achieved if additional factors related to this topic are explored. In addition, a questionnaire reconstructed from previous studies was used to measure health beliefs. If a health belief measurement scale suitable for eating habits is developed in the future, the explanatory power will be enhanced, and an in-depth study can be conducted to identify factors affecting eating behavior. Third, the moderation score was found to be significantly low, with only eight cases (3.2%) found. Hence, this limits the extent to which the results can be generalized. At a time when men’s participation in household chores is also increasing, an in-depth examination of this in future studies could produce meaningful results. Finally, it is necessary to conduct a longitudinal study in the future. The present study used a cross-sectional design based on the theoretical underpinning; however, in future studies, new implications could be derived if longitudinal follow-up were used to confirm parents’ health beliefs and the temporal nature of children’s eating behaviors.
In conclusion, higher parental education and monthly income indicated a higher total NQ-P score (P<0.01). The results of the multiple regression analysis showed that parents’ self-efficacy significantly improved children’s eating behaviors. According to the findings, preschool children adopt healthy eating behaviors when the parents have high self-efficacy for such behaviors. This study provides preliminary data that can be used to develop an in-depth understanding of preschool children’s eating behaviors and parents’ education programs related to proper eating habits. Ultimately, the data will help preschool children form proper eating habits and develop healthy growth.
 XML Download