

 PDF
PDF Citation
 Print
Print


INTRODUCTION
Excessive sodium intake is associated with an increase of negative effects on health outcomes. Findings from a number of observational and intervention studies have confirmed the relationship between sodium intake and the risk of high blood pressure and cardiovascular disease [1234]. A study using data from the Korea National Health and Nutrition Examination Survey (KNHANES) reported that a decrease of average sodium intake over time led to a decrease in the population of patients with stroke and ischemic heart disease (IHD) [5]. A strong association of sodium intake with mortality [45]. A study conducted over 20 years reported a direct linear association between high sodium intake and total mortality [4]. Daily consumption of an additional 1,000 mg of sodium resulted in a significant increase of mortality by 12% (95% confidence interval [CI], 1.00–1.26; P < 0.05).
Compared with the “Goal intake” of 2,000 mg/day established by the World Health Organization (WHO) guidelines, sodium intake in South Korea has been steadily higher [6]. In response, a policy for reduction of sodium intake was proposed in the 3rd Comprehensive National Health Promotion Plan (Health Plan 2020, HP2020) in Korea [7]. Several policies were established at the local and national levels in an effort to increase the proportion of the population who consume less than 2,000 mg of sodium per day to 15%. Seoul, the capital of Korea, which has the highest population density [8], established the ‘Seoul City Sodium Intake Reduction Comprehensive Measures 2020’ [9]. A study evaluating the reduction of sodium intake in Korea concluded that because the declines occurred with the introduction of the policies, multi-component interventions had an effect in reducing sodium intake, although it was not possible to determine causal associations between the sodium reduction program and reduced sodium intake [10]. However, sodium consumption by most Koreans, with the exception of those aged 1–5 years old, was still higher than the goal of 2,000 mg [11].
Several studies have reported variation in the nutritional content of meals depending on the place where the meal is provided [121314151617]. Korean workers consume meals with lower quality when eating out than when consuming institutional meals [1418]. According to the findings of a study analyzing eating out behavior in Korean adults, the ratio of eating out to total food expenditures showed a significant increase from 1990–2016 [16]. Meal delivery and take-out services are used by approximately 74.1% of households and spending was higher in large cities compared to rural areas [19]. Use of ready-to-cook foods and meal-kits is greater in large cities than in other regions. However, few studies comparing sodium intake according to meal provision place have been reported.
Therefore, the effort to promote the reduction of sodium intake level requires detailed consideration that includes not only sex and age but also meal provision place. The purposes of this study were as follows: 1) to analyze the trend of sodium intake among citizens of Seoul from 2010–2019; and 2) to compare the sodium intake level by sex and age groups according to meal provision place.
SUBJECTS AND METHODS
Subjects
Data from the KNHANES between 2010 and 2019 were analyzed. KNHANES, a large-scale, nationwide, representative cross-sectional survey, has provided information regarding the health and nutrition status of Koreans by the Korea Centers for Disease Control and Prevention since 1998.
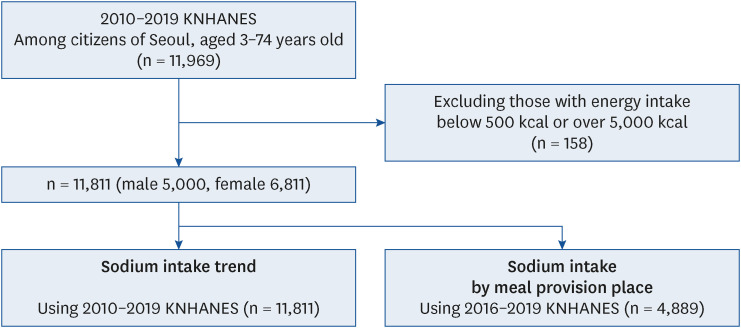
An analysis of 24-h dietary recall data from citizens of Seoul aged 3–74 years old in 2010–2019 KNHANES was conducted in this study, which included 11,969 subjects. Of these, 158 individuals were excluded from the analysis who have extreme daily calorie intakes (below 500 kcal and over 5,000 kcal). This study included two categories for analysis of sodium intake: trends and sodium intake levels according to meal provision place. Therefore, a total of 11,811 subjects (5,000 males and 6,811 females) were included in the analysis of the trend in sodium intake using data from years 2010–2019. Data from years 2016–2019, which includes 4,889 subjects was used in the analysis of sodium intake levels according to meal provision place (Fig. 1). This study was approved by the Institutional Review Board of Sungshin Women’s University (SSWUIRB-2020-027).
Trend in sodium intake
The time period was categorized according to 4 periods (4th [2010–2012], 5th [2013–2015], 6th [2016–2018], and 2019 KNHANES). Evaluation of amount of sodium intake was based on 2 units, the absolute amount of daily sodium intake and the proportion compared to the chronic disease risk reduction intake (CDRR). The CDRR was established for the first time in the 2020 Korean Dietary Reference Intakes (KDRIs) [20], in an effort to reduce the risk of chronic diseases in a healthy population. The sodium on CDRR by age group (3–5, 6–8, 9–11, 12–14, 15–18, 19–29, 30–49, 50–64, 65–74 years old) is as follows: 1,600, 1,900, 2,300, 2,300, 2,300, 2,300, 2,300, 2,300, and 2,100 mg [21]. Calculation of the proportion of sodium intake to the CDRR was performed by dividing daily sodium intake by the CDRR of each sex and age group and multiplying by 100.
Sodium intake according to meal provision place
An analysis of sodium intake per meal and the proportion of daily sodium intake according to meal provision place was performed for comparison of the sodium intake level according to meal provision place. Evaluation of sodium intake level per meal according to meal provision place was based on 2 units, sodium intake level in the absolute amount and the sodium intake density (mg/1,000 kcal). Calculation of the density was performed by dividing sodium intake by total energy intake and multiplying by 1,000.
In this study, meal provision place is defined as a place where food is served, not a place where food is consumed [22]. Meal provision place was classified according to 4 categories: home meal (HM), restaurant meal (RM), institutional foodservice (IF), and convenience food (CF). Food prepared at home, packed lunches prepared at home, and food made at a neighbor’s or relative’s house are classified as HM. Restaurant meal includes Korean, Western, Japanese, Chinese, and fast food that has been bought in commercial food service. Institutional meal includes categories of industry, school, senior-citizen center, free, religious community, and others. CF includes all foods that can be consumed with minimal cooking or close to individual products, such as instant noodles, snack bars, oranges, and others.
Data analysis
A statistical analysis was performed considering the complex sampling method of the KNHANES. All variables are presented as a mean ± SE. An analysis of trends of sodium intake level was performed by dividing the subjects according to selected characteristics in the sex, household income level, and family type, age group, and sex-age group. A comparison of sodium intake according to characteristics was performed using the SURVEYREG procedure and a post hoc test was performed using a Scheffé test. Evaluation of the P for trend in the four periods (4th [2010–2012], 5th [2013–2015], 6th [2016–2018], and 2019 KNHANES) according to the SURVEYLOGISTIC procedure was performed using the median value of the category as a continuous variable. The level of sodium intake according to the meal provision place was determined for each sex and age group, and a comparison according to meal provision place was performed using the SURVEYREG procedure. A comparison of the proportion of daily sodium intake in each meal provision place according to sex and age group was performed using the SURVEYREG procedure. A post hoc test was then performed using a Scheffé test. All hypotheses were tested at a significance level of 0.05. Statistical Analysis System version 9.4 software (SAS Institute, Cary, NC, USA) was used in performance of all statistical analyses.
RESULTS
Trends in sodium intake
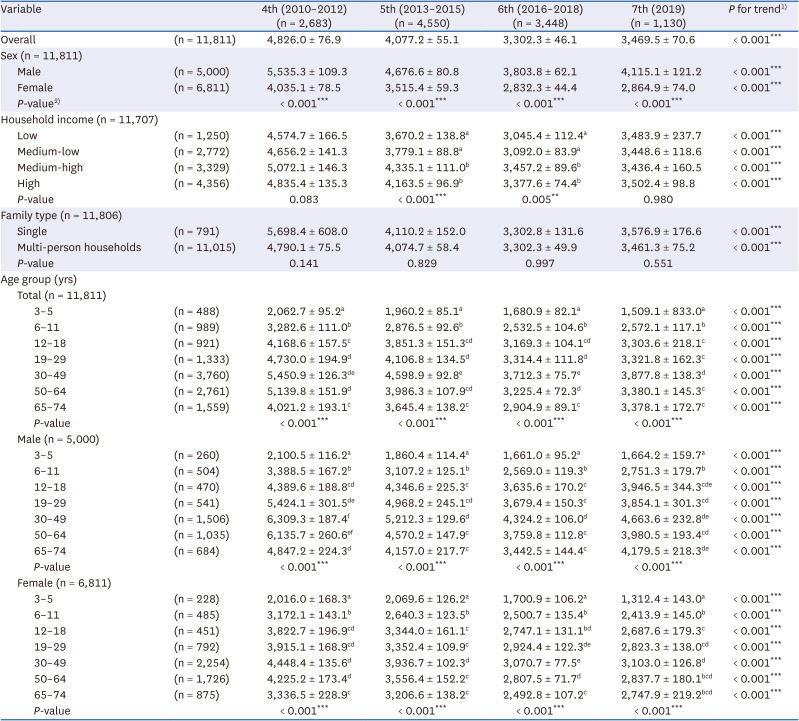
Trends in sodium intake according to sex, household income, family type, age group, and sex-age group are shown in Tables 1 and 2. Although sodium intake showed downward trends across the four periods (years 2010–2012, 2013–2015, 2016–2018, and 2019) in every category of subjects’ characteristics (P for trend < 0.001), it was still higher than the CDRR in 2019. The overall proportion of sodium intake to CDRR was 212.7% between 2010–2012 and it showed a constant decrease to 153.2% in 2019 (P for trend < 0.001). Sodium consumption was 65.4% higher for males than females in 2010–2012, still showing higher sodium intake levels than females, although the gap between sexes showed a recent decrease. In an analysis according to level of household income, sodium consumption was greater in groups with medium-high or higher income compared with lower income groups. No difference of sodium intake level was observed according to family type.
Table 1
Trends in sodium intake level according to selected characteristics among subjects
Data are presented as mean ± SE (mg). All analyses accounted for the multi-stage complex sampling design effect and used appropriate sampling weights using the SURVEY procedures in the SAS software.
KNHANES, Korea National Health and Nutrition Examination Survey.
a-fDifferent superscripts indicate significant difference across the selected characteristics in each period (years 2010–2012, 2013–2015, 2016–2018, and 2019) means by Scheffé test (P < 0.05).
1)P for trends of sodium intake (mg) across years 2010–2019 were calculated using the SURVEYREG procedure.
2)P-value of differences in sodium intake (mg) according to the selected characteristics were calculated using the SURVEYREG procedure.
*P < 0.05, **P < 0.01, ***P < 0.001.
Table 2
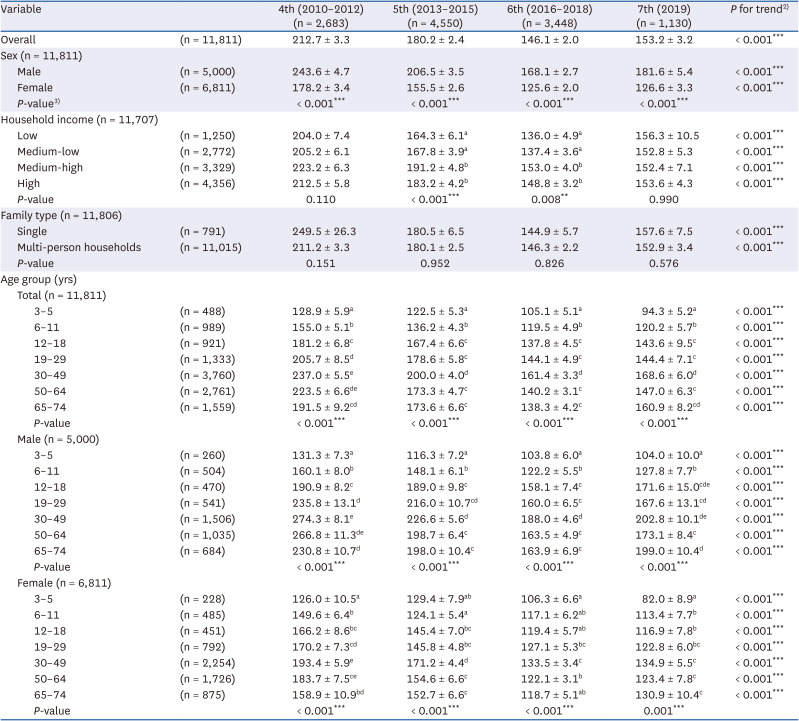
Trends in proportion of sodium intake to CDRR1) according to selected characteristics among subjects
Data are presented as mean ± SE (%). All analyses accounted for the multi-stage complex sampling design effect and used appropriate sampling weights using the SURVEY procedures in the SAS software.
KNHANES, Korea National Health and Nutrition Examination Survey; CDRR, chronic disease risk reduction intake.
a-fDifferent superscripts indicate significant difference across selected characteristics in each period (years 2010–2012, 2013–2015, 2016–2018, and 2019) means by Scheffé test (P < 0.05).
1)The proportion of sodium intake to the CDRR was calculated by dividing daily sodium intake by the CDRR of each sex and age group and multiplying by 100. CDRR refers to 2020 Dietary Reference Intakes for Koreans.
2)P for trends of the proportion of sodium intake to the CDRR (%) across years 2010–2019 were calculated using the SURVEYREG procedure.
3)P-value of differences in the proportion of sodium intake to the CDRR (%) according to the selected characteristics were calculated using the SURVEYREG procedure.
*P < 0.05, **P < 0.01, ***P < 0.001.
Compared with the CDRR, a higher level of sodium intake was observed for most age groups, except for subjects aged 3–5 and girls aged 3–5 in 2019. The highest level of sodium intake was observed for males aged 30–49 compared to other sex and age groups in 2019, which is 202.8% higher than the CDRR. The highest level of sodium intake was consistently observed in the 30–49 years age group in every period compared to other age groups, although no statistical difference was observed among subjects aged 19–29, 30–49, and 50–64 in 2010–2012. An analysis of sodium intake levels compared to CDRR showed no difference between the age groups of 30–49 and 50–64 years. Female adults showed no statistical difference in sodium intake according to age group, showing daily sodium intake of 3,103.0 mg or lower in 2019.
Sodium intake per meal according to meal provision place
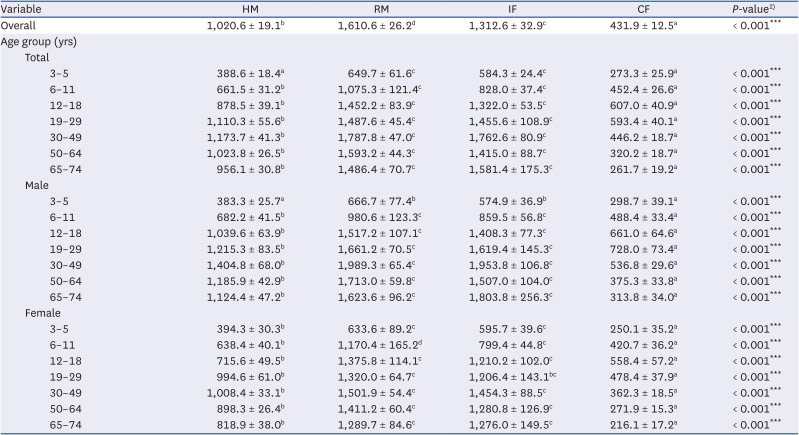
Results of the analysis of sodium intake per meal according to meal provision place showed sodium intake level in the order of RM > IF > HM > CF (P < 0.001; Table 3). However, the results of a post hoc test showed no statistical difference between RM and IF in most sex and age groups. Difference between RM and IF was observed only in females 6–11 years old, with the highest intake of sodium in RM (P < 0.001). No statistical difference in the level of sodium intake was observed among RM, IF, and HM in females aged 19–29. The lowest level of sodium intake was observed for CF in every sex and age group.
Table 3
Sodium intake per meal according to meal provision place1) among subjects
Data are presented as mean ± SE (mg). All analyses accounted for the multi-stage complex sampling design effect and used appropriate sampling weights using the SURVEY procedures in the SAS software.
KNHANES, Korea National Health and Nutrition Examination Survey; HM, home meal; RM, restaurant meal; IF, institutional foodservice; CF, convenience food.
a-dDifferent superscripts indicate significant difference across meal provision place in sex and age group (aged 3–5, 6–11, 12–18, 30–49, 50–64, 65–74) means by Scheffé test (P < 0.05).
1)Meal provision place is divided into 4 categories; HM, RM, IF, and CF.
2)P-value of differences in sodium intake (mg) according to the meal provision place in sex and age group were calculated using the SURVEYREG procedure.
*P < 0.05, **P < 0.01, ***P < 0.001.
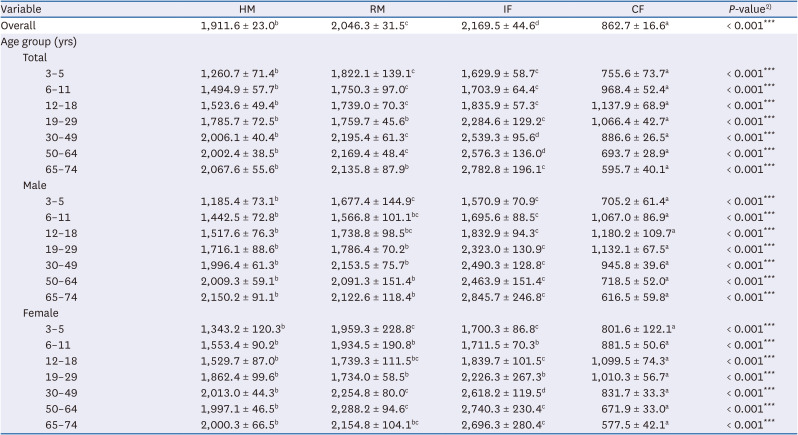
An analysis of sodium density (mg/1,000 kcal) per meal according to meal provision place among subjects was also performed (Table 4). In contrast to the previous results shown in Table 3, the highest sodium density was observed in IF showing 2,169.5 mg/1,000 kcal (P < 0.001) in most categories. However, the results of a post hoc test showed no statistical difference between IF and RM in age groups of 18 or younger. As shown in Table 4, the most notable point was the sodium intake in HM. Following the highest sodium intake of IF, the results of a post hoc test showed that sodium intake in HM did not differ significantly from that of RM among adults aged 19–29 and 65–74, and males aged 19 or older. In addition, no significant difference in sodium intake density was observed among HM, RM, and IF in females aged 19–29.
Table 4
Sodium density (mg/1,000 kcal) per meal according to meal provision place1) among subjects
Data are presented as mean ± SE (mg/1,000 kcal). All analyses accounted for the multi-stage complex sampling design effect and used appropriate sampling weights using the SURVEY procedures in the SAS software.
KNHANES, Korea National Health and Nutrition Examination Survey; HM, home meal; RM, restaurant meal; IF, institutional foodservice; CF, convenience food.
a-dDifferent superscripts indicate significant difference across meal provision place in sex and age group (aged 3–5, 6–11, 12–18, 30–49, 50–64, 65–74) means by Scheffé test (P < 0.05).
1)The density was calculated by dividing sodium intake by total energy intake and multiplying by 1,000. Meal provision place is divided into 4 categories; HM, RM, IF, and CF.
2)P-value of differences in the sodium density (mg/1,000 kcal) according to the meal provision place in sex and age group were calculated using the SURVEYREG procedure.
*P < 0.05, **P < 0.01, ***P < 0.001.
Proportion of daily sodium intake according to meal provision place
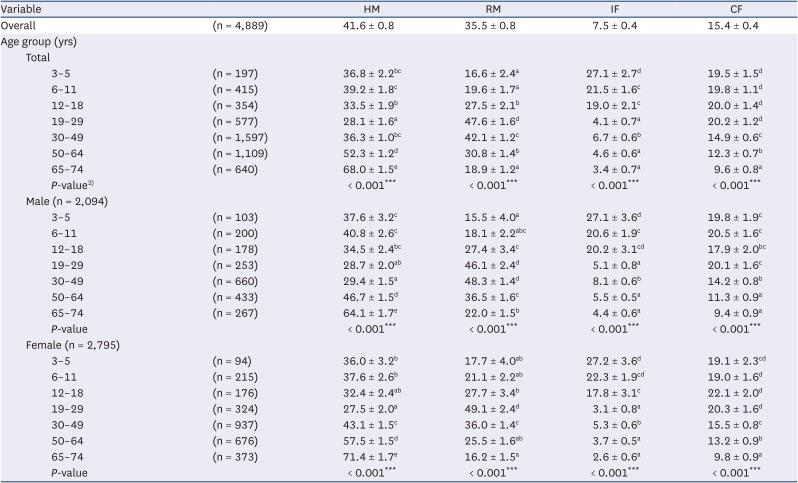
Table 5 shows the contribution of sodium intake at each meal provision place to the total daily sodium intake level. In this study, 41.6% of daily sodium was consumed in HM, 35.5% in RM, 15.4% in CF, and 7.5% in IF. More than half of the daily sodium in HM was consumed by adults aged over 50. The contribution of HM to sodium intake was 64.1% in males aged 65–74 and 71.4% in females aged 65–74 (P < 0.001). By contrast, the least amount of sodium from HM was consumed by adults aged 19–29 compared to other age groups, with daily sodium consumption of 28.1% in HM. The contribution of HM to daily sodium intake showed no statistical difference among males aged 12–18, 19–29, and 30–49. No statistical difference in HM was observed among females aged 12–18 and 19–29.
Table 5
Proportion of daily sodium intake according to meal provision place1) among subjects
Data are presented as mean ± SE (%). All analyses accounted for the multi-stage complex sampling design effect and used appropriate sampling weights using the SURVEY procedures in the SAS software.
KNHANES, Korea National Health and Nutrition Examination Survey; HM, home meal; RM, restaurant meal; IF, institutional foodservice; CF, convenience food.
a-dDifferent superscripts indicate significant difference across meal provision place in sex and age group (aged 3–5, 6–11, 12–18, 30–49, 50–64, 65–74) means by Scheffé test (P < 0.05).
1)Meal provision place is divided into 4 categories; HM, RM, IF, and CF.
2)P-value of differences in the proportion of daily sodium intake (%) according to the meal provision place in sex and age group were calculated using the SURVEYREG procedure.
*P < 0.05, **P < 0.01, ***P < 0.001.
The highest daily sodium consumption in RM was observed in adults aged 19–29, while adults aged 65–74 showed the lowest sodium intake. The contribution of RM to daily sodium intake was more than 40% in males aged 19–29 and 30–49 and females aged 19–29 (P < 0.001). A decrease in the proportion of daily sodium intake in CF was observed with increasing age in adults (P < 0.001). Only 9.6% of daily sodium in CF was consumed by adults aged 65–74, which was the lowest proportion compared to other age groups. The highest proportion of daily sodium intake in IF was observed in the youngest age group, 3–5 years old, compared to other age groups, however, the highest proportion of sodium was attributed to HM. A high proportion of daily sodium intake was observed in IF in subjects aged 6–11 and 12–18 who regularly eat lunch at the institution, following subjects aged 3–5 years old. The highest contribution of IF to daily sodium intake was observed in subjects aged 30–49 among adults, however, it was 1/3 times lower than that of subjects aged 3–5 years old.
DISCUSSION
The results of examination of the trends in sodium intake in citizens of Seoul between 2010 and 2019 showed that, although a downward trend was observed, the sodium consumption of most of the subjects was greater than the CDRR. Variation in the level of sodium intake per meal according to meal provision place was observed among sex and age groups, however, a consistently high contribution of RM and IF to daily intake of sodium was observed in every category. No significant difference in sodium density (mg/1,000 kcal) per meal was observed between HM and RM in the 19–29 and 65–74 age groups. HM contributed to half of daily sodium intake in subjects aged 50 years or older.
The average sodium intake by citizens of Seoul showed a decline from 2010 to 2019, consistent with previous studies reported in Korea [102324]. This is related to the policies and programs for reduction of sodium intake that have long been promoted by the central government and Seoul Metropolitan Government [910]. However, the level of daily sodium intake remains higher than the recommended level. In 2019 the sodium intake level was 1.5 times higher than the CDRR. Similar results were also reported in Japan, where the average intake of salt showed a gradual decrease from 2003 to 2014 [25]. In particular, the recent trend of increasing sodium intake was demonstrated in males aged 65–74 and those with medium-low or lower household income. Differences in sodium intake according to sex have been commonly reported in Korea [1024]. A lower level of sodium intake was consistently observed for people with medium-low or lower household income compared with those who have higher household income between 2010 and 2018. According to the findings of a study conducted among Koreans using the 2010–2018 KNHANES, higher consumption of unprocessed foods was observed in the lower income group compared with the higher income group [26]. Several studies have reported an association of consumption of processed food with the income level of a country [2728]. Unprocessed, natural foods are less expensive than processed foods in middle- or low-income countries, and people in low-income groups choose to consume natural foods [2728]. A tendency toward increased consumption of ultra-processed foods in Korea has recently been reported and our results also demonstrated increased consumption of sodium in groups with medium-low household income or lower. A significant association between consumption of ultra-processed food and frailty in elderly Americans has been reported [29]. Every 100 kcal increase in energy from intake of ultra-processed foods resulted in an increase in pre-frailty or frailty risk of 0.08 times (odds ratio, 1.08; 95% CI, 1.00–1.16; P < 0.05). Although the current study did not include an analysis of the direct relationship between processed foods and the level of sodium intake, high intake of sodium may be associated with excessive consumption of processed foods and is a major concern due to the negative effect on health.
In the analysis according to meal provision place, higher sodium density (mg/1,000 kcal) per meal was observed in IF than in RM, while a higher level of sodium intake per meal was observed for RM compared with IF. In every period, the highest level of sodium intake was observed in adults aged 30–49, who showed the highest sodium density (mg/1,000 kcal) in IF. However, the results of the analysis of proportion in daily sodium intake showed that subjects aged 30–49 consumed less than 10% of daily sodium in IF while over 40% in RM. When considering the absolute sodium intake level alone, IF might be considered less healthy than RM, however, this is not the case when considering the overall quality of the diet. Many studies have found that IF have better nutritional quality than RM in Korea [121418]. A lower index of nutritional quality (INQ) scores was reported for people who ate lunch provided by workplace food service, which reflects better nutritional quality, compared to those eating out or eating home-made meals (P < 0.05) [12]. Eating-out showed an association with poor nutritional quality, including more energy, fat, and sodium than institutional meals [18] or meals prepared at home [15]. Several studies conducted in Korea have reported an association between eating out and obesity [1630]. Although previous studies often analyzed eating out by combining RM and CF [1218], similar results that RM highly contribute to sodium intake per meal were shown even when analyzed by separating RM and CF. Moreover, the ratio of eating out to total food expenditures showed a significant increase between 1990 and 2016 in Korea [16]. More than half of participants reported eating outside the home at least once a week [16]. More than 40% of daily sodium was consumed by adults aged 19–29 and males aged 30–49 in RM. Therefore, managing the meal quality of RM, rather than IF, which is already under proper management by a dietitian, will have a more positive effect on the health of the population.
No significant difference in sodium density (mg/1,000 kcal) per meal was observed between HM and RM in the 19–29 and 65–74 age groups. HM contributed to more than half of daily sodium intake in adults aged 50 or older. Results of a study analyzing the sodium content of soup-based dishes in Korea showed no significant difference in sodium content per 100 g from restaurants and home, while the results of an analysis per serving showed higher sodium content in restaurants [17]. These results are inconsistent with those of several other studies which demonstrated a higher sodium content for meals that are eaten out compared with meals prepared at home [18], having a negative effect on health [303132]. More than 60% of daily sodium intake in HM was observed in the 65–74 age group; therefore, sodium reduction in HM should not be underestimated. Lower sodium intake, a component of the diet quality scores, showed an association with lower risk of frailty among women aged 60 years old or older [33]. A significant decrease in taste perception, including salty tastes, with aging has been reported [34] and increased threshold values for compounds with a salty taste (P < 0.05) have been reported among Asian people [35]. Several studies found that changes in taste can result in alterations of food choice and eating habits [3637]. Therefore, the reduction of sodium intake observed in HM among elderly subjects is important for prevention of disease and improved health.
Our study has some limitations that should be considered. Since this study is an observational study, it has a limitation in that it could not remove all confounders. The difference in sodium intake level by meal provision place can be based on the difference in the characteristics of the subjects. Thus, caution is needed when interpreting the results of this study. Moreover, because 24-h dietary recall data are dependent on the subjects’ short-term memory, there is potential for recall bias. We also have to consider the limitations of 24-h dietary data that relies on the database to calculate sodium intake. For example, in the case of soup-based food, the amount of sodium intake may be overestimated if the subject does not consume all the soup. However, because an analysis of the mean of sodium intake level among the subjects was performed, the limitations due to characteristics of the data was offset. This study has several strengths. The trend analysis of sodium intake provides an overview of the declining level of sodium intake in Seoul, demonstrating the importance of reducing sodium intake due to the fact that the overall level of sodium intake has been higher than the CDRR. To the best of our knowledge, this is the first study conducted in order to analyze the sodium intake of comprehensive age groups according to meal provision place. Specifically, most studies assessing sodium intake have often analyzed intake in adults. However, based on a meta-analysis that sodium intake is associated with blood pressure even in children and adolescents [38], this study also analyzed and described sodium intake in children and adolescents aged 3 to 18 years. Moreover, we analyzed sodium intake level of eating out by dividing it into RM and CF, which is a meaningful analysis considering the recent expansion of the convenience food market. The results from analysis of the proportion of daily sodium intake according to meal provision place will enable easier identification of places to focus on according to age and sex. The findings of our study provide the basis for development of further nutritional policy regarding sodium with consideration for meal provision place and sex-age groups.
In conclusion, sodium reduction is still required for citizens of Seoul, and the level of sodium intake varied significantly according to the characteristics of subjects. Considering that the level of sodium intake per meal and the proportion of daily sodium intake varied significantly according to meal provision place by sex and age groups, development of specialized nutrition policies according to meal provision place will be required. Compared with policies and programs previously implemented in Seoul, policies for reduction of sodium intake targeting meal provision place will provide better results.
 XML Download