

 PDF
PDF Citation
 Print
Print


INTRODUCTION
Excessive sodium intake is a leading cause of death [1] associated with the increased risk of hypertension, stroke, cardiovascular disease, gastric cancer, kidney disease, and Alzheimer’s disease. In addition, excessive sodium intake can cause complications in patients with type 2 diabetes [234567]. The global sodium intake far exceeds the physiological need (i.e., 10–20 mmol/day) [8]. In 2020, the average Korean consumed 3,189.3 mg of sodium daily [9]. The palate plays a sensory role in avoiding toxins and indigestible materials and recognizing consumable nutrients. Furthermore, the ability to detect salty tastes is essential to regulate the intake of salts such as sodium as well as to maintain hydration balance and blood flow [10]. Salty taste preferences among adults vary according to daily salt consumption amounts. Particularly, increased salt consumption is associated with an increased preference for saltiness. Therefore, salty taste preferences are closely related to average salt intake [11]. Moreover, a person’s daily sodium intake can be estimated based on their salty taste preferences.
Cigarette smoking is an independent risk factor for and is associated with the onset of several diseases, including lung cancer, cardiovascular disease, stroke, and type-2 diabetes [121314151617] as well as with the development of coronavirus disease 2019 [18]. Studies indicate that cigarette smoking is responsible for eight million deaths per annum [19]. Furthermore, the resulting smoke from igniting a cigarette contains over 4,000 chemical substances [20], of which 69 are known to cause cancer in humans [21]. Moreover, cigarette smoking significantly decreases palate sensitivity and causes morphological differences in taste buds and vascularization in the fungiform papillae [22]. Consequently, many cigarette smokers suffer from taste disorders of varying severities depending on the frequency of smoking [23].
Alcohol consumption is closely related to social activities. However, excessive consumption may cause hypertension, stroke, neurological and psychological disorders [2425262728] as well as diseases associated with the heart, liver, and digestive systems [293031]. Additionally, alcohol consumption poses a short-term health risk for traffic accidents, violence, and miscarriage [24]. Furthermore, alcohol consumption is responsible for 3 million deaths each year and contributes to disabilities and poor health outcomes for millions of people [32]. Moreover, excessive alcohol consumption is related to sensitivity to salty taste and may increase the sodium intake of the drinker [33]. Thus, alcohol consumption also interferes with appetite signals and increases the consumption of unhealthy snacks, resulting in excessive energy or sodium intake [34].
Studies related to smoking, drinking, and sodium intake have included a comparison of low salt preferences between smokers and non-smokers [35]. Specifically, a proportion comparison of smokers and drinkers in a group with a sodium intake of at least 4,000 mg [36], a comparison of the salty taste preferences of smokers and drinkers [37], and a comparison of the association between smoking and drinking and excessive sodium intake [38]. However, there are limited studies that directly compared smoking and drinking or at the same time affect eating behaviors that increase sodium intake.
Therefore, the relationship between cigarette smoking and alcohol consumption was analyzed in this study using a large population. Furthermore, the characteristics of sodium-related eating behavior of Koreans were analyzed to provide a basis for promoting health behaviors, such as smoking cessation and sobriety as a way to reduce sodium intake.
SUBJECTS AND METHODS
Study population
This study combined data from two four-year Korean Community Health Survey (KCHS) cycles (i.e., 2010 to 2013 and 2014 to 2017) from the Korea Disease Control and Prevention Agency (KDCA), formerly known as the Korea Centers for Disease Control and Prevention (KCDC). The KCHS is a national, cross-sectional study that uses a multistage probability sampling design based on the annual data of 227,770 adults from 254 community health centers in South Korea. This study was approved by the Ethics Committee of Kyungpook National University (IRB KNU-2022-0034).
Measurements and variables
Since 2010, the KCHS has conducted computer-assisted personal interviewing surveys which comprise both household and individual surveys. The individual survey included health-related information concerning an individual’s cigarette smoking habits, alcohol consumption, safety awareness, exercise and physical activities, nutrition, obesity and weight control, oral health, mental health, physical checkups and vaccinations, morbidity, and use of medical services. Furthermore, this survey required details regarding accidents and addictions, restriction of movement, quality of living, use of public health institutions, education, and economic activities. However, survey questions may vary over the years. Thus, this study analyzed the data based on a specific set of questions. Particularly, three questions on salty taste preferences, two questions on cigarette smoking, two questions on alcohol consumption, and seven questions on obesity, weight control, education, and economic activities.
The first question assessing salty taste preference asked, “How high is your usual salt intake level?” In response, participants could select either: “Very salty,” “Salty,” “Normal,” “Unsalty,” or “Very unsalty.” The second question asked, “Do you add salt or soy sauce to foods on the table?” The available answers were: “Always,” “Often,” “Rarely,” and “Not at all.” Finally, the third question asked, “How often do you dip-fried foods in soy sauce?” The available options were: “Always,” “Often,” and “Not at all.”
With regard to cigarette smoking and alcohol consumption variables, the population was divided into ever-smokers, non-smokers, ever-drinkers, and non-drinkers. Ever-smokers were defined as individuals who smoked more than 100 cigarettes throughout their lives and were further categorized as daily smokers, occasional smokers, or ex-smokers. Ever-drinkers referred to individuals who consumed more than one shot of alcohol throughout their lives and were further categorized as either annual drinkers or ex-drinkers, depending on whether the respondent consumed alcohol within the past year or not.
Calibration variables included sex, age, body mass index (BMI), educational level, marital status, and household income. This study consisted of three age groups, namely, youths (19–34 years), middle-aged (35–64 years), and older adults (≥ 65 years). BMI was divided into five groups based on the Asian population, namely, underweight (< 18.5), normal range (18.5– < 23), overweight (23– < 25), obese class I (25– < 30), and obese class II (≥ 30).
Education level, marital status, and household income were classified into three groups. First, education level was divided into no educational attainment, traditional school, secondary school, and higher education. Second, marital status was categorized as married, unmarried, and others (i.e., separated, widowed, or divorced). Third, the classifications for household income were < KRW 1,000,000, KRW 1,000,000–KRW 6,000,000, and > KRW 6,000,000.
Data analysis
Data analysis was conducted using the IBM Statistical Package for Social Sciences (SPSS, IBM Corp., Armonk, NY, USA) version 25 as well as the application of strata, clusters, and weights to account for the complex survey design of the KCHS. The data were cross-analyzed to compare the unweighted general characteristics of the different groups. Additionally, a complex sample logistic regression analysis was conducted to understand the relationship between alcohol consumption, cigarette smoking, and salty taste preference. Furthermore, the crude model was not adjusted for any variables while the fully adjusted model was modified based on the sex, age, BMI, educational level, marital status, monthly household income, and smoking (for the drinking model) or drinking habits (for the smoking model) of the respondents.
RESULTS
Unweighted characteristics of cigarette smokers
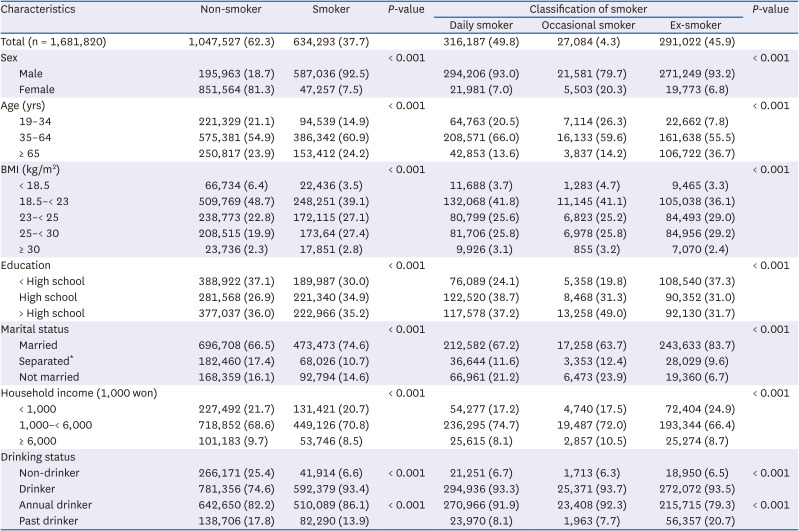
Table 1 shows the unweighted characteristics of the included cigarette smokers. Among the total subjects (n = 1,681,820), 37.7% were smokers, of which 49.7% were daily smokers and 92.5% were men. Furthermore, 57.3% of the ever smokers were overweight, obese, or severely obese, which was higher than the 45.0% of the non-smokers (P < 0.001). Among the ever-smokers, 74.6% of the respondents were married, exceeding the amount for non-smokers (P < 0.001). Moreover, ever-drinkers accounted for 93.4% of the ever-smokers, of which 86.1% were annual drinkers.
Table 1
Unweighted demographic characteristics of cigarette smokers, Community Health Survey 2010–2017
Unweighted characteristics for alcohol drinkers
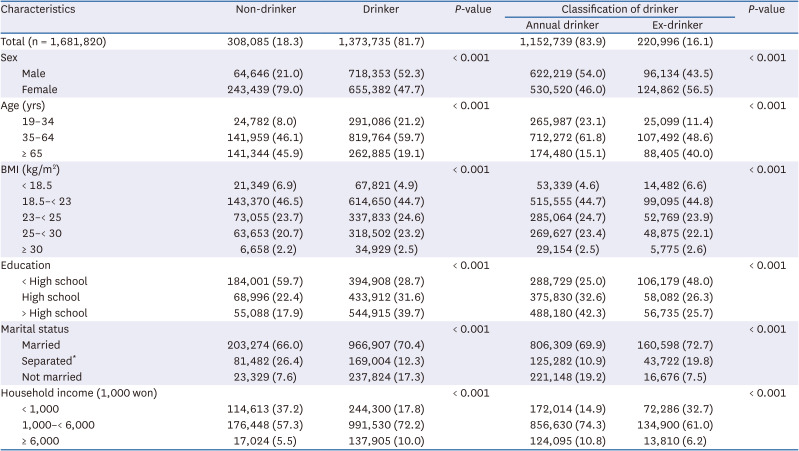
Table 2 shows the unweighted characteristics of the participating alcohol drinkers. Among the total participants, 81.7% were alcohol consumers, of which 83.9% were annual drinkers. Furthermore, the ratio of men to women ever-drinkers who drank more than one drink in their lifetime was similar at 52.3% to 47.7%. In contrast, 79% of the non-drinkers were women. In total, 19.1% and 45.9% of ever-drinkers and non-drinkers, respectively, were over the age of 65 years. Moreover, 50.2% of the ever-drinkers were overweight or had obesity, and severe obesity, in contrast to the 46.6% of nondrinkers (P < 0.001).
Table 2
Unweighted demographic characteristics of alcohol drinkers, Community Health Survey 2010–2017
Logistic regression analysis of ever-smokers and salty taste preferences
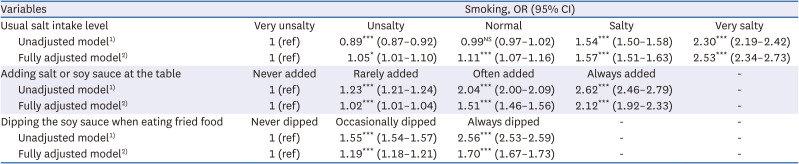
Table 3 exhibits the odds ratio (OR) between ever-smoking and salty taste preferences based on the crude and fully adjusted models. All ORs indicated strong statistical significance, regardless of adjustment. After accounting for various possible confounders, the adjusted odds ratios (AORs) for smokers who reported salt intake levels of “Very salty,” “Salty,” and “Normal” were 2.53 (95% CI, 2.34–2.73), 1.57 (95% CI, 1.51–1.63), and 1.11 (95% CI, 1.07–1.16), respectively (P < 0.001). Furthermore, the AOR for smokers who reported an “Unsalty” salt intake level was 1.05 (95% CI, 1.01–1.10; P < 0.05).
Table 3
Logistic regression analysis of ever-smokers and salty taste preference
OR, odds ratio; CI, confidence interval; NS, not significant.
1)Unadjusted = crude ORs are calculated from logistic regression models; 2)Fully adj = multivariable adjusted ORs are from logistic regression models adjusted for age, sex, body mass index, education, family income, marital status, and drinking.
*P < 0.05, ***P < 0.001.
Based on the fully adjusted model, the AORs for smokers who “Always” or “Often” add salt or soy sauce on the table were 2.12 (95% CI, 1.92–2.33) and 1.51 (95% CI, 1.46–1.56), respectively (P < 0.001).
The AORs for smokers who “Always” and “Often” dip fried foods in salt or soy sauce were 1.70 (95% CI, 1.67–1.73) and 1.19 (95% CI, 1.18–1.21), respectively (P < 0.001).
Logistic regression analysis of current smokers, occasional smokers, ex-smokers, and salty taste preference
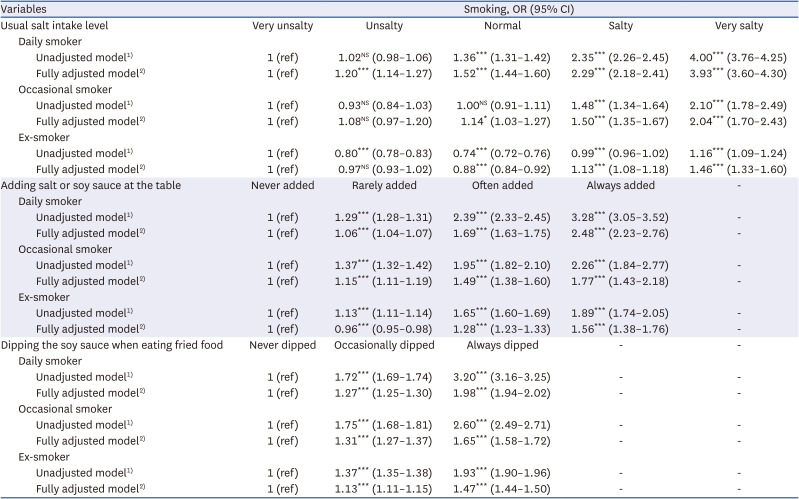
Table 4 summarizes the salty taste preferences of daily, occasional, and ex-smokers. In response to the first question, daily smokers reported higher ORs for salt intake than occasional and ex-smokers. Under the fully adjusted model, the AORs for daily smokers who reported “Very salty,” “Salty,” and "Normal" salt intake levels were 3.93 (95% CI, 3.60–4.30), 2.29 (95% CI, 2.18–2.41), and 1.52 (95% CI, 1.44–1.60), respectively (P < 0.001). Furthermore, the AORs for occasional smokers who expressed “Very salty” and “Salty” salt intake levels were 2.04 (95% CI, 1.70–2.43) and 1.50 (95% CI, 1.35–1.67), respectively (P < 0.001). In contrast, the AORs for ex-smokers with “Very salty” and "Salty" intake levels were 1.46 (95% CI, 1.33–1.60) and 1.13 (95% CI, 1.08–1.18), respectively (P < 0.001). Moreover, the AOR for ex-smokers who reported “Normal” was 0.88 (95% CI, 0.84–0.92), which is less than 1 (P < 0.05).
Table 4
Logistic regression analysis of current smokers, occasional smokers, ex-smokers, and salty taste preference
OR, odds ratio; CI, confidence interval; NS, not significant.
1)Unadjusted = crude odds ratios are calculated from logistic regression models; 2)Fully adj = multivariable adjusted odds ratios are from logistic regression models adjusted for age, sex, body mass index, education, family income, marital status, and drinking.
**P < 0.01, ***P < 0.001.
Under the fully adjusted model, the AOR for daily smokers who “Always” add salt or soy sauce was 2.48 (95% CI, 2.23–2.76) (P < 0.001). While the AORs for occasional smokers and ex-smokers were 1.77 (95% CI, 1.43–2.18) and 1.56 (95% CI, 1.38–1.76), respectively (P < 0.001). Furthermore, the AOR of daily smokers who “Always” dip fried foods in soy sauce was 1.98 (95% CI, 1.94–2.02) (P < 0.001) while the AORs for occasional smokers and ex-smokers were 1.65 (95% CI, 1.58–1.72) and 1.47 (95% CI, 1.44–1.50), respectively (P < 0.001).
Logistic regression analysis of ever-drinkers and salty taste preference
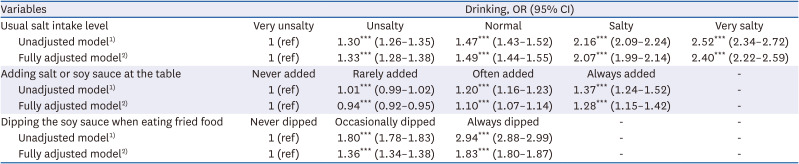
Table 5 displays the findings of the salty taste preferences of the ever-drinkers. Under the fully adjusted model, the AORs for ever-drinkers who indicated “Very salty” and “Salty” intake levels were 2.40 (95% CI, 2.22–2.59) and 2.07 (95% CI, 1.99–2.14), respectively (P < 0.001). Furthermore, the AOR for ever-drinkers with “Normal” and “Unsalty” were 1.49 (95% CI, 1.44–1.55) and 1.33 (95% CI, 1.28–1.38), respectively (P < 0.001). Moreover, the AOR for ever-drinkers who “Always” add salt or soy sauce was 1.28 (95% CI, 1.15–1.42) (P < 0.001). While the AOR for ever-drinkers who “Always” dip fried foods in soy sauce was high at 1.83 (95% CI, 1.80–1.87) (P < 0.001).
Table 5
Logistic regression analysis of ever-drinkers and salty taste preferences
OR, odds ratio; CI, confidence interval.
1)Unadjusted = crude odds ratios are calculated from logistic regression models; 2)Fully adj = multivariable adjusted odds ratios are from logistic regression models adjusted for age, sex, body mass index, education, family income, marital status, and smoking.
***P < 0.001.
Logistic regression analysis of annual drinkers, ex-drinkers, and salty taste preferences
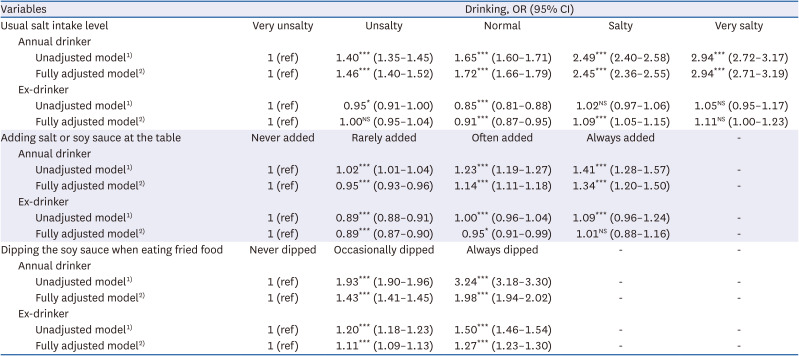
Table 6 shows the results for the tasting preferences of annual and ex-drinkers. The AOR for annual drinkers who reported salt intake levels that were “Very salty,” “Salty,” “Normal,” and “Unsalty” were 2.94 (95% CI, 2.71–3.19), 2.45 (95% CI, 2.36–2.55), 1.72 (95% CI, 1.66–1.79), 1.46 (95% CI, 1.40–1.52), respectively (P < 0.001). Furthermore, the AORs for “Always,” “Often,” and “Rarely” adding salt or soy sauce were 1.34 (95% CI, 1.20–1.50), 1.14 (95% CI, 1.11–1.18), and 0.95 (95% CI, 0.93–0.96), respectively (P < 0.001). Moreover, the AOR for “Always” and “Occasionally” dipping fried foods in soy sauce were high at 1.98 (95% CI, 1.94–2.02) and 1.43 (95% CI, 1.41–1.45), respectively (P < 0.001).
Table 6
Logistic regression analysis of annual drinkers, ex-drinkers, and salty taste preferences
OR, odds ratio; CI, confidence interval; NS, not significant.
1)Unadjusted = crude odds ratios are calculated from logistic regression models; 2)Fully adj = multivariable adjusted odds ratios are from logistic regression models adjusted for age, sex, body mass index, education, family income, marital status, and smoking.
*P < 0.05, ***P < 0.001.
The AORs for ex-drinkers who reported “Very Salty” and “Unsalty” preferences were not significant. However, the AOR for ex-drinkers who reported “Salty” and “Normal” preferences were 1.09 (95% CI, 1.05–1.15) (P < 0.05) and 0.91 (95% CI, 0.87–0.95) (P < 0.001), respectively. Meanwhile, the AORs for ex-drinkers who indicated that they “Often” and “Rarely” add soy sauce or salt to the table were 0.95 (95% CI, 0.91–0.99) (P < 0.05) and 0.89 (95% CI, 0.87–0.90) (P < 0.001), respectively. Moreover, the AORs for participants who “Always” and “Occasionally” dipped fried foods in soy sauce or salt were significant at 1.27 (95% CI, 1.23–1.30) and 1.11 (95% CI, 1.09–1.13), respectively (P < 0.001).
Logistic regression analysis of annual drinkers who are daily smokers with salty taste preference
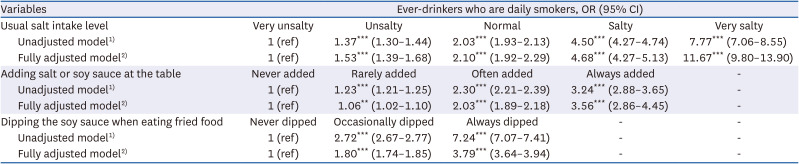
Table 7 summarizes the salty taste preferences of the annual drinkers who were daily smokers. Based on the fully adjusted model, drinkers and smokers who reported “Very salty” exhibited a very high AOR of 11.67 (95% CI, 9.80–13.90) (P < 0.001), while the AORs for “Salty,” “Normal,” and “Unsalty” were 4.68 (95% CI, 4.27–5.13), 2.10 (95% CI, 1.92–2.29) and 1.53 (95% CI, 1.39–1.68), respectively (P < 0.001). Furthermore, the AOR for “Always” adding soy sauce or salt was 3.56 (95% CI, 2.86–4.45) (P < 0.001), while the AOR for “Always” dipping fried foods in soy sauce was 3.79 (95% CI, 3.64–3.94) (P < 0.001).
Table 7
Logistic regression analysis of annual drinkers who are daily smokers and salty taste preferences
OR, odds ratio; CI, confidence interval.
1)Unadjusted = crude odds ratios are calculated from logistic regression models; 2)Fully adj = multivariable adjusted odds ratios are from logistic regression models adjusted for age, sex, BMI, education, family income, marital status, and smoking.
***P < 0.001.
DISCUSSION
This study used data from the KDCA to examine the relationship between cigarette smoking, alcohol consumption, and salty taste preference among Koreans. Particularly, this study used a fully adjusted model to analyze the various adjustment variables. The findings indicate a correlation between alcohol consumption, cigarette smoking, salty taste preferences, and the possibility of indirectly increasing salt intake levels. Consequently, this study found that cigarette smoking was more significant as a risk factor for salty taste preferences than alcohol consumption. Thus, drinkers who are smokers are more likely to consume higher salt levels than other smokers or drinkers.
Addiction caused by nicotine in cigarette smoke is a fundamental reason individuals are inclined to use tobacco products. Romanov and Kolesnikov [39] used electrophysiological identification to divide taste cells into three types, namely, type A cells (i.e., “mature” taste cells with large INa and small IK), type B cells (i.e., “mature” taste cells with large INa and large IK), and type C cells (i.e., “immature and/or glia-like” cells that lack INa). Furthermore, a study using a rat model revealed that prolonged exposure to nicotine significantly decreased the amiloride-sensitive sodium currents in type A cells [40] as these currents are mediated by epithelial sodium channels which are salt receptors in taste cells [41]. In addition, prolonged exposure to nicotine reduced the three types of taste cells, resulting in smaller fungiform taste buds. Moreover, it has been theorized that nicotine affects taste by changing the response of neurons in the nucleus of the solitary tract, which is the principal central relay in the gustatory pathway of taste buds on the tongue [42]. Oliveira-Maia et al. [43] also reported that nicotine affects taste by activating nicotinic acetylcholine receptors that manifest in taste buds. Thus, exposure to nicotine can also change the quality of saliva and saliva secretion, which play a vital role in sensing taste. Consequently, this may indirectly affect the delivery of a sense of taste [4344454647].
The findings of this study confirmed the relationship between cigarette smoking and salty taste preferences. The AORs for daily smokers with salt intake (i.e., 3.93 and 2.29) were higher than those of occasional smokers (i.e., 2.04 and 1.50), while the AORs for ex-smokers were the lowest (i.e., 1.46 and 1.13). Lampure et al. [37] found that some ex-smokers regain their salty taste to some extent after quitting smoking. This taste difference may be due to the frequency and amount of smoking. Furthermore, taste cells in taste buds are known to regenerate within ten days [48]. Thus, this study included respondents who had quit smoking between 1 and 20 years ago. The AOR for “very salty” was high, at 1.46. The non-smoking years far exceed the taste cell regeneration cycle, suggesting that smoking affects the sense of taste and is associated with other neurological mechanisms [484950]. A large web-based observational cohort in France also reported a correlation between cigarette smoking and salty taste preferences [37]. However, the relationship is unclear as previous studies [395152] have failed to identify the relationship between smoking and excessive sodium intake. According to a study using KNHANES V data in Korea, smokers reported salt intake levels that did not differ significantly from that of non-smokers. Particularly, only smokers who consumed alcohol showed a significant association with excessive sodium intake [39].
Smoking was negatively correlated with overall diet quality. According to Alkerwi et al. [53], heavy smokers consume a more pro-inflammatory diet than non-smokers and are less compliant with national or international dietary recommendations. Furthermore, research has found undesirable levels of cholesterol, glycemic biomarkers, and adiposity among heavy smokers. Alkerwi et al. [53] also listed the mechanisms for the negative correlation which comprise the relationship between tobacco smoke and mood function, changes in taste related to cigarette smoking, unhealthy lifestyle, socioeconomic status, or lack of nutritional knowledge and awareness. Upon adjusting for socioeconomic status and other possible confounders, this study found that smokers add salt or soy sauce to the table and prefer to consume fried foods with soy sauce at a significantly higher significance level than non-smokers. East Asian foods are characterized by high sodium content, which is one of the key dietary risk factors for death and disability-adjusted life years [1]. With regard to the sources of sodium, processed foods account for 75% to 80% of sodium intake in the United States and the United Kingdom (UK) [54]. In Asian countries such as China, Japan, and Korea, the salt and soy sauce added during preparation or to the table account for most of the sodium intake [54]. Thus, the findings of this study indicate that cigarette smoking is correlated with the addition of salt or soy sauce to the table, which suggests that smokers prefer a salty taste and increased levels of discretionary salt intake. Furthermore, the findings of this study suggest that smoking-induced changes in taste cause changes in food preferences and dietary behaviors. A previous study [55] reported that smokers preferred foods high in fat and sodium in contrast to non-smokers. Similarly, both current smokers and ex-smokers reported higher rates of central obesity, intermuscular adipose tissue, and lean muscles as well as lower muscle quality [56]. In contrast, several studies [575859] have reported that quitting smoking may cause weight gain as smoking is related to a low risk of obesity. In East Asia, studies [606162] show that smoking is highly correlated with waist circumference. According to a 2018 Mendelian randomization study in the UK [63], high BMI levels and waist circumference were correlated with the heavy smoking habits of current smokers. Moreover, research has found that excessive sodium intake is an independent risk factor for central obesity [64]. Consequently, this may affect the central obesity caused by cigarette smoking. Thus, smokers’ preference for high-fat foods may be related to high BMIs [65]. According to the study by Anker et al. [66], ex-smokers consumed more high-sugar and high-fat foods than high-sodium foods after acute quitting smoking, which resulted in weight gain. In this study, smokers (57.3%) were more obese than non-smokers (45.0%). Particularly, the obesity rate (60.6%) of ex-smokers was higher, which is consistent with previous study findings [555657].
In 2018, soju and beer, respectively, accounted for 60.3% and 22.5% of the total alcoholic drinks consumed by Koreans over 19 years [67]. The findings of the current study indicate a correlation between alcohol consumption and a preference for salty food. Particularly, the AORs for annual drinkers with “Very salty” and “Salty” were 2.94 and 2.45, respectively. However, the AORs for ex-drinkers who reported “Normal” salt intake levels were significantly lower than 1. Similarly, the AORs for people who “Rarely” and “Often” added salt or soy sauce to the table were also significantly lower than 1. Moreover, the AOR for annual drinkers and ex-drinkers who “Always” dipped fried foods in soy sauce were 1.98 and 1.27, respectively, indicating the highest values among the two salt-intake behavior questions.
Thibodeau et al. [68] reported that alcohol consumption was related to a sense of taste. For example, people sensitive to sour and bitter tastes consume alcohol less often than others. Furthermore, people who are sensitive to sour, astringent, or savory tastes drink less wine than others. However, only a few studies have reported a relationship between alcohol consumption and salty tastes. A study using the 2012 to 2014 NHANES data showed that the whole-mouth taste test results did not vary between alcohol drinkers and non-drinkers across most taste groups [33]. However, women aged 60 or older who do not drink tasted saltiness at 0.32 M sodium chloride (NaCl) salt, in contrast to women aged 60 or older that drank alcohol, and did not feel saltiness at the same concentration. In 2016, Silva et al. [69] also observed a certain trend in a salt frequency test; however, they did not find a difference in the taste threshold between alcohol drinkers and non-drinkers. Based on the five levels of NaCl solution concentration (0.09 g/L, 0.18 g/L, 0.37 g/L, 0.75 g/L, 1.5 g/L) used in their study, the largest percentage difference between the groups was found in the third level (0.37 g/L). Consequently, this prevented the study from concluding that alcohol consumption is not correlated with a salty taste. Despite the obscure relationship between alcohol consumption and salty taste preference, the findings of the current study indicate a strong correlation between alcohol consumption and salty taste. The OR for annual drinkers who reported that they “Always” dipped fried foods in soy sauce was 3.24 before adjustment and 1.98 when adjusted, which was higher than the OR for the other question on eating behavior. Moreover, The relationship between alcohol consumption and salty taste preference was more closely related to dietary behaviors and food rewards. Rose et al. [34] surveyed college students after they consumed alcohol or soft drinks and instructed each group to indicate their preferred snacks to eat. Consequently, the alcohol group reported higher craving for salty snacks. Furthermore, Schrieks et al. [70] found that the intake of savory foods, particularly high-fat savory foods, increases after alcohol consumption, and alcohol consumption increases cravings for high-fat savory foods. The researchers argued that the increased craving for salty snacks after drinking could be a learned response. However, salt can mask bitterness in foods such as cheese. Therefore, people who are more sensitive to bitterness or have more fungus papillae could be susceptible to higher sodium intake [71]. Presumably, people with normal taste senses also eat salty snacks when drinking to mask the bitter taste of alcohol. Thus, oral and gut sensory signaling may play a role in alcohol consumption; however, this connection is yet to be explored.
In this study, the trend exhibited by ex-drinkers differed from that of annual drinkers. Significance was found only at 1.09 and 0.91 which is “Salty” and “Normal,” among the AORs for normal salt intake, which was lower than “Very unsalty.” Moreover, regardless of whether salt was added to the table, the AOR was significantly lower than that of annual drinkers among the questions about eating behavior. Studies suggest that this could be the result of new taste cells [48] and increased sensitivity to saltiness [11] among ex-drinkers.
This study has several limitations. First, smokers and drinkers were distinguished from each other without considering the smoking frequency of daily and occasional smokers, the non-smoking period of ex-smokers, as well as the amount and frequency of alcohol consumption by drinkers. Second, this study did not account for the possibility that female smokers might have concealed their smoking status because of the societal perceptions toward women who smoked. Third, defining drinkers as individuals who had at least one shot of any alcoholic beverage throughout their lives did not consider the amount and frequency of alcohol consumption. Fourth, the self-reported saltiness levels of respondents may differ from the actual saltiness of the foods consumed. Furthermore, the questions on salty taste preferences lacked specific quantitative measures. Despite these limitations, this study utilized data from nationwide surveys from 2010 to 2017, the sample size was significantly large (total = 1,681,820), and the findings indicated strong statistical significance.
In conclusion, this study found that cigarette smoking and alcohol consumption were associated with an increased risk of consuming excessive salt. Thus, smokers who consume alcohol are susceptible to consuming even more salt.
 XML Download