Journal List > Nutr Res Pract > v.17(3) > 1516082921

Park, Cho, and Yim: Resting energy expenditure in Korean type 2 diabetes patients: comparison between measured and predicted values

Abstract

BACKGROUND/OBJECTIVES

Estimation of energy demand using resting energy expenditure (REE) is a reasonable approach for optimizing glycemic control and weight management in patients with type 2 diabetes mellitus (T2DM). This study aimed to compare REE predictions and objective measurements in patients with T2DM in Korea.

SUBJECTS/METHODS

This study enrolled 36 participants with T2DM (age range, 20–60 years). Anthropometric variables including height, weight, waist-hip ratio, blood pressure, body fat, body fat percentage, and total body weight were measured using bioimpedance. REE was evaluated using indirect calorimetry. The measured REE values were compared to values estimated using five predictive equations: the Harris-Benedict, Mifflin, Owen, Food and Agriculture Organization of the United Nations/World Health Organization (FAO/WHO), and Schofield equations. This study evaluated the associations between measured REE values and anthropometric/clinical data, including height, weight, and age, using multivariate linear regression.

RESULTS

The mean measured REE value was 1891.79 ± 288.03 kcal/day (male), 1,502.00 ± 202.96 kcal/day (female). REE estimates generated from the Mifflin equation showed the largest differences from measured REE values, whereas estimates derived from the FAO/WHO equation were the closest to the measured REE values. This study also identified associations between measured REE values and various anthropometric/clinical variables.

CONCLUSION

The accuracy of REE prediction equations is critically important in promoting the efficacy of dietary counseling and the effective treatment of diabetes. Our results indicate the need for additional studies informing more suitable methods for determining the energy requirements of Korean patients with T2DM.

INTRODUCTION

Type 2 diabetes mellitus (T2DM), a disease defined by impaired insulin action and secretion [1], is a serious chronic disease that affects 514 million patients worldwide [2]. The prevalence of T2DM has increased over the past four decades, and the current average prevalence worldwide is approximately 4%. In Korea, T2DM is the sixth leading cause of mortality and the fourth leading cause of disability [3]. In 2019, the prevalence of T2DM in this country was 14.0% in men and 9.5% in women in a study evaluating descriptive epidemiology for T2DM in adults aged over 30 years [4]. Poorly controlled T2DM may increase the risk of complications such as cardiovascular disease, neuropathy, retinopathy, and diabetic foot. Therefore, the prevention and effective treatment of T2DM is of crucial public health concern [5].
The principal strategy for treating obese T2DM patients is the loss of body fat mass (BFM) through alterations in lifestyle, including dietary habits and physical activity; such interventions have been related to improvements in glycemic index [6]. In regard to administering effective dietary interventions, it is necessary to calculate each patient’s daily energy needs in order to inform appropriate nutritional treatment with the goal of decreasing BFM [7]. Therefore, gaining the most precise assessment of the energy needs of patients with T2DM is of essential importance.
Resting energy expenditure (REE) comprises approximately 60–75% of a person’s total daily energy expenditure [8], making this measure the most important component for determining appropriate energy needs [9]. The accuracy of REE may depend on several parameters, including sex, body composition, age, physical activity, the presence of diabetes or obesity, and caloric intake [10]. Indirect calorimetry has been used in measuring REE in prior research. However, due to limited access to equipment, predictive equations are preferred within the relevant methodological literature [11].
Many studies have demonstrated that the Harris-Benedict [12], Mifflin-St. Jeor (also known as Mifflin) [13], Schofield [14], and Food and Agriculture Organization of the United Nations/World Health Organization (FAO/WHO) equations [15] can either underestimate or overestimate REE as compared with indirect calorimetry [1617].
In one study evaluating the accuracy of predictive equations in obese women with T2DM, the Mifflin equation was found to underestimate REE by −2.6%, whereas the FAO/WHO equation overestimated REE by 10.6% as compared with indirect calorimetry [18]. Another study found that Japanese patients with T2DM had a higher REE than non-diabetic patients [19], and declines in REE are negatively influenced by insulin levels, as reported in a study conducted in 58 patients with T2DM [2021].
The Asian populations tend to have lower REE than the Caucasian population, which has been attributed to differences in body composition. Most predictive equations have been for healthy Caucasians and thus may not be valid, particularly for Asians such as Koreans with the disease [22]. In a recent Asian study, predictive REE in Japanese patients with T2DM had significant errors even when the data were adjusted for bone mineral mass and lean body mass [23].
Therefore, the occurrence of diabetes should be considered a variable in REE prediction equations, applied these questions to Korean patients with T2DM. The aims of the current study were to assess the accuracy of REE values predicted using the Harris-Benedict, Mifflin, Owen, FAO/WHO, and Schofield equations as compared with REE measured using indirect calorimetry in Korean patients with T2DM, and to reveal the factors responsible for bias between predicted and measured REE values.

SUBJECTS AND METHODS

Participants

The included participants were 24 men and 12 women with T2DM who were hospitalized at the Changwon Fatima Hospital (Changwon, Korea) for diabetic control between April 2017 and July 2018. Study exclusion criteria were as follows: age > 80 years, previous ketoacidosis or documented ketonuria, abnormal liver and thyroid function, and the presence of kidney disease, heart failure, or any acute or consumptive disease. The study protocol was approved by the Institutional Review Board at our institution (approval No. 17-04) and all participants provided their written consent. This work was conducted in accordance with the principles of the Declaration of Helsinki.

Anthropometry

Height and weight were measured using an automated scale. Body mass index (BMI) was calculated as the ratio of height to weight squared (i.e., kg/m2). Body composition was estimated using bioelectrical impedance analysis (Inbody 720; Biospace, Seoul, Korea) to determine fat mass, fat-free mass (FFM), and skeletal muscle mass (SMM). Waist and hip circumferences were measured while the participants stood with their arms open wide. The waist-hip ratio was calculated as the waist-to-hip circumference ratio. All data were measured by trained research staff.

Blood samples

Venous blood samples were collected after a 12 h fast. Glucose, triglyceride (TG), total cholesterol (TC), low-density lipoprotein cholesterol (LDL-C), and high-density lipoprotein cholesterol (HDL-C) levels were measured using an absorptiometry kit (Bayers, Tarrytown, NY, USA). Serum insulin levels were measured using a commercial kit (Mercodia AB, Uppsala, Sweden) and leptin levels were measured using a human leptin radioimmunoassay kit (Linco Research, St. Louis, MO, USA). Homeostatic model assessment for insulin resistance (HOMA-IR) values were calculated as follows:
HOMA-IR = fasting insulin (µIU/mL) × fasting glucose (mmol/L)/22.5.
Serum advanced glycation end-product (AGE) levels were measured using an enzyme-linked immunosorbent assay kit (Abcam, Cambridge, UK).

Measurement of REE

REE was measured for all participants by using a ventilated hood linked to a gas analyzer system (TrueOne 2400; Parvo Medics, Sandy, UT, USA) to conduct indirect calorimetry. The participants were asked to restrict alcohol intake and strenuous/intensive physical activity the day prior to the examination and to fast for at least 8 h prior. To measure REE at a stable state, the participants were provided with 10 to 15 min of rest and were instructed to maintain a supine position in the hospital bed. To calibrate the system, the volume of the turbine flowmeter was first calibrated electronically, followed by calibration of the collection plates using known gas centralization. The first 10 min of gas collection were not included in the measurement of REE; instead, VCO2 and VO2 (i.e., carbon dioxide production and oxygen uptake; L/min) obtained during the final 20 min (mean values) were used in measuring participants’ REE values.
The predicted REE values were calculated within each equation using data on body weight, height, and age. The REE was calculated with the actual body weight and height at the time of anthropometric measurements. Equations derived only for specific ethnic groups or for participants with BMIs of ≥ 40 kg/m2 were excluded from the scope of the current study. Based on these criteria, we selected five REE prediction equations developed in Korean study populations [24]. The predictive equations for REE are summarized in Table 1.
Table 1

Predictive equations for resting energy expenditure in men and women

nrp-17-464-i001
Predictive equations Men Women
Harris-Benedict 66 + (13.8 × W) + (5.0 × H) − (6.8 × A) 655 + (9.5 × W) + (1.9 × H) − (4.7 × A)
Mifflin (9.99 × W) + (6.25 × H) − (4.92 × A) + 166 − 161 (9.99 × W) + (6.25 × H) − (4.92 × A) − 161
FAO/WHO 11.6 × W + 879 (age < 60 yrs) 8.7 × W + 829 (age < 60 yrs)
Schofield (0.048 × W + 3.653) × 239 (0.034 × W + 3.538) × 239
Owen 879 + (10.20 × W) 795 + (7.18 × W)
A, age (yrs); FAO, Food and Agriculture Organization of the United Nations; H, height (cm); W, weight (kg); WHO, World Health Organization.

Statistical analysis

Statistical evaluation was performed using SPSS statistical software (version 25; IBM Corp., Armonk, NY, USA). Results were presented as means ± SD. Statistical significance was defined as a 2-sided P-value of less than 0.05. Differences between measured and predicted REEs were represented as absolute values (i.e., predicted value − measured value) and bias percentages. Bias percentage was calculated as follows:
(Predicted REE − Measured REE)/Measured REE × 100.
Differences in findings between men and women were analyzed using the Mann-Whitney U test. Correlations between REE values and various covariates were analyzed using Pearson correlation coefficients. The independent factors influencing REE were assessed using multivariate linear regression analysis adjusting for predictive variables that correlated with REE at the level of statistical significance (P < 0.05) on univariate analysis.

RESULTS

Anthropometry

The descriptive anthropometry of the included participants is shown in Table 2. There were 24 males and 12 women included in the present study. The mean age of the included participants was 42.79 yrs for men and 48.75 yrs for women, and the mean BMI was 26.97 kg/m2 for men and 23.62 kg/m2 for women. There was no significant difference in mean age between men and women. However, men had a significantly higher height, weight, BMI, SMM, and waist and hip circumference (P < 0.05).
Table 2

Anthropometry of participants with type 2 diabetes mellitus

nrp-17-464-i002
Variables Men (n = 24) Women (n = 12) P-value
Age (yrs) 42.79 ± 10.74 48.75 ± 8.84 0.104
Height (cm) 171.37 ± 6.06 159.65 ± 4.48 0.000
Weight (kg) 79.57 ± 18.18 60.28 ± 10.23 0.000
Body mass index (kg/m2) 26.97 ± 5.36 23.62 ± 3.93 0.049
Body fat mass (kg) 22.80 ± 12.71 19.29 ± 6.11 0.631
Body fat percent (%) 27.17 ± 7.95 31.43 ± 4.92 0.053
Skeletal muscle mass (kg) 31.84 ± 4.24 22.08 ± 3.00 0.000
Waist circumference (cm) 91.81 ± 11.97 80.57 ± 12.18 0.018
Hip circumference (cm) 99.21 ± 9.75 89.82 ± 8.82 0.009
Waist-hip ratio 0.92 ± 0.05 0.90 ± 0.12 0.137
Values are expressed as means ± SD.

Blood samples

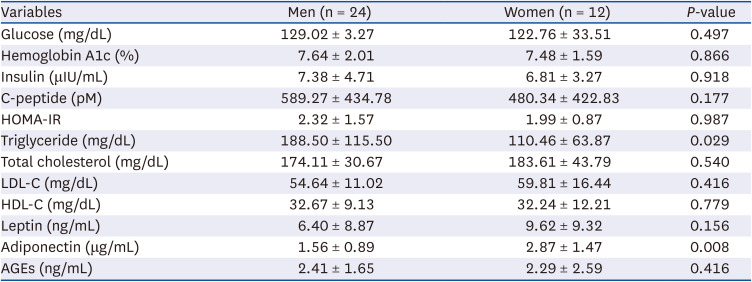
The glucose and lipid profiles of the included participants are presented in Table 3. Glycemic control was indicated by fasting glucose and hemoglobin A1c (HbA1c) levels, which showed abnormal levels in the current study (as expected in diabetic patients). There were no significant differences in mean glucose, HbA1c, insulin, C-peptide, HOMA-IR, TC, LDL-C, HDL-C, leptin, or AGE levels between men and women. However, men had significantly higher triglyceride levels than women (P < 0.05), and women had significantly higher adiponectin levels than men (P < 0.05).
Table 3

Blood metabolic profiles of participants with type 2 diabetes mellitus

nrp-17-464-i003
Variables Men (n = 24) Women (n = 12) P-value
Glucose (mg/dL) 129.02 ± 3.27 122.76 ± 33.51 0.497
Hemoglobin A1c (%) 7.64 ± 2.01 7.48 ± 1.59 0.866
Insulin (μIU/mL) 7.38 ± 4.71 6.81 ± 3.27 0.918
C-peptide (pM) 589.27 ± 434.78 480.34 ± 422.83 0.177
HOMA-IR 2.32 ± 1.57 1.99 ± 0.87 0.987
Triglyceride (mg/dL) 188.50 ± 115.50 110.46 ± 63.87 0.029
Total cholesterol (mg/dL) 174.11 ± 30.67 183.61 ± 43.79 0.540
LDL-C (mg/dL) 54.64 ± 11.02 59.81 ± 16.44 0.416
HDL-C (mg/dL) 32.67 ± 9.13 32.24 ± 12.21 0.779
Leptin (ng/mL) 6.40 ± 8.87 9.62 ± 9.32 0.156
Adiponectin (μg/mL) 1.56 ± 0.89 2.87 ± 1.47 0.008
AGEs (ng/mL) 2.41 ± 1.65 2.29 ± 2.59 0.416
Values are expressed as means ± SD.
HOMA-IR, homeostatic model assessment for insulin resistance; LDL-C, low-density lipoprotein cholesterol; HDL-C, high-density lipoprotein cholesterol; AGE, advanced glycation end-product.

REE

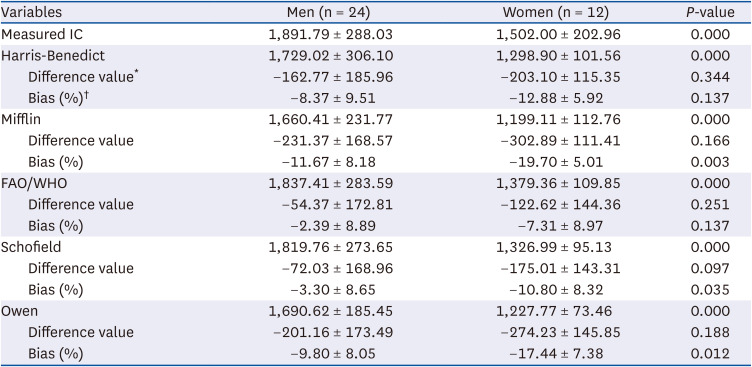
Measured and predicted REE values for the selected predictive equations are listed in Table 4. The mean REE value measured by indirect calorimetry was 1,891.79 kcal/day in men and 1,502.00 kcal/day in women (P < 0.001). The mean REE values estimated by the 5 predicted equations were also higher in men than in women (P < 0.001). Compared with measured REE values, REE values calculated using predictive REE equations for both men and women were underestimated when applying all 5 equations. According to our findings regarding bias percentage, the predicted equation that underestimated the measured REE to the greatest extent was the Mifflin equation (−11.67% in men, −19.70% women), followed closely by the Owen equation (−9.80% in men, −17.44% in women). There were no predictive equations that overestimated REE values. The equation that most closely predicted the measured REE values was the FAO/WHO equation (−2.39% in men, −7.31% in women), which used only weight in its predictive equation.
Table 4

Resting energy expenditure in participants with type 2 diabetes mellitus

nrp-17-464-i004
Variables Men (n = 24) Women (n = 12) P-value
Measured IC 1,891.79 ± 288.03 1,502.00 ± 202.96 0.000
Harris-Benedict 1,729.02 ± 306.10 1,298.90 ± 101.56 0.000
Difference value* −162.77 ± 185.96 −203.10 ± 115.35 0.344
Bias (%) −8.37 ± 9.51 −12.88 ± 5.92 0.137
Mifflin 1,660.41 ± 231.77 1,199.11 ± 112.76 0.000
Difference value −231.37 ± 168.57 −302.89 ± 111.41 0.166
Bias (%) −11.67 ± 8.18 −19.70 ± 5.01 0.003
FAO/WHO 1,837.41 ± 283.59 1,379.36 ± 109.85 0.000
Difference value −54.37 ± 172.81 −122.62 ± 144.36 0.251
Bias (%) −2.39 ± 8.89 −7.31 ± 8.97 0.137
Schofield 1,819.76 ± 273.65 1,326.99 ± 95.13 0.000
Difference value −72.03 ± 168.96 −175.01 ± 143.31 0.097
Bias (%) −3.30 ± 8.65 −10.80 ± 8.32 0.035
Owen 1,690.62 ± 185.45 1,227.77 ± 73.46 0.000
Difference value −201.16 ± 173.49 −274.23 ± 145.85 0.188
Bias (%) −9.80 ± 8.05 −17.44 ± 7.38 0.012
Values are expressed as means ± SD.
IC, indirect calorimetry; FAO, Food and Agriculture Organization of the United Nations; WHO, World Health Organization.
*Predicted − Measured (kcal per day); (Difference/Measured) × 100 (%).
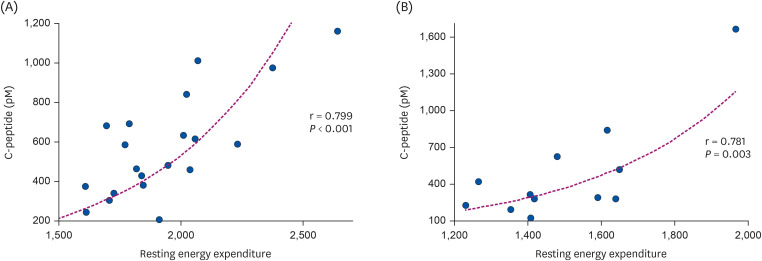
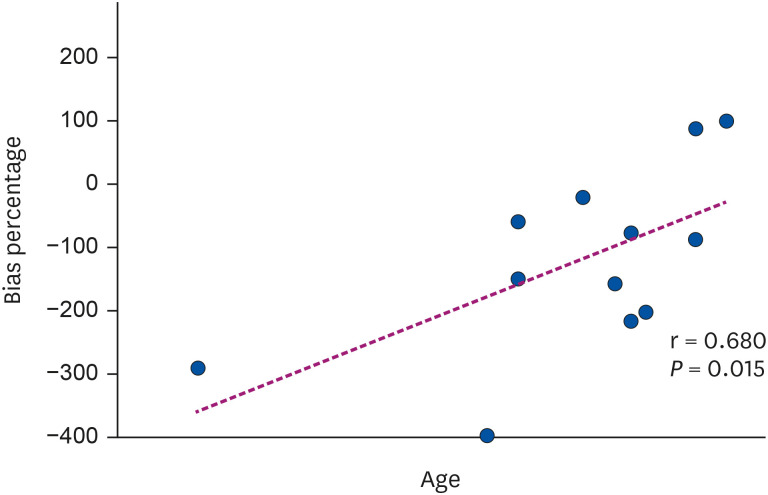
Pearson’s correlation analysis demonstrated that C-peptide levels were strongly associated with REE in both men and women (r = 0.799, P < 0.001 and r = 0.781, P = 0.003, respectively) (Fig. 1). In women, correlation analysis showed that age significantly correlated with the bias percentage between measured and predicted REE values when evaluating the FAO/WHO predictive equation (r = 0.680, P = 0.015) (Fig. 2). This indicates that the difference between measured REE values and REE values estimated from the predicted FAO/WHO equation increased with age. However, in men, age was not significantly correlated with the bias percentage between measured and predicted REE values (r = −0.343, P = 0.100).
Fig. 1

Correlation coefficients between C-peptide levels and resting energy expenditure in men (A) and women (B).

nrp-17-464-g001
Fig. 2

Correlation coefficient between age and bias percentage in regard to measured and predicted REE values derived using the FAO/WHO equation.

REE, resting energy expenditure; FAO, Food and Agriculture Organization of the United Nations; WHO, World Health Organization.
nrp-17-464-g002
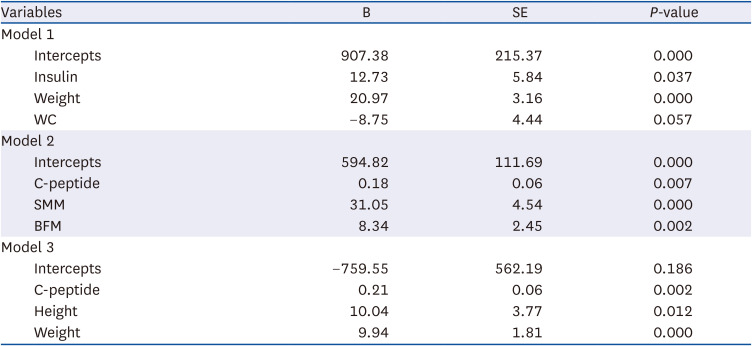
Multiple linear regression analysis was conducted to identify the independent variables influencing REE at the level of statistical significance. In the regression analysis for REE, several variables such as body weight, height and waist circumference (WC) as anthropometrics and body composition together with blood parameters, C-peptide, and insulin were selected. As height, weight, waist and hip circumferences, and C-peptide were positively correlated with REE and age was negatively correlated with REE, to separately analyze these variables, we used three sets of independent variables. Differences were considered significant at P < 0.05. Three models were developed, as shown in Table 5. The regressions revealed that all variables were significant estimators for insulin, WC, and weight in the first analysis (model 1); C-peptide, SMM, and BFM were significant in the second analysis (model 2); and C-peptide, height, and weight were significant in the third analysis (model 3).
Table 5

Linear multiple regression models predicting resting energy expenditure in participants with type 2 diabetes mellitus

nrp-17-464-i005
Variables B SE P-value
Model 1
Intercepts 907.38 215.37 0.000
Insulin 12.73 5.84 0.037
Weight 20.97 3.16 0.000
WC −8.75 4.44 0.057
Model 2
Intercepts 594.82 111.69 0.000
C-peptide 0.18 0.06 0.007
SMM 31.05 4.54 0.000
BFM 8.34 2.45 0.002
Model 3
Intercepts −759.55 562.19 0.186
C-peptide 0.21 0.06 0.002
Height 10.04 3.77 0.012
Weight 9.94 1.81 0.000
WC, waist circumference; SMM, skeletal muscle mass; BFM, body fat mass.

DISCUSSION

Accurate estimation of energy requirements is necessary for the effective nutritional management of patients with T2DM. When measurement using indirect calorimetry is not feasible or available, using predictive equations represents a valuable tool for predicting REE. However, compared to indirect calorimetry, the accuracy of predictive equations is low, especially in patients with chronic disease. More specifically, predictive equations tend to underestimate true REE values in patients with T2DM [25] and chronic obstructive pulmonary disease [26], whereas these equations conversely tend to overestimate REE values in patients with chronic kidney disease and cancer [27]. Few studies have evaluated REE values measured by indirect calorimetry with REE values predicted using equations in Korean patients with T2DM.
Our study assessed the accuracy of predictive equations developed in different populations of Korean patients with T2DM. The REE values calculated using all of the evaluated predictive equations (in both men and women) were found to underestimate measured REE values by as much as > 10%. There were no prediction equations that overestimated the true REE value. These results suggest that patients with T2DM consume more calories than predicted in regard to their REE, which explains the difficulty of caloric prescription with the goal of achieving glycemic control in patients with T2DM and obesity.
In the present study, the Schofield and FAO/WHO equations showed a difference between measured and predicted REE values of < 10%. A previous study conducted in obese adults with diabetes reported that the Harris-Benedict and FAO/WHO equations overestimated REE values measured using indirect calorimetry [18]. In one validation study, a version of the FAO/WHO equation using weight and height was the most accurate predictive equation [28], which agrees with our results. Overall, these results suggest that the Schofield and FAO/WHO equations are the most suitable for predicting REE in patients with T2DM.
Patients with T2DM have a significantly higher REE than non-diabetic adults [29]. Moreover, obese patients with T2DM are shown to have a higher REE than obese patients without T2DM, and fasting blood sugar level might be a major determinant of higher REE values [19]. In a prior study, REE was significantly higher among patients with high HbA1c levels [20]. Another study showed that insulin therapy was negatively correlated with REE in Japanese patients with T2DM and that endogenous insulin secretion measured using the glucagon test was an independent predictive factor for REE [21]. Interestingly, a recent study reported lower REE values in participants with a family history of diabetes mellitus (DM) who developed DM later in life [30].
Although the physiological mechanisms responsible for the higher REE seen in T2DM are presently unclear, poor glucose control has been attributed to increased glucose production rates that reflect high rates of gluconeogenesis, hyperglucagonemia, and higher protein turnover; these processes are considered as energy requirements [2031]. Thus, glycemic control significantly influences REE prediction. In a state of poor glucose control, this factor can amount to approximately 8% more energy spent at rest and leads to errors in dietary planning (resulting in a deficit in energy) [32]. Thus, we predictably observed a strong correlation between measured REE values and C-peptide levels in the current study.
Importantly, we found that age was a significant predictor of REE in females. Age-related decreases in REE that are dependent on changes in body composition have been reported in previous studies [33]. However, these findings are not consistent with our study, wherein the bias percentage in regard to measured and predicted REE was positively correlated with age. This finding indicates that, as age increases, the predicted REE values derived through the applied formulas are less accurate, especially in women. Moreover, age is related to a progressive decline in whole-body REE at a rate of 1-2% per decade after the age of 20 years [34]. This decrease is closely associated with a decline in whole-body FFM, which consists of metabolically active tissues and organs [35]. Further, as specific to women, this finding may be a result of changes in body composition caused by menopause [36]. However, the findings of a previous study suggested that age is a significant predictor of REE in overweight and obese Korean women [37]. Since age-related declines in REE are shown to occur due to a decline in FFM, we suggest evaluating REE through accurate (i.e., gold-standard) measurements of body composition (e.g., bioelectrical impedance analysis and dual-energy X-ray absorptiometry) with increasing age.
The predicted equation proposed in the present study was analyzed with various anthropometric, body composition, and blood parameter variables of Korean patients with T2DM. We concluded the resultant equation of 3 models for prediction in Korean patients with T2DM.
Predicted REE equation 1 = 907.38 + (12.73 × Insulin) + (20.97 × Weight) − (8.75 × WC)
Predicted REE equation 2 = 594.82 + (0.18 × C-peptide) + (31.05 × SMM) + (8.34 × BFM)
Predicted REE equation 3 = −759.55 + (0.21 × C-peptide) + (10.04 × Height) + (9.94 × Weight)
This study had some limitation. First, this was a relatively small-sample size cross-sectional study. Second, as the study participants were recruited at a single hospital, the healthy control group was limited. Furthermore, the observations made in this study are specific to the Korean population and should not be generalized to other ethnic populations. Moreover, we did not consider the effects of medications in our enrolled patients with T2DM. However, several studies have reported that REE levels are reduced after starting insulin therapy [38]. We suggest the importance of conducting a highly powered gold-standard study evaluating REE in T2DM patients. More specifically, future studies should include a larger sample size and should consider the influence of medications in prediabetic patients and patients with mild diabetes as compared with healthy subjects.
In conclusion, our study demonstrated large deviations in the accuracy of available REE predictive equations. REE predictive equations should be made more adequate to improve the efficacy of nutritional counseling and T2DM treatment. According to the results of the present study, we discourage the use of the predictive FAO/WHO equation in Korean patients with T2DM. We also found that, in patients with T2DM, glycemic control was predicted by C-peptide levels and age in women (i.e., these were the relevant determinant variables). Therefore, we conclude that including C-peptide levels and age in predictive equations for REE in female patients with T2DM would improve the accuracy of predictive equations. Our findings may help guide future research directions and directly inform clinical guidelines. We report a new equation using parameters readily available in clinical practice to predict the REE of Korean patients with T2DM. Further studies of the Asian population are needed to determine the usefulness and accuracy of the equation in clinical settings.

Notes

Funding: This work was supported by the National Research Foundation of Korea (NRF) grant funded by the Korea government (NRF-2016R1D1A1B03935660).

Conflict of Interest: The authors declare no potential conflicts of interests.

Author Contributions:

  • Conceptualization: Cho SR, Yim JE.

  • Formal analysis: Park JS, Yim JE.

  • Funding acquisition: Yim JE.

  • Investigation: Park JS, Yim JE.

  • Methodology: Park JS, Yim JE.

  • Supervision: Cho SR, Yim JE.

  • Writing - original draft: Park JS, Yim JE.

  • Writing - review & editing: Park JS, Yim JE.

References

1. Kim DJ, Lee MS, Kim KW, Lee MK. Insulin secretory dysfunction and insulin resistance in the pathogenesis of Korean type 2 diabetes mellitus. Metabolism. 2001; 50:590–593. PMID: 11319722.
2. International Diabetes Federation. Diabetes atlas 7th edition [Internet]. Brussels: International Diabetes Federation;c2022. cited 2022 May 10. Available from: http://www.diabetesatlas.org.
3. Yoon KH, Lee JH, Kim JW, Cho JH, Choi YH, Ko SH, Zimmet P, Son HY. Epidemic obesity and type 2 diabetes in Asia. Lancet. 2006; 368:1681–1688. PMID: 17098087.
4. Ministry of Health and Welfare, Korea Disease Control and Prevention Agency. Korea Health Statistics 2019: Korea National Health and Nutrition Examination Survey (KNHANES VI-3). Cheongju: Korea Disease Control and Prevention Agency;2020.
5. Beckman JA, Creager MA, Libby P. Diabetes and atherosclerosis: epidemiology, pathophysiology, and management. JAMA. 2002; 287:2570–2581. PMID: 12020339.
6. Evert AB, Boucher JL, Cypress M, Dunbar SA, Franz MJ, Mayer-Davis EJ, Neumiller JJ, Nwankwo R, Verdi CL, Urbanski P, et al. Nutrition therapy recommendations for the management of adults with diabetes. Diabetes Care. 2013; 36:3821–3842. PMID: 24107659.
7. American Diabetes Association (ADA). Standards of medical care in diabetes: Lifestyle management. Diabetes Care. 2018; 41:S38–S50. PMID: 29222375.
8. Compher C, Frankenfield D, Keim N, Roth-Yousey L. Evidence Analysis Working Group. Best practice methods to apply to measurement of resting metabolic rate in adults: a systematic review. J Am Diet Assoc. 2006; 106:881–903. PMID: 16720129.
9. Hill JO, Wyatt HR, Peters JC. The importance of energy balance. Eur Endocrinol. 2013; 9:111–115. PMID: 29922364.
10. Wang Z, Heshka S, Gallagher D, Boozer CN, Kotler DP, Heymsfield SB. Resting energy expenditure-fat-free mass relationship: new insights provided by body composition modeling. Am J Physiol Endocrinol Metab. 2000; 279:E539–E545. PMID: 10950820.
11. Delsoglio M, Achamrah N, Berger MM, Pichard C. Indirect calorimetry in clinical practice. J Clin Med. 2019; 8:1387. PMID: 31491883.
12. Harris JA, Benedict FG. A biometric study of human basal metabolism. Proc Natl Acad Sci U S A. 1918; 4:370–373. PMID: 16576330.
13. Mifflin MD, St Jeor ST, Hill LA, Scott BJ, Daugherty SA, Koh YO. A new predictive equation for resting energy expenditure in healthy individuals. Am J Clin Nutr. 1990; 51:241–247. PMID: 2305711.
14. Schofield WN. Predicting basal metabolic rate, new standards and review of previous work. Hum Nutr Clin Nutr. 1985; 39(Suppl 1):5–41. PMID: 4044297.
15. Food and Agriculture Organization of the United Nations (FAO). Energy and Protein Requirements: Report of a joint FAO/WHO/UNO Expert Consultation. Geneva: World Health Organization;1985.
16. Sabounchi NS, Rahmandad H, Ammerman A. Best-fitting prediction equations for basal metabolic rate: informing obesity interventions in diverse populations. Int J Obes. 2013; 37:1364–1370.
17. Madden AM, Mulrooney HM, Shah S. Estimation of energy expenditure using prediction equations in overweight and obese adults: a systematic review. J Hum Nutr Diet. 2016; 29:458–476. PMID: 26923904.
18. de Figueiredo Ferreira M, Detrano F, Coelho GM, Barros ME, Serrão Lanzillotti R, Firmino Nogueira Neto J, Portella ES, Serrão Lanzillotti H, Soares Ede A. Body composition and basal metabolic rate in women with type 2 diabetes mellitus. J Nutr Metab. 2014; 2014:574057. PMID: 25436144.
19. Miyake R, Ohkawara K, Ishikawa-Takata K, Morita A, Watanabe S, Tanaka S. Obese Japanese adults with type 2 diabetes have higher basal metabolic rates than non-diabetic adults. J Nutr Sci Vitaminol (Tokyo). 2011; 57:348–354. PMID: 22293212.
20. Alawad AO, Merghani TH, Ballal MA. Resting metabolic rate in obese diabetic and obese non-diabetic subjects and its relation to glycaemic control. BMC Res Notes. 2013; 6:382. PMID: 24070224.
21. Ikeda K, Fujimoto S, Goto M, Yamada C, Hamasaki A, Shide K, Kawamura T, Inagaki N. Impact of endogenous and exogenous insulin on basal energy expenditure in patients with type 2 diabetes under standard treatment. Am J Clin Nutr. 2011; 94:1513–1518. PMID: 22049163.
22. Miyake R, Tanaka S, Ohkawara K, Ishikawa-Takata K, Hikihara Y, Taguri E, Kayashita J, Tabata I. Validity of predictive equations for basal metabolic rate in Japanese adults. J Nutr Sci Vitaminol (Tokyo). 2011; 57:224–232. PMID: 21908945.
23. Tabata S, Kinoshita N, Yamada S, Matsumoto H. Accuracy of basal metabolic rate estimated by predictive equations in Japanese with type 2 diabetes. Asia Pac J Clin Nutr. 2018; 27:763–769. PMID: 30045419.
24. Son HR, Yeon SE, Choi JS, Kim EK. The measurements of the resting metabolic rate (RMR) and the accuracy of RMR predictive equations for Korean farmers. Korean J Community Nutr. 2014; 19:568–580.
25. Behera KK, Joseph M, Shetty SK, Chacko A, Sahoo MK, Mahendri NV, Nair V, Nadig S, Thomas N. Resting energy expenditure in subjects with fibro-calculous pancreatic diabetes. J Diabetes. 2014; 6:158–163. PMID: 23773615.
26. Ramos FM, Rossato LT, Ramires BR, Pimentel GD, Venâncio LS, Orsatti FL, de Oliveira EP. Comparison of predictive equations of resting energy expenditure in older adults with chronic obstructive pulmonary disease. Rev Port Pneumol (2006). 2017; 23:40–42. PMID: 27771344.
27. Khor SM, Mohd BB. Assessing the resting energy expenditure of cancer patients in the Penang General Hospital. Malays J Nutr. 2011; 17:43–53. PMID: 22135864.
28. Frankenfield D, Roth-Yousey L, Compher C. Comparison of predictive equations for resting metabolic rate in healthy nonobese and obese adults: a systematic review. J Am Diet Assoc. 2005; 105:775–789. PMID: 15883556.
29. Gougeon R. Thermic and metabolic responses to oral glucose in obese subjects with non-insulin-dependent diabetes mellitus treated with insulin or a very-low-energy diet. Am J Clin Nutr. 1996; 64:78–86. PMID: 8669419.
30. Nyenwe EA, Ogwo CC, Owei I, Wan JY, Dagogo-Jack S. Parental history of type 2 diabetes is associated with lower resting energy expenditure in normoglycemic subjects. BMJ Open Diabetes Res Care. 2018; 6:e000511.
31. Taguchi M, Ishikawa-Takata K, Tatsuta W, Katsuragi C, Usui C, Sakamoto S, Higuchi M. Resting energy expenditure can be assessed by fat-free mass in female athletes regardless of body size. J Nutr Sci Vitaminol (Tokyo). 2011; 57:22–29. PMID: 21512287.
32. Heshka S, Feld K, Yang MU, Allison DB, Heymsfield SB. Resting energy expenditure in the obese: a cross-validation and comparison of prediction equations. J Am Diet Assoc. 1993; 93:1031–1036. PMID: 8360408.
33. Hunter GR, Weinsier RL, Gower BA, Wetzstein C. Age-related decrease in resting energy expenditure in sedentary white women: effects of regional differences in lean and fat mass. Am J Clin Nutr. 2001; 73:333–337. PMID: 11157332.
34. Elia M, Ritz P, Stubbs RJ. Total energy expenditure in the elderly. Eur J Clin Nutr. 2000; 54(Suppl 3):S92–103. PMID: 11041080.
35. Poehlman ET, Toth MJ, Webb GD. Sodium-potassium pump activity contributes to the age-related decline in resting metabolic rate. J Clin Endocrinol Metab. 1993; 76:1054–1057. PMID: 8386182.
36. Melanson EL, Gavin KM, Shea KL, Wolfe P, Wierman ME, Schwartz RS, Kohrt WM. Regulation of energy expenditure by estradiol in premenopausal women. J Appl Physiol. 2015; 119:975–981. PMID: 26338457.
37. Park JS, Yim JE. Comparison of predicted and measured resting energy expenditure in overweight and obese Korean women. Korean J Community Nutr. 2018; 23:424–430.
38. Buscemi S, Donatelli M, Grosso G, Vasto S, Galvano F, Costa F, Rosafio G, Verga S. Resting energy expenditure in type 2 diabetic patients and the effect of insulin bolus. Diabetes Res Clin Pract. 2014; 106:605–610. PMID: 25312871.
TOOLS
Similar articles