

 PDF
PDF Citation
 Print
Print


INTRODUCTION
The last few decades have seen a significant increase in interest in the role of vitamin D in health and disease. This interest is triggered by expanding research suggesting that vitamin D is related not only to skeletal health but also to a myriad of other health conditions including obesity, the metabolic syndrome, cardiovascular disease, cancer, diabetes, and immunity against infectious diseases [1]. Data from the Korea National Health and Nutrition Examination Survey (KNHANES) 2008–2014 reveals that the prevalence rate of vitamin D deficiency among Koreans has been gradually increasing from 51.8% for males and 68.2% for females in 2008 to 75.2% for males and 82.5% for females in 2014 [2].
It is very difficult to determine the causes of vitamin D deficiency. This is because both food intake and biosynthesis in the skin contribute to the vitamin D pool in the body. Furthermore, it is difficult to estimate the amount of vitamin D contributed by biosynthesis because this is influenced by various factors, such as age, sunlight exposure, and outdoor activity [345]. In estimating the dietary vitamin D intake, there are also challenges due to the lack of a comprehensive database (DB) of vitamin D from food sources [6].
The rate at which items are being added to the vitamin D DB for inclusion in the food composition table is low in Korea. In the Korean food composition table [7] (published by the National Institute of Agricultural Sciences, ver. 9.2), only 51% of the listed food groups had data on vitamin D. Similarly, in the food items listed by the Ministry of Food and Drug Safety (MFDS), Korea, even if the nutrition facts of eating out [89] and nutrition facts of processed food are combined [1011], only 41% of the listed food items had data on vitamin D. Kim et al. [12] improved the availability of information by adding vitamin D data relating to 397 foods to the DB established by the Korean Nutrition Society, using data sourced from Japan and the United States (US). However, this is still insufficient to estimate the dietary vitamin D intake of Koreans, accurately.
Therefore, in this study, a vitamin D DB for the foods included in the KNHANES 2016–2019 was constructed, and by using it, the vitamin D intake of Koreans and major vitamin D-rich food sources were analyzed.
SUBJECTS AND METHODS
Study population
This study used data from the KNHANES 2016–2019. We used raw data files and documentation released by the Korea Disease Control and Prevention Agency (https://knhanes.cda.go.kr, accessed on March 2, 2021). This study included 28,418 individuals out of the 31,379 participants in the KNHANES 2016–2019. The protocol of the KNHANES 2016–2019 was approved by the Institutional Review Board (IRB) of the Korea Centers for Disease Control and Prevention (IRB approval numbers 2016–2018 and 2019–2021: 2018-01-03-P-A and 2018-01-03-C-A). Written informed consent was obtained from all the participants.
Establishment of a vitamin D DB
A vitamin D content DB was established for food items reported to be consumed by the KNHANES 2016–2019 (n = 4,289). The Greenfield and Southgate [13] and the Food and Agricultural Organization of the United Nations/International Network of Food Data Systems (FAO/INFOODS) [14] methods were used as the basis for the compilation and calculation of vitamin D values for the food composition DB. For DB construction, we set down the principles for the quality evaluation of data sources, the order of use, and the application of substitute values, and then established guidelines based on these principles [15]. The data sources used to build the vitamin D DB were as follows: The Korean food composition table (ver. 9.2) of the National Institute of Agricultural Sciences [7], the nutrition facts of eating out [89], and nutrition facts of processed foods published by the MFDS, Korea [1011], the China food composition table (6th edition) [1617], the Japanese standard food composition DB (7th version) [18], the US food composition and nutrient DB: SR 28 and Branded [19], and the AUStralian Food and NUTrient Database 2011–2013 [20] and Food Standards Australian New Zealand (2019) [21].
The basic principles of building a vitamin D DB were as follows: For the same food with the same properties, the vitamin D value of the existing DB was taken as is. In other words, for raw foods, data from the Korean food composition table DB (ver. 9.2) of the National Institute of Agricultural Sciences was taken, and data from the processed food DB of the MFDS was taken for processed foods. Data from Korea, Japan, China, the US, and Australia/New Zealand were taken in that order. When it was impossible to get data for domestic production, data from Asian countries (Japan, China) neighboring Korea, the US, and Australia/New Zealand were applied in that order, according to the principle of applying the short-distance DB first.
In the second step, if there was no food with the same properties, a substitute value was taken. The substitute value was calculated using the percentage of solids and taking into consideration the moisture content in the raw foods based on different recipes or processing methods. In the case of processed foods, the vitamin D information presented on the nutrition label sourced through an Internet search was taken. However, in the case of processed foods for which nutrition labeling was not available, the value was calculated by considering the representative value of the same processed food or by applying the vitamin D values based on the ratio of the ingredients for high-consumption products. In the case of foods for which substitution values could not be applied, a value of zero was taken if the vitamin D value of a similar species was zero for plant foods. Missing values were applied if zero values could not be applied. The information on specific forms of vitamin D, namely ergocalciferol (vitamin D2) and cholecalciferol (vitamin D3) in each food item was also collected, and the sum of vitamin D2 and D3 was defined as the vitamin D value.
As a final step, the newly constructed vitamin D DB was reviewed to ensure that the vitamin D value was not greater than the sum of the 2 forms of vitamin D, vitamin D2 and vitamin D3 contents according to the FAO/INFOODS guidelines [14], and was finalized after consulting with experts.
Vitamin D DB coverage
Out of 4,289 food items considered, the vitamin D content of only 4,273 food items were included in the DB, leaving 16 missing values. The new DB thus had vitamin D data on 99.63% of the food items contained in it. Food items for which vitamin D2 and vitamin D3 contents were separately presented were 72.21, and 79.3%, respectively (Table 1).
Table 1
Data sources of vitamin D DB
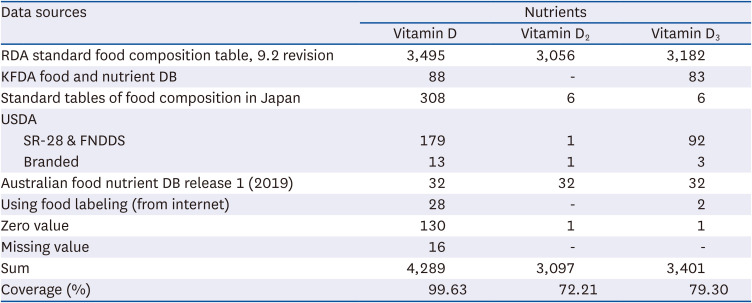
DB, database; RDA, Rural Development Administration; KFDA, Korea Food and Drug Administration; USDA, United States Department of Agriculture; SR28, Standard Reference 28; FNDDS, Food and Nutrient Database for Dietary Studies; Vitamin D2, ergocalciferol; Vitamin D3, cholecalciferol.
Estimation of dietary vitamin D intake
After matching the newly constructed vitamin D DB based on the primary food code of the 24-h dietary survey of the KNHANES 2016–2019, the vitamin D dietary intakes were analyzed. Adequate dietary intake (%) was expressed as the percentage of dietary vitamin D intake to the adequate intake (AI) of each sex and age, as suggested in the 2020 Dietary Reference Intakes for Koreans (KDRIs), or as the proportion of subjects who consumed more than the AI. Also, major food sources contributing to the dietary vitamin D were identified by calculating the dietary intake for each food and food group [6].
Sociodemographic variables
Data on sex, age, area of residence, and income level were used as socioeconomic indicators. Based on the 2020 KDRIs, age was divided into categories of 1–2 yrs, 3–5 yrs, 6–11 yrs, 12–18 yrs, 19–29 yrs, 30–49 yrs, 50–64 yrs, and over 65 yrs. Income level was analyzed by dividing it into quartiles.
Statistical analysis
Data analyses were performed using the SAS 9.4 software (SAS Institute, Cary, NC, USA). The dietary intake and adequacy of vitamin D were estimated using the PROC SURVEYMEANS and PROC SURVEYFREQ procedures. The means and standard errors by sex, age group, residence area, and household income level were presented and the differences between subgroups were tested using the PROC SURVEYREG procedure. To identify the major food sources of vitamin D, the dietary vitamin D intake from each food group and the dietary contribution (%) of each food to the total daily vitamin D intake were estimated using the PROC SURVEYMEANS procedure. In all analyses, the sampling weights and survey design were considered. Results were regarded as significant at a P-value < 0.05.
RESULTS
Dietary vitamin D intake and the prevalence of adequacy intake
The mean dietary vitamin D intake and the prevalence of vitamin D adequacy intake of Koreans are shown in Table 2. The mean dietary vitamin D intake was 3.13 μg/d for subjects aged 1 yr and older, and 3.97 μg/d and 2.91 μg/d for males and females respectively, aged 19 yrs and older. There was a significant difference in vitamin D intake according to age (P < 0.001). For both males and females, the 30–49 and 50–64-year-old age groups had a higher vitamin D intake than the other age groups. The lowest vitamin D intake was in males aged 3–5 yrs and in females, aged 65 yrs or older. The intake of vitamin D in urban females (2.61 μg/d) was higher than that of rural females (2.27 μg/d) (P < 0.001). However, in the case of males, there was no significant difference according to the residence area. There was a significant difference in vitamin D intake according to income levels. In all the subjects, the vitamin D intake of the low-income group was lower than that of the high-income group (P < 0.001).
Table 2
Dietary vitamin D intake and prevalence of vitamin D adequacy intake, KNHANES 2016–2019
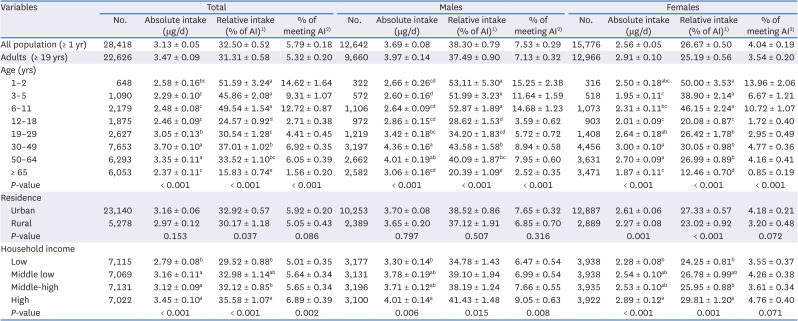
Data are presented as mean ± SE or percentage ± SE. AI stands for adequate intake.
AI, adequate intake.
1)Relative intake was calculated as dietary total vitamin D intake (%) of the AI for each sex and age group of the Korean Dietary Reference Intakes 2020.
2)The proportion means the prevalence of subjects whose intakes were more than AI.
a,b,c,dDifferences between the means by groups.
The dietary adequacy of vitamin D intake is presented as relative intake (%) with respect to AI based on the 2020 KDRIs. The mean relative vitamin D intake for all subjects was 32.5%, and only 5.79% of subjects consumed more vitamin D than the AI. The mean dietary relative intake of vitamin D for male and female adults was 37.49% and 25.19%, respectively. Inadequate vitamin D intake was observed more frequently for older individuals, female rural residents, and individuals with a low income. For the elderly (≥ 65 yrs), only 1.56% met the AI. Specifically, 99.15% of elderly females had a lower vitamin D intake than the AI. The mean vitamin D intake of subjects in the age group 12–18 yrs was only 24.57% of AI. Rural residents had significantly lower relative dietary vitamin D intake as a percentage of AI, compared to urban residents (P < 0.05). This difference was greater in the female subjects (P < 0.001).
Major foods contributing to dietary vitamin D intake
Table 3 shows the mean dietary vitamin D intake for each food group by sex. The major contributors to dietary vitamin D intake were fish and shellfish (1.926 μg/d) and eggs (0.555 μg/d), followed by meat (0.251 μg/d), legumes (0.123 μg/d) and grains (0.120 μg/d). The intake of vitamin D from grains, mushrooms, meat, eggs, seafood, and oils and fats showed a significant difference between males and females. However, there was no difference in the ranking of the intake contribution among males and females (Table 3).
Table 3
Contributions of food groups to vitamin D intake in Koreans by sex, Korea National Health and Nutrition Examination Survey 2016–2019 (unit: μg/d)
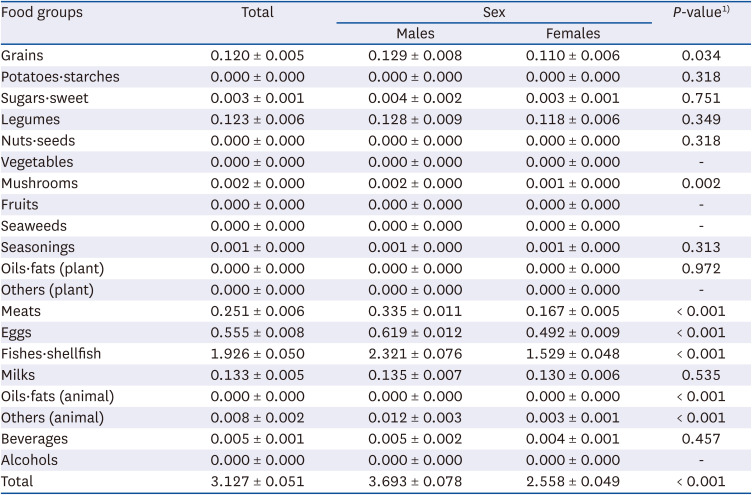
Table 4 and Fig. 1 show the mean dietary vitamin D intake for each food group by age. For all subjects aged 3 yrs and older, the major contributors to total dietary vitamin D intake were fish and shellfish, and eggs. The third-priority food was different by age, with milk for ages 3 to 11 yrs, and meat for the age group over 12 yrs.
Table 4
Contributions of food groups to vitamin D intake in Koreans by age groups, Korea National Health and Nutrition Examination Survey 2016–2019 (unit: μg/d)
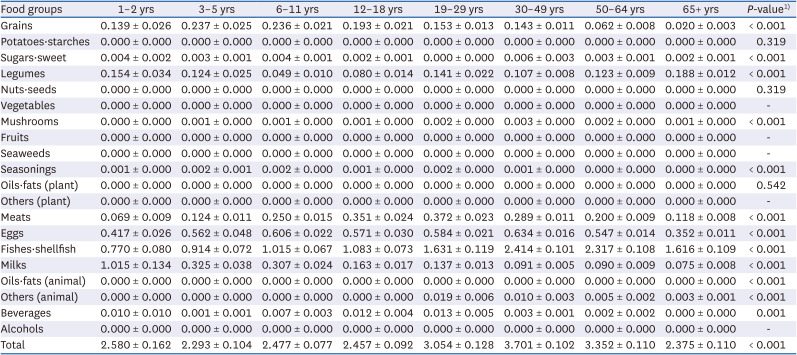
Fig. 1
Contribution of food groups to dietary vitamin D intake of Koreans aged 1 yr or older, Korea National Health and Nutrition Examination Survey 2016–2019.

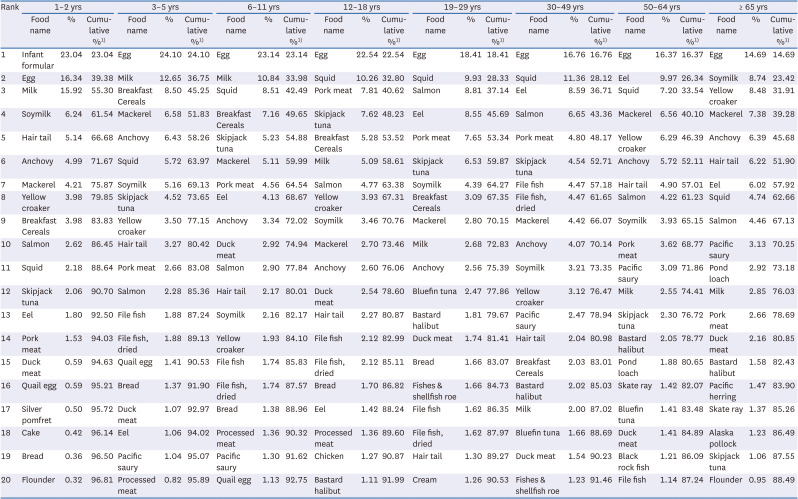
Tables 5 and 6 show the top 20 food contributors to vitamin D intake. These items accounted for up to 88% of the total vitamin D intake. Eggs, squid, and eels were the top 3 contributors for males and females (Table 5). The next ranked contributors were mackerel, pork, and yellow croakers for males, and salmon, mackerel, and anchovies for females. The main source ds differed slightly by age. For those aged 3–18 yrs, breakfast cereals and for those aged 65 yrs and over, soymilk were included in the top 5 (Table 6).
Table 5
Top 20 foods contributing to vitamin D intake of Koreans by sex, Korea National Health and Nutrition Examination Survey 2016–2019
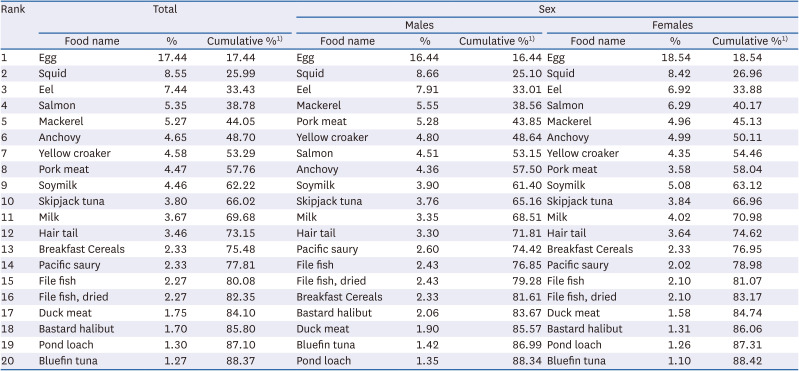
Table 6
Top 20 foods contributing to vitamin D intake of Koreans by age groups, Korea National Health and Nutrition Examination Survey 2016–2019
DISCUSSION
The rate at which the existing vitamin D DB was expanding to include new food items was very low. There was a limited number of foods with vitamin D data in the existing DB and this was insufficient to understand the vitamin D intake of Koreans. In this study, we constructed a new updated vitamin D DB. Moreover, the vitamin D intake by sex and age, and the major food sources of vitamin D were analyzed using this new vitamin D DB. We developed a vitamin D DB incorporating 4,273 foods excluding 16 out of total foods in KNHANES 2016–2019 (construction rate 99.63%). This rate is very high compared to that of the Korean food composition table (ver. 9.2) by the National Institute of Agricultural Sciences (50%) [7] and the food items listed by the MFDS (41%) [891011].
As a result of analyzing the KNHANES 2016–2019 data using the new DB, the mean vitamin D intake was found to be 3.13 μg/d for participants 1-year-old and older, and 3.47 μg/d for 19-year-olds and older (males 3.97 μg/d, females 2.91 μg/d) (Table 2). This is similar to the vitamin D intake of adults (males 3.84 µg/d, females 2.22 µg/d) obtained by reanalyzing the KNHANES 2011 data reported by Kim et al. [12]. Also, this is not very different from the data of other countries. The mean daily intake of vitamin D for Japanese aged 1 year and older calculated from the Japan National Health and Nutrition Survey 2003–2009 data was 3.7 to 10.3 μg/d [22]. In Taiwan, as per the 1993–2002 Nutrition and Health Survey in Taiwan, the intake of vitamin D for Taiwanese aged 6 yrs and older was 3.24 μg/d [23]. The intake of vitamin D for Spanish people aged 18 to 60 yrs was 3.5 μg/d in VALORNUT research group [24]. In the National Diet and Nutrition Survey 2008–2012 analysis, the intake of vitamin D in the UK was 3.13 μg/d for adult males and 2.5 μg/d for adult females [25].
However, in the NHANES 2011–2014, the vitamin D intake of Americans was 4.9 μg/d [26], which was higher than that seen in this study. According to Calvo et al. [27], the vitamin D intake of Americans and Canadians is dependent on fortified foods. The main sources of vitamin D in the US and Canada were milk and cereals, and milk and margarine, respectively. In Canada, the fortification of milk and margarine with vitamin D is mandatory, and in the US, while there is no mandatory regulation, various foods, including most commercially available milk are fortified with vitamin D. In this study, the main sources for the intake of vitamin D were eggs, squid, eels, and salmon. The reason Koreans consume less vitamin D than Americans or Canadians can be attributed to the fact that Koreans consume vitamin D mainly from raw foods that are not fortified with vitamin D.
In this study, the vitamin D intake of 1-year-old and older subjects was 32.5% of the AI, and only 5.79% of subjects met the AI standards. This is fairly low even considering that supplementary vitamin intake was excluded. However, the actual nutritional deficiency status of vitamin D in Koreans is assumed to be less severe. In the KNHANES 2008–2014, the serum vitamin D concentration of subjects aged 10 yrs or older was measured temporarily, and 65.7% of Korean males and 76.7% of females were determined to have vitamin D deficiency [2]. This suggests that an analysis of vitamin D intake only from foods has limited utility in assessing the vitamin D status. Nevertheless, dietary vitamin D intake is still important for maintaining an adequate vitamin D status. Kim et al. [12] analyzed the relationship between vitamin D intake and serum vitamin D concentrations in KNHANES 2011 based on a self-constructed vitamin D DB. In the case of subjects under 50 yrs, the vitamin D concentrations in the serum were higher in the group whose vitamin D intake was 10 μg/d or higher than the group whose intake of vitamin D was less than 5 μg/d. Thus, a positive correlation was observed between the serum vitamin D concentrations and supplement intake [12].
In this study, 99.5% of elderly females and 97.48% of elderly males consumed vitamin D below the AI (Table 2). In other words, vitamin D malnutrition in the elderly is serious regardless of their sex. Maintaining adequate dietary vitamin D intake is more important in the elderly than in other age groups because of reduced exposure to the sun due to fewer outdoor activities and decreased vitamin D synthesis rate through the skin [28]. Serum vitamin D levels have been reported to be positively correlated with dietary vitamin D intake [2930]. Therefore, insufficient intake of vitamin D-rich foods has the potential to worsen the vitamin D deficiency status. However, in a study analyzing the serum vitamin D concentrations of Koreans aged 10 yrs or older [2], these levels were the highest in the elderly for both males and females compared to other age groups despite the low vitamin D intake from food. This may be due to the high intake of vitamin D from supplements [3132]. In fact, in the KNHANES 2017, it was reported that 38.6% of people 65 yrs and older were taking supplements [30].
As such, the nutritional status of vitamin D must take into account both, intake through diet and supplementation, and synthesis in the skin. Although there is a limitation in analyzing only dietary vitamin D in this study, it was meaningful to calculate the intake more accurately using a higher-quality DB than before. In the future, research should be conducted to enable a more accurate prediction of vitamin D status based on consumption and synthesis.
In our study, only 24.75% of adolescents met the AI standards for vitamin D, which is the second lowest group after the elderly. Yu et al. [33] reported that the serum vitamin D concentrations of adolescents aged 12 to 18 yrs who participated in the KNHANES 2008–2009 varied according to the season, and the vitamin D deficiency rate was 39.4% from December to May compared to 9.9% from June to November. The nutritional status of vitamin D in adolescence is important as it is the period of vigorous physical development. Vitamin D is involved in maintaining calcium homeostasis and it contributes to the formation of peak bone density and lowers the risk of osteoporosis later in life [34]. Therefore, nutrition education through a regular curriculum and appropriate policies for school meals are needed to improve vitamin D intake in adolescents.
Dietary vitamin D intake was lower among females in the rural areas than those living in urban areas. Interestingly, however, several studies have reported good serum vitamin D levels among rural residents [2]. It has been suggested that even though the dietary intake of vitamin D is insufficient, in people living in the rural setting, sufficient exposure to sunlight may be improving their vitamin D status. It is therefore clear that, in determining the nutritional status of vitamin D, outdoor activity and sunlight should be considered in addition to dietary vitamin D intake.
We have identified fishes and shellfish to be the major vitamin D contributing food groups for all ages. This is consistent with the results obtained by the food frequency questionnaire method of the KNHANES [2933]. In previous studies, mackerel, anchovies, fish, and milk were reported as the main foods closely related to the 25-hydroxyvitamin D [25(OH)D] concentration levels in the serum [33]. In this study, the main sources of vitamin D intake for all subjects were eggs, squid, eels, mackerel, and anchovies. Unlike the previous studies, eggs were identified as a new major source of vitamin D intake with a 17.44% vitamin D intake rate, which is fairly high. In all age groups, eggs ranked first or second as the main source of vitamin D. This is thought to be the result of the distribution of special eggs produced by adding omega fatty acids or vitamin D to the poultry feed to enhance the nutritional value of the eggs. However, the extent to which the intake of major vitamin D dietary sources investigated in this study will affect the 25(OH)D levels is still unknown. Most studies evaluating the vitamin D status, use 25(OH)D as the serum biomarker to determine vitamin D adequacy, insufficiency, or deficiency. Future studies should be conducted on the relationship between vitamin D consumption and serum 25(OH)D levels. The vitamin D DB developed in this study is meaningful as it utilizes the latest food and nutrition DB data from domestic and international accredited institutions according to established standards and principles and shows a high construction rate of 99.63%. However, there are limitations in that the analyzed value was less than 25%, and the replacement value was applied to 50% or more. Nevertheless, it is superior in quantity and quality compared to the existing DBs, and it is thought that it can be used in various fields as a substitute for KNHANES data analysis.
In conclusion, this study is significant in that it established a new vitamin D DB that covers more than 90% of food items used as part of the KNHANES. It can be used, therefore, to analyze the vitamin D intake of Koreans using the KNHANES 2016–2019 data. The vitamin D intake of Koreans is very low compared to the AI standards. However, this study was unable to cover the large difference in daily vitamin D intake because it was based on the data investigated by the 24-h dietary recall method. An additional limitation is that the study did not analyze vitamin D intake through supplementation. Therefore, further studies are needed which would consider multi-day diet surveys, supplementary vitamin D intake, and biosynthesis in the skin to determine the vitamin D nutritional status of Koreans more accurately.
 XML Download