

 PDF
PDF Citation
 Print
Print


INTRODUCTION
According to a recent estimate of the International Diabetes Federation, 451 million adults were living with diabetes worldwide in 2017, and this number is projected to increase to 693 million by 2045 if no effective prevention methods are implemented [1]. Type 2 diabetes mellitus (T2DM), the most common type of diabetes, accounting for over 90% of diabetes cases, is the result of a complex interaction between genetic and environmental factors, including highly calorific diets [2]. Identifying the modifiable risk factors for T2DM can facilitate the prevention of the development, progression, and aggravation of T2DM [1].
Previous studies have reported that salt intake is closely associated with insulin resistance, hyperinsulinemia, abnormal blood glucose level, as well as the progression and complications of T2DM [345]. However, the results of these studies are inconsistent: some of them found that a high-salt intake triggered insulin resistance [67], whereas others indicated that no significant evidence existed that salt restriction induced insulin resistance [89]. This inconsistency might originate from different study designs, including the specific study population, the definition of low- and high-salt intakes, the assessment approaches, the duration of the salt intake, and the sample size [6789].
A crossover study is a special type of randomized controlled trial (RCT) in which the participants serve as their own controls [10]. Hence, the effects of potential confounding factors between subjects are effectively minimized, resulting in reduced patient variability, greater power, and a smaller sample size compared with those of a parallel design study [11]. The advantages of a crossover study include homogeneity between the intervention and the control groups, controlled confounding variables, reduced bias, high internal but low external validity.
We performed a meta-analysis including only crossover designs to analyze the relationship between salt intake and glucose levels. We aimed to identify modifiable risk factors for diabetes mellitus and to provide evidence for salt intake recommendations.
MATERIALS AND METHODS
Literature search
We conducted a literature search in 5 electronic databases: PubMed, Web of Science, EMBASE, CNKI, and Wanfang (last search on August 1, 2021). The search strategy included the following terms: “diet salt restriction and insulin resistance” (abstract/title), and “salt intake restriction and diabetes” (abstract/title), and “salt intake restriction and blood glucose” (abstract/title). Besides, we also reviewed reference lists of relevant original and review articles to search for additional trials. No language restrictions were applied.
Inclusion criteria
The following inclusion criteria were implemented: First, the trial design was a crossover study with an assignment of an intervention group and a control group by randomization and blinding. In addition, a washout period was required before the participants were crossed. Second, no other interventions, including drug intervention, were conducted except for salt intake. Third, the trial presented the results of serum blood glucose levels. Fourth, referring to the 2015–2020 Dietary Guidelines for Americans, the daily sodium intake of the high-salt group was not less than 2,300 mg, and the daily sodium intake of the low-salt group did not exceed 2,300 mg.
Quality assessment
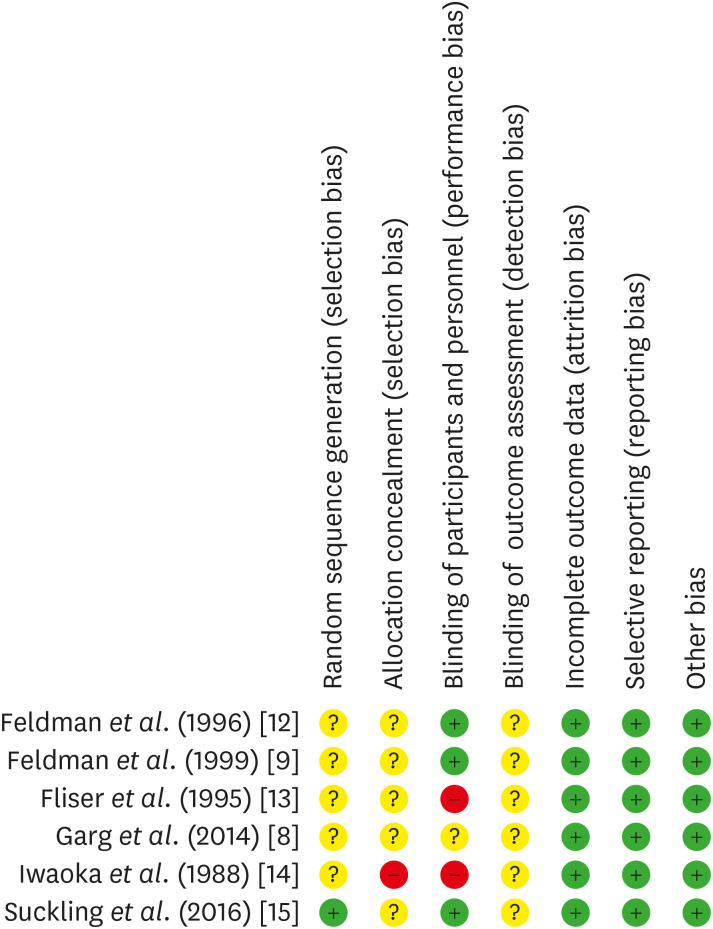
The Cochrane tool was applied to quantitively assess the study quality of the RCTs. This tool was comprised of 7 main aspects, which were as follows: First, random sequence generation (selection bias); Second, allocation concealment (selection bias); Third, blinding of participants and personnel (performance bias); Fourth, blinding of outcome assessment (detection bias); Fifth, incomplete outcome data (attrition bias); Sixth, selective reporting (reporting bias); Seventh, other bias.
The risk of bias map was drawn using Review Manager 5 software (The Cochrane Collaboration, Copenhagen, Denmark). A low risk indicated that the presence of bias was unlikely to significantly affect the results, whereas a high risk indicated that the bias undermined the confidence of the results.
Data extraction and outcome measures
We extracted the data into an Excel sheet, which included the author, country of the author, number of participants, age of participants, intervention approach, method of randomization, method of blinding, and the intervention durations of all eligible studies. In addition to the aforementioned information, we also extracted the data of the respective mean and standard deviation of the post-intervention serum blood glucose levels in each study. The data extraction was conducted by 2 investigators (Yujie Shi and Jiajing Cui). In case of nonagreement between the 2 investigators, a third investigator (Yong Shen) reviewed the case and analyzed the data until a consensus was reached.
Statistical analyses
STATA 15.1 (StataCorp LLC, College Station, TX, USA) was used to process the blood glucose data we collected. We applied a fixed-effects model to calculate the effect size for continuous variables: weighted mean difference (WMD). I2 statistic was calculated to quantify potential heterogeneity. I2 < 50% was considered to represent an insignificant level of heterogeneity. In contrast, when I2 > 50%, sensitivity and subgroup analyses were necessary to explore the probable sources of the existing heterogeneity, and a random-effects model was considered to be more appropriate and rational to pool the effect size. The publication bias was tested by the Egger’s regression-based test. A symmetric funnel plot as well as P > 0.05 indicated an insignificant publication bias. If such a bias was already in place, we further used the trim-and-fill method to establish its impact on our results.
RESULTS
Retrieval of literature and study characteristics
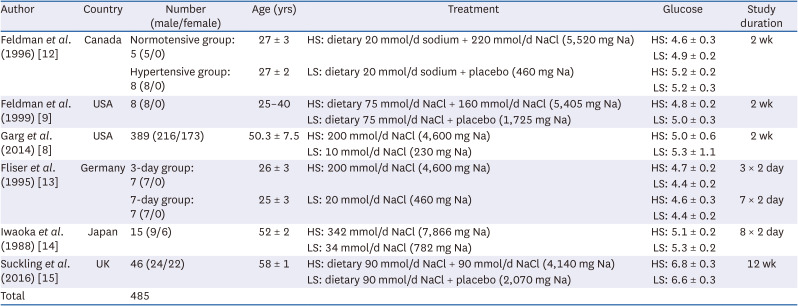
The whole process of our literature search is displayed on Fig. 1. A total number of 124 articles were identified from 5 databases: PubMed, Web of Science, Embase, Wanfang, and CNKI, but 3 duplicate articles were removed. After reading the titles and abstracts, we further excluded 99 non-RCT articles or such involving interventions other than salt intake. Then, we meticulously read through the remaining 22 publications with full texts, and sorted out another 15 which were not cross-over trials or did not present the blood glucose levels of the participants. Finally, 6 studies meeting our inclusion criteria were chosen and included in our meta-analysis (Table 1). Fig. 2 represents the summary of the quality evaluation results.
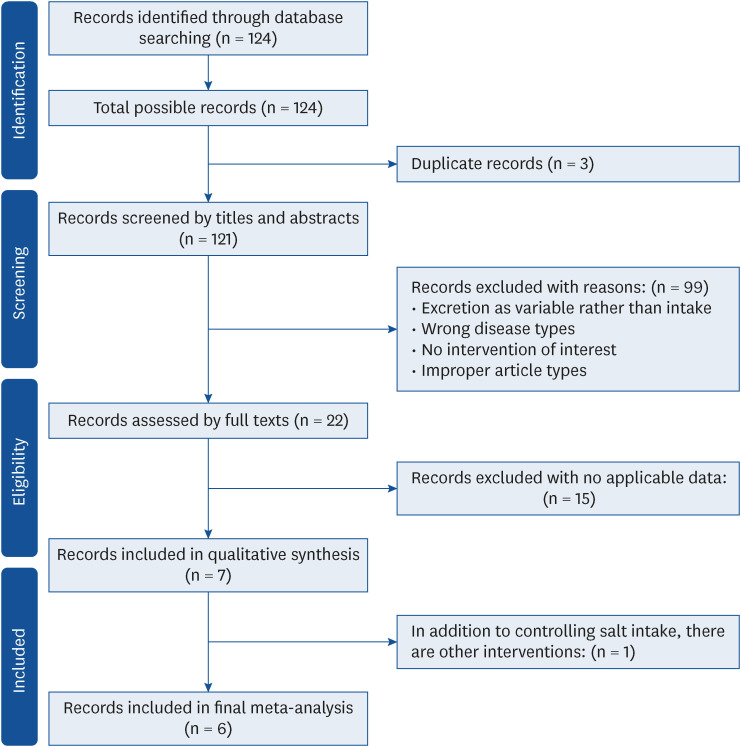
Table 1
Baseline characteristics of the included studies
| Author | Country | Number (male/female) | Age (yrs) | Treatment | Glucose | Study duration |
|---|---|---|---|---|---|---|
| Feldman et al. (1996) [12] | Canada | Normotensive group: 5 (5/0) | 27 ± 3 | HS: dietary 20 mmol/d sodium + 220 mmol/d NaCl (5,520 mg Na) | HS: 4.6 ± 0.3 | 2 wk |
| LS: 4.9 ± 0.2 | ||||||
| Hypertensive group: 8 (8/0) | 27 ± 2 | LS: dietary 20 mmol/d sodium + placebo (460 mg Na) | HS: 5.2 ± 0.2 | |||
| LS: 5.2 ± 0.3 | ||||||
| Feldman et al. (1999) [9] | USA | 8 (8/0) | 25–40 | HS: dietary 75 mmol/d NaCl + 160 mmol/d NaCl (5,405 mg Na) | HS: 4.8 ± 0.2 | 2 wk |
| LS: dietary 75 mmol/d NaCl + placebo (1,725 mg Na) | LS: 5.0 ± 0.3 | |||||
| Garg et al. (2014) [8] | USA | 389 (216/173) | 50.3 ± 7.5 | HS: 200 mmol/d NaCl (4,600 mg Na) | HS: 5.0 ± 0.6 | 2 wk |
| LS: 10 mmol/d NaCl (230 mg Na) | LS: 5.3 ± 1.1 | |||||
| Fliser et al. (1995) [13] | Germany | 3-day group: 7 (7/0) | 26 ± 3 | HS: 200 mmol/d NaCl (4,600 mg Na) | HS: 4.7 ± 0.2 | 3 × 2 day |
| LS: 4.4 ± 0.2 | ||||||
| 7-day group: 7 (7/0) | 25 ± 3 | LS: 20 mmol/d NaCl (460 mg Na) | HS: 4.6 ± 0.3 | 7 × 2 day | ||
| LS: 4.4 ± 0.2 | ||||||
| Iwaoka et al. (1988) [14] | Japan | 15 (9/6) | 52 ± 2 | HS: 342 mmol/d NaCl (7,866 mg Na) | HS: 5.1 ± 0.2 | 8 × 2 day |
| LS: 34 mmol/d NaCl (782 mg Na) | LS: 5.3 ± 0.2 | |||||
| Suckling et al. (2016) [15] | UK | 46 (24/22) | 58 ± 1 | HS: dietary 90 mmol/d NaCl + 90 mmol/d NaCl (4,140 mg Na) | HS: 6.8 ± 0.3 | 12 wk |
| LS: dietary 90 mmol/d NaCl + placebo (2,070 mg Na) | LS: 6.6 ± 0.3 | |||||
| Total | 485 |
Of the 6 studies, 2 contained 2 independent crossover data which met our inclusion criteria. Therefore, we treated the 2 independent crossover data as independent studies to be included in our meta-analysis, and thus had 8 sets of data to analyze (Feldman et al. [12]: one trial in the normotensive, the other in the hypertensive; Fliser et al. [13]: one trial with 3-day intervention duration; the other with 7-day).
The 6 studies enrolled a total number of 485 subjects, including 284 men (58.6%), 201 women (41.4%), 458 hypertensive patients (94.4%), and 46 diabetic patients (9.5%). The mean age was 37.9 ± 9.4 yrs, the mean blood glucose of the intervention group was 5.1 ± 0.9 mmol/L, and the mean blood glucose of the control group was 5.2 ± 1.3 mmol/L. Because the blood pressure was measured as either mean arterial pressure, or systolic and diastolic blood pressure in the 6 studies, the average levels could not be combined. Each study had a washout period, which averaged at 7.6 days with a standard deviation of 3.56.
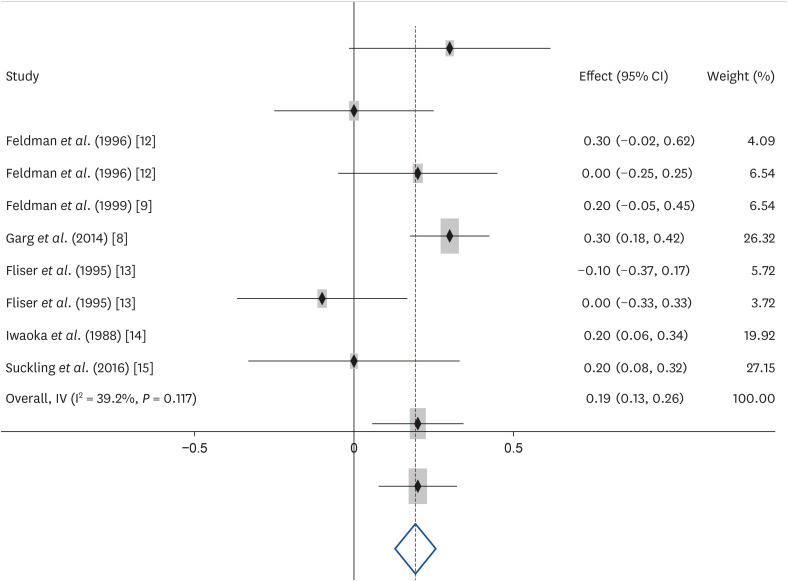
Pooling analysis
We prioritized a fixed-effects model to process the values of the blood glucose of the intervention group (low-salt) and the control group (normal or high-salt) collected from each study. The final pooled effect size was established. WMD and its 95% confidence interval (CI) was 0.193 (CI, 0.129–0.257), and the test of the overall effect had P < 0.001. The I2 statistic value was 39.2% (CI, 0.0–71.8%), less than 50%, which indicated insignificant heterogeneity among our data (Fig. 3). Considering the I2 measure was limited for detecting heterogeneity when there were few studies in a meta-analysis, we further compared the results from fixed-effects and random-effects models. Pooled by the random-effects model, the WMD was 0.171 (CI, 0.082–0.261) and the I2 statistic value was also less than 50% (I2 = 39.2% [CI, 0.0–74.1%]). Therefore, no significant difference existed between the above 2 models, and the results from the fixed-effects model obtained in our study were sufficiently robust. Hence, we were confident that the blood glucose levels after a period of a low-salt intake were significantly higher than those established after a period of a normal or high-salt intake.
Sensitivity analysis
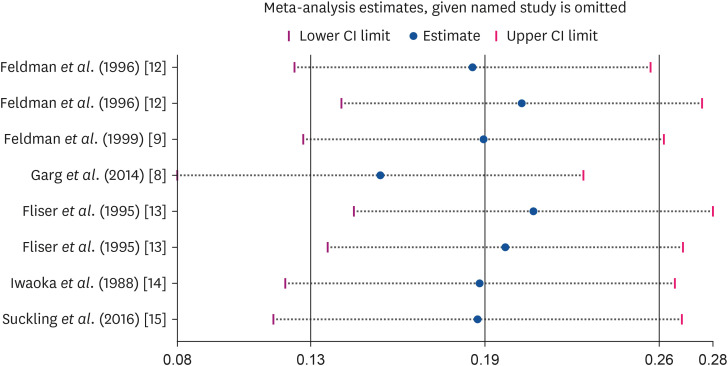
We further conducted sensitivity analysis to assess the performance of each study alone. As can be seen in Fig. 4, we removed one article, sequentially, and combined the remaining values in the same way, obtaining a series of corresponding WMDs and their 95% CIs. By contrast and comparison, we found that no significant change occurred regardless of whichever study was removed. Therefore, the data were homogeneous, and the outcomes we calculated by these methods were prudent and credible.
Publication bias analysis
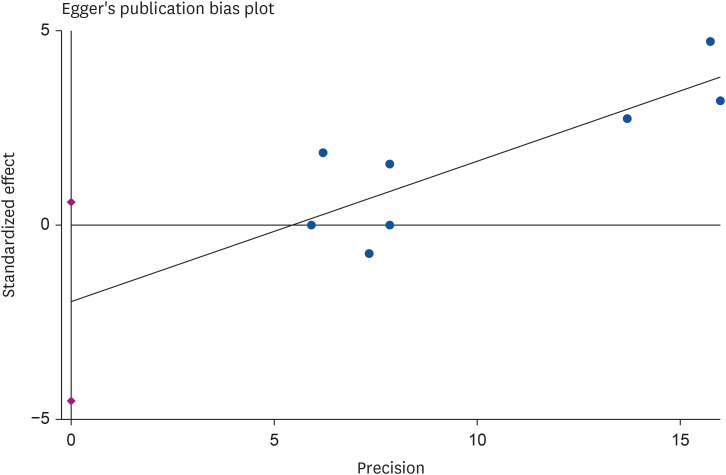
We used the Egger’s test to measure the probable publication bias. The 95% CI of the intercept of the Egger’s test regression line covered zero (Fig. 5). Meanwhile, quantitative Egger’s test (P = 0.109 > 0.05) (Fig. 5) indicated that an insignificant publication bias existed. There were only 6 studies; thus it was not necessary to perform the Begg’s test.
DISCUSSION
Previous research has suggested that salt intake is among the modifiable risk factors for type 2 diabetes [1]. However, the results of the influence of salt intake on the development and progression of the type 2 diabetes have remained inconsistent. Our major findings indicate that hypertensive or normal people who have low salt consumption for a certain period of time would have higher blood glucose levels than those who have normal or high salt consumption. There was a statistically significant difference in the glucose levels between the high-salt group and low-salt group. However, 0.193 mmol was not a clinically relevant difference in the blood glucose level. On the one hand, the minimal increase in glucose may represent an adaptive mechanism, because the duration of the trials was short, whereas salt consumptions exerts long-term effects on human health. On the other hand, the amount of sodium provided in both groups was far from the average populational consumption, which was possibly one of the reasons for the small difference. The overall quality of these trials was good based on the quality evaluation results. Moreover, most of them used randomization and double-blinding methods. In addition, no subjects dropped out during the trials. One advantage of these trials is that crossover design was adopted in all of them. The strength of this design is that it can reduce the effects of the selection and measurable biases on the results. Furthermore, the individual variation can also be eliminated by this design type, and the power can be increased even in studies with a smaller sample size.
Our findings are in accordance with the results obtained by other researchers [161718]. The median of the low-salt group in our studies was 27 mmol/d. Oh et al. [19], found that an extremely low-salt diet of 40 mmol/d and 2.34 g/d enhanced insulin resistance, which is in agreement with the findings of our study. It is important to explore the dose-response relationship between salt intake and blood glucose levels. However, due to data limitations, we were unable to classify the salt dose into mild, moderate, and high. There was still a statistically significant difference between normal or high-salt intake and low-salt intake in our study. These data can be combined with future data and analyzed together to explore the dose-response relationship between salt intake and blood glucose levels.
To alleviate the disease burden of hypertension and cardiovascular diseases, the World Health Organization recommends that salt intake should be less than 5 g per day, which is perceived as a cost-effective strategy [2021]. Based on the findings of our study, we suggest that the high salt consumption needs to be limited, but an excessive reduction in the salt intake would also bring damage.
In the present meta-analysis, the median of the intervention duration of salt intake was 1 wk. However, it is not clear whether a 1 wk intervention could produce maximum effects. Lima et al. [22] reported that the glucose levels and homeostasis model assessment results of elderly subjects who had a high-salt consumption for 13 wk were significantly higher than those of elderly subjects subjected to this high intake for only 1 wk. Therefore, it seems that the effects of a low-salt diet would have changed with prolongation of the intervention duration. In one of the studies included in our meta-analysis, the intervention duration was 6 wk and did not yield a significant difference in the glucose levels between the high-salt intake and low-salt intake groups [15].
In the 6 studies we included, the mean age of the subjects ranged from 25 to 58 yrs, which might have affected the results. However, the relationship between age and blood sugar needs to be further explored. Generally, glucose tolerance is known to decline with age, which can be explained by changes in other age-related variables, such as obesity, physical inactivity, taking medications, and chronic disease, although older adults can maintain insulin sensitivity by exercising [23]. There are also studies showing that middle-aged and older age groups have better blood sugar control than younger age groups, partly because older adults pay more attention to their intake of medications for blood sugar control [2425]. In other words, no simple conclusion can be made that older people have poorer control of their blood sugar levels.
Vasdev et al. [26] proposed that salt intake is involved in the alteration of the renin-aldosterone secretion and the angiotensin and NO levels in the sympathetic system, leading to increased oxidative stress and damage to the kidneys, and subsequent blood pressure elevation. In addition, insulin resistance might be a mechanism by which high salt levels increase blood pressure [26]. Previous evidence indicates that salt consumption restriction would result in increased insulin resistance, activation of the renin-angiotensin system, and increased sympathetic nerve activity [1227]. The decreased consumption of salt causes a reduction in the extracellular volume and physiological stimulation of the renin-angiotensin-aldosterone system and the sympathetic nervous system. Sudden and large decreases in salt consumption induce stronger compensatory responses, which are, however, much weaker or even minimal when a longer-term modest salt reduction has been applied [28]. Thus, it seems that the mechanisms by which low- and high-salt intakes induce insulin resistance are similar and are associated with increased blood pressure.
Several limitations of this study are to be acknowledged. First of all, only 6 studies and 8 sets of data were included in the present meta-analysis, and thus the data were limited. In addition, glucose levels were used as an outcome parameter in this investigation, which is a direct parameter but might not have fully reflected the effects of salt intake on diabetes mellitus. The main reason is that diabetes mellitus is a chronic disease which is affected by long-term diet patterns, and thus a 1-wk intervention and 1-wkwashout might not have produced significant effects. Furthermore, different populations and individuals have varied sensitivity to diverse salt intake levels, which might have been a confounding factor in this study.
 XML Download