

 PDF
PDF Citation
 Print
Print


INTRODUCTION
Osteoporosis is a disease involving weakened bones caused by loss of bone mineral density (BMD) that increases the risk of bone fracture and shortens height, resulting in decreased quality of life.1 Osteoporosis prevalence is increasing, with age reaching 19.6% and 4.4% in women and men aged over 50, according to the National Health and Nutrition Examination Survey 2017 to 2018 in the USA.2 The osteoporosis prevalence in Asia is similar to or higher than in the USA. Furthermore, it has increased from 2007–2008 to 2017–2018 only in women.34 In parallel with osteoporosis, fracture incidence has increased until 2013 and is 2.5% in Korea.4
BMD depends on bone formation and resorption balance and is modified by genetic and environmental factors that interact to modulate the prevalence of osteoporosis.1 Osteoporosis can be prevented by altering the modifiable risk factors, including dietary factors, lifestyles, disease status, and medication.56 Furthermore, unmodifiable osteoporosis risk factors, such as age, gender, body frame size, and genetic factor, interact with modifiable ones. They also need to be considered to explore preventable measures for osteoporosis.6 Osteoporosis is positively associated with age, women, low body weight, low physical activity, poor nutritional status, some medications, including cortisol, and endocrine-related diseases, including type 1 diabetes and menopause.7 Women are much more susceptible to osteoporosis than men due to lower peak bone mass in young adults, and BMD loss markedly increases due to estrogen deficiency in menopausal women.8 Moreover, hand grip strength is positively associated with BMD and inversely related to fracture in postmenopausal Korean women.9 The association between obesity and osteoporosis remains controversial.10 Although Asians have a lower calcium intake and lower body mass index (BMI), their fractures are not higher than Caucasians in men and women.11 Therefore, the prediction model for osteoporosis risk has practical significance for people who do not regularly measure BMD. The classification model of osteoporosis can be applied to the general population to predict the osteoporosis risk and to carry out early prevention according to the risk factors of the model.
Multi-omics analysis of diseases has become a recent research hotspot. In recent studies, osteoporosis is not only related to metabolomics but also to gut microbes and genes.12 Machine learning (ML) approaches can integrate different variables in the multi-omics analysis, perform accurate classification and regression, and evaluate the importance of variables as risk factors for the disease.13 ML has been used in multiple disease predictions, including health-related quality of life and chronic diseases, using various experimental types such as cross-sectional, case-control, and prospective cohorts.1415 The ML algorithm enables us to make data-driven predictions or decisions to predict the early detection of chronic diseases, including osteoporosis risk.1516 The biomarkers in the prediction model can be studied for preventing and therapeutic agents.
Previous studies have reported that osteoporosis is associated with genetics, which interacts with lifestyles to modulate its development and progression.1617 However, more studies are needed in different ethnicities since it has been studied primarily in European descent. Furthermore, a few studies have shown that the prediction model includes genetic factors such as polygenic risk scores (PRS).17 The genetic impact can be represented with PRS generated from the selected genetic variants for osteoporosis risk using genome-wide association study (GWAS) analysis. The present study aimed to generate the prediction model for osteoporosis risk using several machine-learning algorithms in an Ansan/Anseong cohort, of which the BMD was measured using quantitative ultrasound and densitometric peripheral bone densitometry. The generated prediction model was applied to predict the osteoporosis risk of the participants in the Health Examinees in multi-center hospitals (HEXA) cohort, which did not measure BMD. The association of the predicted osteoporosis risk with a fracture experience was determined in the HEXA.
METHODS
General characteristics of participants in the Ansan/Anseong cohort
Korean Genome and Epidemiology Study (KoGES) consisted of three cohorts in population-based studies, including Ansan/Anseong from 2001 to 2002 and HEXA, to study genetic and lifestyle factors in Korea.18 Ansan/Anseong cohort represented the residence area of the 8,842 participants in urban (Ansan) and rural (Anseong) areas. The participants were recruited from those who lived in the areas for at least 6 months before participating in the Ansan/Anseong cohort study. The participants volunteered for the HEXA cohort when visiting the assigned hospitals.
Most parameters were determined in both Ansan/Anseong and HEXA cohorts, but a few parameters, including BMD and fracture experience, were measured in one of them. BMD was measured at the lower limb (the tibia) and lower arm (the radius) by a PIXI (GE, Boston, MA, USA), a quantitative ultrasound, and densitometric peripheral bone densitometry. However, no fracture experience was reported in the participants of the Ansan/Anseong cohort (n = 8,842). However, BMD was not measured in the HEXA cohort, the large cohort (n = 58,701), where the answer of the osteoporosis diagnosed by a physician previously was included. However, the previous diagnosis of osteoporosis might not reflect BMD during the survey period; osteoporosis incidence was underestimated or overestimated since the persons did not measure BMD often as a regular checkup in Korea, and the BMD diagnosis was dependent on the person's memory. Therefore, the model for osteoporosis risk determined with BMD was generated with a ML approach from Ansan/Anseong cohorts. The osteoporosis risk of the participants in the HEXA cohort was predicted using the predicting model generated from Ansan/Anseong cohort.
The participants in this cohort resided in Ansan, a city area (n = 4,205), or Anseong, a rural area (n = 4,637) from 2001 to 2002, for a least six months before voluntarily participating in the study. The demographic and dietary information was provided by a health interview and had anthropometric and biochemical measurements. The anthropometric measurements, including height, weight, waist, and hip circumference, were conducted by a skilled technician, with the participants wearing a light gown as described previously. The lean body mass and fat mass were assessed by bioelectrical impedance analysis (Inbody 3.0, Biospace, Seoul, Korea). The pulse was counted for 1 min, and the blood pressure was then calculated with an average of three measurements conducted on the right arm at the same height as the heart in the sitting positions.
The participants also answered a question about taking medication for various diseases as none, past and current medication, including hormone replacement therapy. The smoking status was defined as follows: smoking more than 100 cigarettes throughout their lifetime was considered a current smoker, and smokers who had not been smoking for the last six months were considered former smokers.19 The daily alcohol intake was calculated with the alcohol amount in each drinking event and the drinking frequencies during the last six months before the interview. Regular exercise was defined as moderate exercise (brisk walking, mowing, badminton, swimming, tennis, and others) for > 30 minutes or vigorous exercise (climbing, running, football, basketball, volleyball, and others) for > 20 minutes at least five times per week.
Overnight fasting blood samples were collected from each participant, and the serum and plasma were separated. The biochemical variables were measured. Glucose, total cholesterol, high-density lipoprotein (HDL)-cholesterol, triglycerides, platelet, alanine aminotransferase (ALT), aspartate aminotransferase (AST), γ-glutamyl transpeptidase, creatinine, and total bilirubin in serum were assessed using an automatic analyzer (ZEUS 9.9; Takeda, Tokyo, Japan). The fasting serum insulin and high-sensitive C-reactive protein (CRP) concentrations were analyzed using ELISA kits (DiaSorin, Stillwater, MN, USA). The HOMA-IR was calculated using the equation of the serum glucose concentration (mM) × serum insulin concentration (µU/mL)/22.5.
Osteoporosis definition
BMD was measured 1) at the middle of the wrist and the elbow in the lower arm (the distal radius) and 2) at the middle of the knee and the astragalus in the leg (midshaft tibia) by the PIXI (GE, USA), quantitative ultrasound and densitometric peripheral bone densitometry in the Asan/Anseong cohort. Although dual-energy X-ray absorptiometry (DEXA) is a primary tool for estimating BMD, it cannot be applied in a clinical setting. Multisite BMD by quantitative ultrasound densitometry exhibits a positive correlation with that by DEXA in the Canadian Multicentre Osteoporosis Study.20 BMD measurement by ultrasound densitometry is a valuable tool for assessing osteoporosis risk in a clinical setting. In Koreans, quantitative ultrasonographic measurements are used for defining osteoporosis risk.21 Therefore, osteoporosis was defined as a radius or tibia BMD T score of -2.5 standard deviations below that of a healthy 20–39-year-old adult of the same gender as the subject. The participants with and without osteoporosis were called the osteoporosis and control groups, respectively. Four hundred and twelve people (4.66%) had missing values for the BMD, and they were excluded from the prediction of osteoporosis.
In a HEXA cohort, the BMD was not measured, but the osteoporosis diagnosis by a physician was questioned. A diagnosis of osteoporosis was used for further analysis. Unlike the Ansan/Anseong cohort, fracture experience was reported in the HEXA cohort.
Genetic variants for osteoporosis risk
The genomic DNA was extracted from the blood, and its genotypes were determined using an Affymetrix Genome-Wide Human SNP Array 5.0 (Affymetrix, Santa Clara, CA, USA). The genotype accuracy and quality were controlled with Bayesian Robust Linear Modeling using the Mahalanobis Distance Genotyping Algorithm.16 In a previous study,1 the genetic variants to interact with each other were selected to assess the osteoporosis risk in the Ansan/Anseong cohort using a GWAS and generalized multifactor dimensionality reduction procedures. The genetic model with selected genetic variants included AKAP11_rs238340, KCNMA1_rs628948, PUM1_rs7529390, SPTBN1_rs6752877, and EPDR1_rs2722298. The PRS of the 5 SNPs was calculated by summing the number of the given allele from each SNP selected in the five SNPs of the genetic model. The PRS was used as the genetic factor.
Assessment of the food and nutrient intake using semi-quantitative food frequency questionnaires (SQFFQ)
During the last six months, the usual food intake was assessed with the eating frequencies and portion size using SQFFQ for Korean diets.22 The SQFFQ included 103 common Korean foods, and their eating frequencies were divided into the following: never or seldom, once a month, two to three times a month, one to two times a week, three to four times a week, five to six times a week, once a day, twice a day, and three times or more per day. The amount of food at each eating event was answered as more, equal, or less based on the portion size shown by the food photographs in each food. Each participant's food intake was determined by multiplying the midpoint of the frequencies by the portion size of each food. The intake of energy and nutrients was calculated from the food intake assessed by the SQFFQ, using the Can-Pro 2.0 nutrient assessment software designed by the Korean Nutrition Society.23
Experimental design for ML for predicting osteoporosis
One hundred and nine variables potentially related to osteoporosis risk were selected from 1,411 variables in the Ansan/Anseong. Among 119 variables, the correlated variables were excluded (Fig. 1). However, body weight, waist and hip circumferences, body fat, and lean body mass were included to find a better predictor for the osteoporosis risk. BMI was omitted since body weight and height were included.
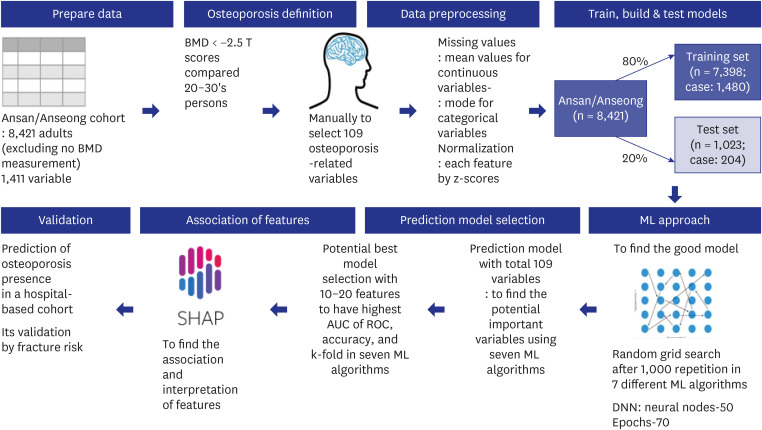
Fig. 1
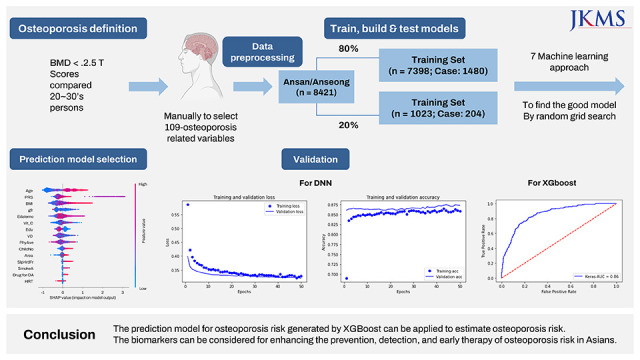
Processing scheme for generating a prediction model of osteoporosis risk in the Ansan/Anseong cohort. The 8,421 adults measured with bone mineral density participated, and 109 variables were selected manually from 1,411 in the Ansan/Anseong cohort to predict the osteoporosis risk using the seven ML approach. Osteoporosis was defined as < −2.5 T scores of BMD in the tibia and wrist compared to the '20s–'30s. Missing data were filled with the mean and mode values for continuous and categorical variables, respectively. Data were normalized using the z-score. The prediction models for osteoporosis risk were generated using seven ML algorithms. The Ansan/Anseong cohort participants were divided randomly into a training set of 80% and a test set of 20% participants. The optimal model was selected with a random grid search after 1,000 repetitions in seven different ML algorithms, such as linear regression, support vector machines, XGBoost, decision tree, random forest, K-nearest neighbor, and DNN. The optimal prediction model was selected using the AUC of the ROC. The accuracy and k-fold cross-validation of the predicted models were assessed in the test set.
BMD = bone mineral density, AUC = area under the curve, ROC = receiver operating characteristic, ML = machine learning, DNN = deep neural network.
![]()
The missing values (4.66%) are not allowed in the ML algorithms, and they were filled with the mode for the categorical variables and the mean for continuous variables. Each continuous variable was normalized to the z-score (Fig. 1). The data were divided randomly into 80% (n = 7,074) for the training set and 20% (n = 1,768) for the testing set. Standardized 109 variables were used to generate training and test sets using the randomized grid search method (Fig. 1). Appropriate models were selected to improve the area of receiver operating characteristic (ROC) curve, accuracy, and K-fold in the test data set. The algorithm models fitted for predicting the metabolic status were as follows: logistic regression, support vector machines (SMV), extreme gradient boosting (XGBoost), decision tree, random forest, K-nearest neighbor (KNN), and deep neural network (DNN).24 DNN was analyzed with 70 epochs, 0.2 validation split, and 100 layers.
Training for the variables for generating osteoporosis risk prediction model and testing the models for verifying the prediction model
After running the 109 variables, the relative importance of the random forest and XGBoost algorithm models was used to identify the genetic model in the training set. The best model with the highest area under the curve (AUC) of ROC, accuracy, and K-fold in the test data set was selected from the random forest and XGBoost algorithm models. However, the algorithm models did not indicate a positive or negative relationship. The SHapley Additive exPlanation (SHAP; https://shap.readthedocs.io/en/latest/index.html) was used to explain the models selected from the random forest and XGBoost.25
Predictions of the osteoporosis risk in the urban hospital-based cohort using the predictive algorithm models
Three prediction models generated by XGBoost, DNN, and random forest algorithms were selected to predict osteoporosis risk in the urban hospital-based cohort. Pearson’s correlation coefficients between osteoporosis and fracture experience were investigated.
Statistical analysis
Statistical analysis was conducted using SAS (Cary, NC, USA), Scikit-learn in Python 3.8.5 (https://www.python.org/downloads/windows/), and the TensorFlow platform. Six prediction models for osteoporosis risk were generated by logistic regression, XGBoost, random forest, KNN, SMV, and decision tree algorithms using Scikit-learn in Python 3.8.5. The DNN prediction model was made with the Tensor Flow platform.
The results are presented as the means ± standard deviations or number and percentage in the general characteristics of the variables. The significance of the differences between the variables was determined according to gender and the osteoporosis risk using the two-way ANOVA in the Ansan/Anseong cohort. P < 0.05 were considered significant.
RESULTS
General characteristics and nutrient intake of the participants according to gender and BMD status
The participants in the osteoporosis group were older, less educated, and with lower income than those in the control group, and women had a much higher prevalence of low BMD than men (Table 1). The participants in the city area had lower BMD than those in rural areas. The participants with a high number of children and breastfed children were higher in osteoporosis than those with a low number (Table 1). A higher frequency of insomnia and sleep disorders elevated the osteoporosis incidence only in women. Menstrual and menopause age was not significantly different between the osteoporosis and control groups in women (Table 1).
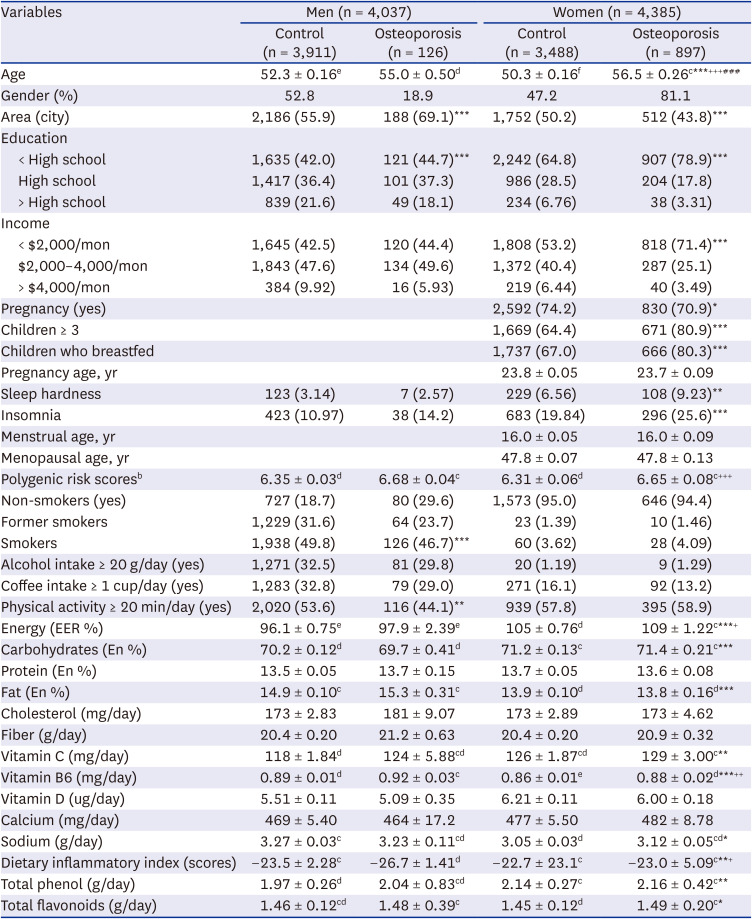
Table 1
General characteristics and nutrient intake of the participants according to genders and osteoporosisa
Values are presented as number (%) or mean standard ± deviation.
aOsteoporosis was defined as either a BMD T score in the tibia or a radius < −2.5; bThe sum of the number of risk alleles in the 5-SNP good model for osteoporosis, including AKAP11_rs238340, KCNMA1_rs628948, PUM1_rs7529390, SPTBN1_rs6752877, and EPDR1_rs2722298.
*Significant difference in gender in two-ANOVA at P < 0.05, **P < 0.01, and ***P < 0.001.
+Significant difference in osteoporosis in two-ANOVA at P < 0.05, ++P < 0.01, and +++P < 0.001.
#interaction between gender and osteoporosis at P < 0.05, ##P < 0.01, and ###P < 0.001.
c,d,e,fValues on the same row with different superscript letters were significantly different among groups by Tukey test at P < 0.05.
![]()
Smokers had lower levels of osteoporosis than non-smokers and former smokers, only in men. Alcohol and coffee intake did not influence the incidence of osteoporosis (Table 1). The participants with regular exercise had a lower incidence of osteoporosis in men, but there was no significant difference in the osteoporosis incidence with physical activity in women. Daily energy intake based on the dietary reference intake was higher in the osteoporosis group than in the control group in both men and women (Table 1). The osteoporosis and control groups had similar carbohydrate, protein, and fat intake, including saturated, monounsaturated, and polyunsaturated fatty acids. Meanwhile, carbohydrate and fat intake showed gender differences, but the cholesterol, fiber, and calcium intakes were similar regardless of gender and BMI (Table 1). The vitamin C and sodium intake were higher in women than in men, but there was no significant difference in BMI. The vitamin B6 intake was higher in men than women and higher in those with the osteoporosis group than the control (Table 1). The dietary inflammatory index was lower in men than women and lowered in the osteoporosis group than in the control group (Table 1).
Metabolic parameters of the participants according to gender and osteoporosis
Height was lower in the osteoporosis group and women than in the control group and men (Table 2). On the other hand, the BMI, waist circumferences, hip circumferences, and body fat were higher in the osteoporosis group than in the control group in both genders. However, the muscle mass was similar in the osteoporosis and control groups. Surprisingly, the serum glucose and HbA1c concentrations were similar in the osteoporosis and control groups (Table 2). The HOMA-IR indicated the insulin resistance index, which was similar in the two groups. On the other hand, dyslipidemia was related to osteoporosis (Table 2). The serum HDL cholesterol concentrations were lower and the serum triglyceride concentrations were higher in the osteoporosis group than in the control group (Table 2). The systolic and diastolic blood pressure, estimated glomerular filtration rate (GFR) from serum creatinine levels, and serum ALT and AST concentrations were similar in the osteoporosis and control. The serum CRP concentrations were similar in the two groups, but the white blood cell (WBC) in circulation was lower in the osteoporosis group than in the control group (Table 2). The serum albumin concentrations were lower in the osteoporosis group than in the control group. The hematocrit and blood hemoglobin concentrations were higher in the osteoporosis group than in the control group (Table 2). The serum renin concentration was lower in the osteoporosis than in the control.
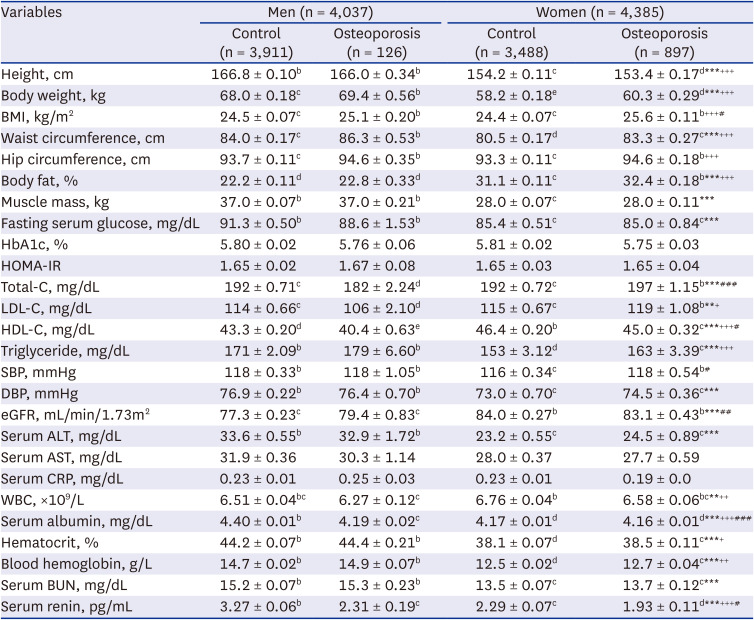
Table 2
Metabolic parameters of the participants according to genders and osteoporosisa
BMI = body mass index, HOMA-IR = Homeostatic model assessment for insulin resistance, Total-C = total cholesterol, HDL = high-density lipoprotein, LDL = low-density lipoprotein, SBP = systolic blood pressure, DBP = diastolic blood pressure, eGFR = glomerular filtration rate, ALT = alanine aminotransferase, AST = aspartate aminotransferase, CRP = high-sensitive C-reactive protein, WBC = white blood cells, BUN = blood urinary nitrogen.
aOsteoporosis was defined as either BMD in the tibia or wrist < −2.5.
*Significant difference in gender in two-ANOVA at P < 0.05, **P < 0.01, and ***P < 0.001.
+Significant difference in osteoporosis in two-ANOVA at P < 0.05, ++P < 0.01, and +++P < 0.001.
#Interaction between gender and osteoporosis at P < 0.05, ##P < 0.01, and ###P < 0.001.
b,c,d,eValues on the same row with different superscript letters were significantly different among groups by Tukey test at P < 0.05.
![]()
The model for osteoporosis risk using the ML approach
In order to explore the prediction model for osteoporosis risk, 109 osteoporosis-related features were chosen manually and applied to train the seven ML algorithms in Ansan/Anseong cohort (Table 3). The prediction model for osteoporosis is defined by < −2.5 T scores of tibia or radius based on people aged in their 20s–30s. After the participants in Ansan/Anseong cohort were categorized into training (n = 7,398) and test (n = 1,023) sets, the best prediction model for the osteoporosis risk was generated by including 10, 15, and 20 features (Table 3). The AUC of the ROC curves was 0.601–0.890 in different ML algorithms, and the prediction model with 15 features showed the highest AUC. Among the seven algorithms, XGBoost, random forest, and DNN showed a high AUC of the ROC (> 0.85) in the prediction models with 10, 15, and 20 features (Table 3).
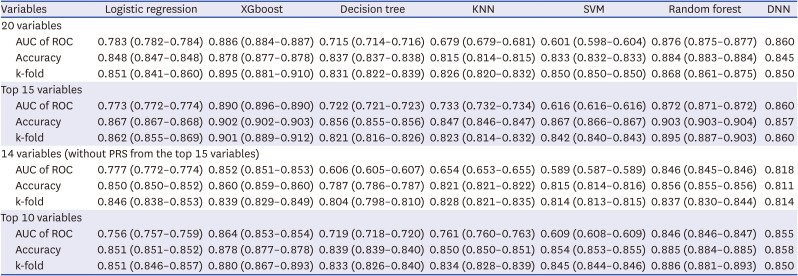
Table 3
The AUC of the ROC curve, accuracy, and k-fold of prediction models for bone mineral density using machine learning algorithms in the Ansan/Anseong cohort
Prediction models were generated from the training set with 80% of the Ansan/Anseong cohort, and 20% was used as a test set.
The prediction model with the top ten variables generated from XGBoost included genders, genetic risk scores for osteoporosis, number of children, number of breastfed children, age, seasons to measure, residence area, education, height, and estrogen therapy. The prediction model with 15 variables contained those with the top 10 variables plus smoking status, serum albumin, hip circumferences, vitamin B6, and weight. The prediction models containing the top 20 variables included 15 variables plus energy intake, waist circumferences, hematocrit, vitamin D, and total flavonoid intake.
AUC = area under the curve, ROC = receiver operating characteristic, XGBoost = extreme gradient boosting, KNN = k-nearest neighbors algorithm, SVM = support vector machines, DNN = deep neural network.
![]()
The AUC of the ROC with the 15 top variables was the highest in XGBoost (0.890), random forest (0.872), and DNN (0.860) (Table 3). Furthermore, the AUC of the ROC with XGBoost, random forest, and DNN decreased to 0.864, 0.846, and 0.855 when the most important variables were reduced to ten variables (Table 3). The accuracy and k-fold of all the models with 10, 15, and 20 variables were higher than 0.815 (Table 3). The top 15 variables were selected to predict osteoporosis from each model because the AUC of the ROC was highest than in the other models. The accuracy and k-fold were approximately 0.90 in the XGBoost model with 15 features (Table 3).
The relative importance of the parameters in the random forest and XGBoost prediction models in total participants
Relatively essential features of the predicted models from the XGBoost and random forest algorithms were obtained. The prediction models by XGBoost, random forest algorithms, and DNN selected 20 features, including genders, genetic risk scores for osteoporosis, number of children, number of breastfed children, age, seasons to measure, residence area, education, height, hip, serum albumin, smoking status, vitamin B6, weight, energy intake, waist circumferences, estrogen replacement, hematocrit, vitamin D, and total flavonoids intake (Table 3). Both algorithms showed the same parameters, but the relative importance of each was different in XGBoost, random forest, and DNN model (Table 3). The importance scores showed a significant difference among the features included in the XGBoost algorithm, random forest, and DNN algorithm (Fig. 2A and B). However, the AUC of ROC, accuracy, and k-fold were higher in the XGBoost algorithm than in other models. Therefore, the XGBoost model gave a better prediction of the osteoporosis risk. SHAP analysis for the 20-variable model revealed the features positively or negatively related to the osteoporosis risk (Fig. 2C). The red part indicated a positive association with the SHAP value for osteoporosis incidence. For example, age was red in the positive SHAP values, indicating that age was positively associated with osteoporosis, while height was blue in the positive SHAP, indicating that height was negatively related to osteoporosis.
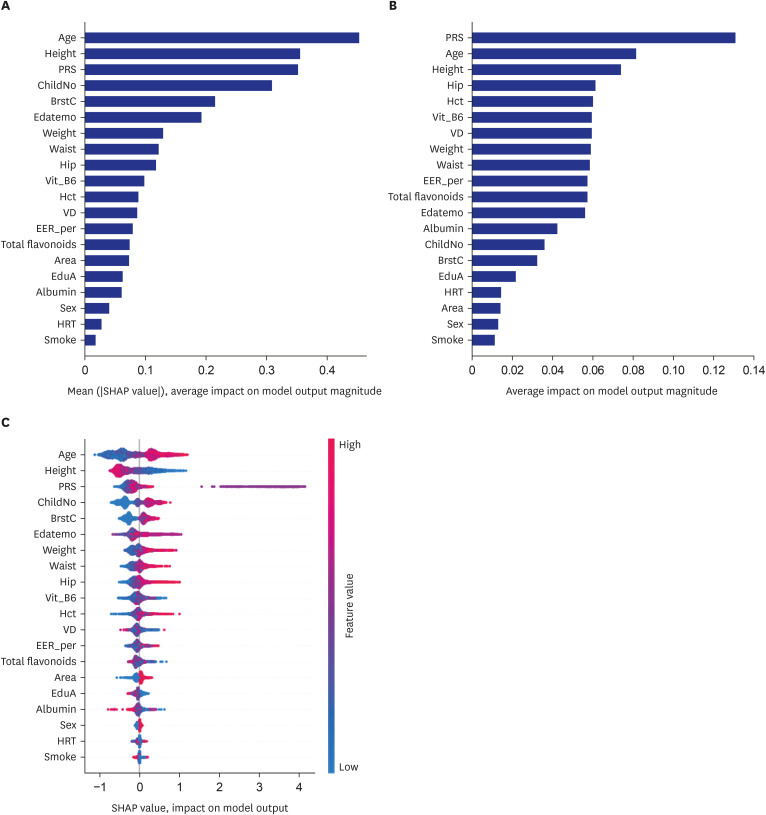
Fig. 2
The relative importance of the top 20 variables for predicting the osteoporosis risk, as determined by the XGBoost and random forest algorithms. (A) Osteoporosis prediction model by the XGBoost algorithm. (B) Osteoporosis prediction model by the random forest algorithm. (C) Explanation of the variables in the osteoporosis prediction model by the XGBoost algorithm.
PRS = a polygenic risk score of 5 genetic variants explored for osteoporosis risk, ChildNo = the number of children, BrstC = the number of children who breastfed, Edatemo = the month of participating in the study, Waist = waist circumferences, Hip = hip circumferences, Vit_B6 = vitamin B6 intake, hematocrit, VD = vitamin D intake, EER_Per = the percentage of energy intake by estimated energy requirement, EduA = education level, HRT = the experience of hormone-replacement therapy.
![]()
The prediction models by XGBoost, random forest, and DNN algorithms selected 15 features, including genders, genetic risk scores for osteoporosis, gender, number of children, age, the number of breastfed children, residence area, education, seasons to measure, height, estrogen replacement, smoking status, serum albumin, hip circumferences, Vit B6, and weight (Table 3). The prediction model with 15 variables also showed a similar result in the XGBoost, random forest, and DNN algorithms (Fig. 3A and B). The 15-feature model showed the highest AUC of the ROC, accuracy, and k-fold scores, and the XGBoost model was the optimum for predicting the osteoporosis incidence of a HEXA cohort (Table 3). In the DNN algorithm with epochs 30–40, the training loss was equalized with validation loss, training accuracy was improved from 30 epochs, and Keras AUC was 0.86 (Supplementary Fig. 1). The DNN model with 15 variables was sufficient to predict osteoporosis risk. SHAP analysis for the 15-variable model revealed the features positively or negatively related to osteoporosis risk in XGBoost and DNNs (Fig. 3C and D).
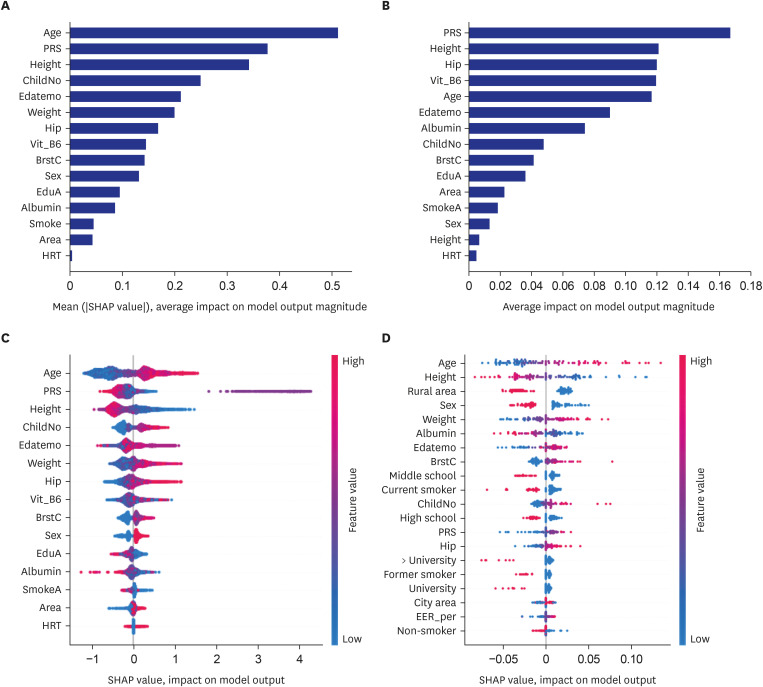
Fig. 3
The relative importance of the top 15 variables for predicting osteoporosis risk as determined by the XGBoost and random forest algorithms. (A) Osteoporosis prediction model using the XGBoost algorithm. (B) Osteoporosis prediction model using the random forest algorithm. (C) Explanation of the variables in the osteoporosis prediction model using the XGBoost algorithm. (D) Explanation of the variables in the osteoporosis prediction model using the deep neural network algorithm.
PRS = a polygenic risk score of 5 genetic variants explored for osteoporosis risk, ChildNo = the number of children, BrstC = the number of children who breastfed, Edatemo = the month of participating in the study, Waist = waist circumferences, Hip = hip circumferences, Vit_B6 = vitamin B6 intake, hematocrit, VD = vitamin D intake, EER_Per = the percentage of energy intake by estimated energy requirement, EduA = education level, HRT = the experience of hormone-replacement therapy.
![]()
Since PRS is challenging to apply to the people visiting a clinic, PRS was eliminated to predict the model, and 14 variables were used to generate the prediction model. The prediction model with 14 variables showed 0.7-0.85 AUC of ROC, accuracy, and k-fold (Table 3). Although the validation values in the 14-variable prediction model were lower than those with the 15 variables, including PRS, it was sufficient for predicting osteoporosis risk (Supplementary Fig. 2).
The ten-feature prediction model generated by the XGBoost algorithm included genders, PRS for osteoporosis, number of children and breastfed children, age, seasons to measure, residence area, education, height, and hormone replacement therapy (Fig. 4A). The variables were well separated to show the positive or negative association with osteoporosis risk in the SHAP values (Fig. 4B).
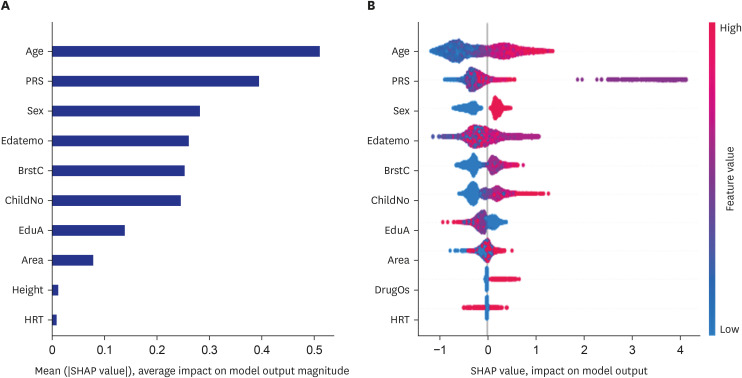
Fig. 4
The relative importance of the top 10 variables for predicting osteoporosis risk as determined by the XGBoost and random forest algorithms. (A) Osteoporosis prediction model using the XGBoost algorithm. (B) Explanation of the variables in the osteoporosis prediction model using the XGBoost algorithm.
PRS = a polygenic risk score of 5 genetic variants explored for osteoporosis risk, ChildNo = the number of children, BrstC = the number of children who breastfed, Edatemo = the month of participating in the study, EduA = education level, DrugOS = Medication for osteoporosis, HRT = the experience of hormone-replacement therapy.
![]()
The relative importance of the parameters in the random forest and XGBoost prediction models in women alone
Since women are known to be susceptible to osteoporosis risk and some parameters are related to females, the prediction model for women was generated. The results for females were similar to all participants. However, the accuracy (0.835–0.84) was lower, and the separation of some variables was not clear between the osteoporosis and control groups since the number of samples was reduced. Therefore, the model generated from both genders was better to be applied to people in a clinical setting. The models from women participants were shown in Supplementary Figs. 3, 4, and 5. The prediction models with 20, 15, and 10 variables were similar between total and female participants. However, the female prediction model included variables such as GFR, frequencies of difficulty sleeping at night, and urinary pH. These results indicated that managing menopausal symptoms might be critical for osteoporosis risk.
Association of osteoporosis predicted by the optimal model with a fracture in a HEXA cohort
Osteoporosis incidence detected by the question about the osteoporosis diagnosis history from a physician was weakly correlated with the fracture experience in the HEXA cohort (r2 = 0.071, P < 0.001; Table 4). Additionally, osteoporosis risk predicted by the BMD using XGBoost, random forest, and DNN algorithms with 15 variables was weakly correlated with osteoporosis incidence. Osteoporosis predicted by XGBoost was correlated with fracture incidence and osteoporosis diagnosis (r2 = 0.035 and r2s = 0.176, respectively; P < 0.001; Table 4). On the other hand, osteoporosis predicted by DNN and the random forest showed a lower correlation with the presence of osteoporosis and fracture experience in the HEXA cohort.
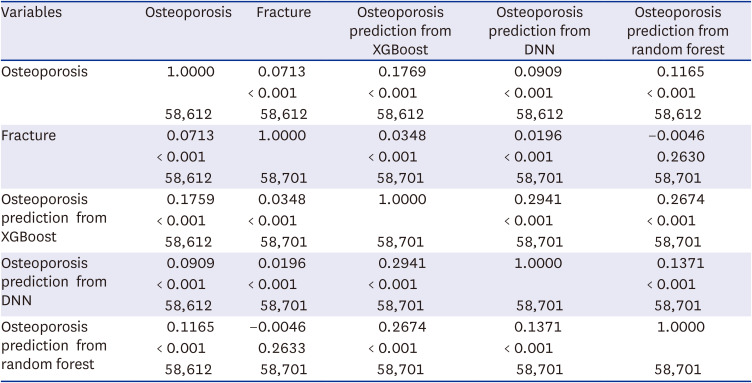
Table 4
Correlation between osteoporosis predicted by several XGBoost, random forest, and DNN
![]()
DISCUSSION
Osteoporosis is a disease in the elderly that increases fracture risk, decreases the quality of life, and increases mortality. On the other hand, fractures and osteoporosis are weakly correlated because fractures are associated with various risk factors. Osteoporosis leads to reduce bond strength, which is one of the primary factors in increased fracture risk.26 Osteoporosis is not checked routinely, and it is difficult to notice its risk. Therefore, it is better to generate a good prediction model for osteoporosis. The present study explored the prediction model for osteoporosis using critical features. It was validated with an osteoporosis diagnosis by a physician and fracture experience in a HEXA cohort. The present study showed that the prediction model for osteoporosis risk included gender, polygenetic variants, number of children and breastfed children, age, season to measure the BMD, residence area, serum albumin concentrations, height, body weight, hormone replacement therapy, vitamin B6 intake, and hip circumferences. The prediction model generated by XGBoost showed the highest AUC of the ROC (0.890), accuracy (0.902), and k-fold (0.901). When the prediction model was applied to the HEXA cohort, the predicted osteoporosis risk was weakly correlated with the osteoporosis diagnosis by a doctor (r2 = 0.176, P < 0.001). The incidence of osteoporosis diagnosed by a physician and predicted by the XGBoost algorithm was similarly but weakly correlated with fractures. Therefore, the prediction model by XGBoost may predict osteoporosis status correctly.
Osteoporosis risk is associated with gender and is probably related to the higher peak bone mass in men during their 20s –30s than in women. Before menopause, estrogen protects against the BMD decrement to prevent the development of osteoporosis in women. However, an estrogen deficiency accelerates bone loss, increasing osteoporosis risk in menopausal women. According to a meta-analysis, hormone replacement therapy prevents or treats osteoporosis in menopausal women, and estrogen-progestin therapy has a better impact on increasing BMD than estrogen therapy.27 In the present study, hormonal replacement therapy did not differ between osteoporosis and control groups. This result might be due to a small sample size. However, it was positively associated with some participants with osteoporosis and negatively associated with others with osteoporosis in SHAP analysis. Therefore, hormonal replacement therapy may prevent BMD loss after menopause.
The association between body weight and osteoporosis risk remains controversial,2829 but body fat content is negatively associated with osteoporosis risk in middle-aged adults in previous studies.3031 In the present study, the body weight, BMI, and waist and hip circumferences were higher in the osteoporosis group than in the control group in both genders. On the other hand, the body fat contents showed the same trend as the body weight only in women but not men, and the muscle mass was similar in the osteoporosis and control groups. Furthermore, the osteoporosis group had higher energy intake than the control group women. In the prediction model, body weight and hip circumferences were positively associated with the risk of osteoporosis. Therefore, obesity adversely affects women aged over 40 years of age. In addition to obesity, height was smaller in the osteoporosis group than in the control group of women over 40 years in the present study. It suggests that height was reduced due to low BMD. A decreased stature is a known osteoporosis phenotype in the elderly.32 Therefore, a decreased height in women was reflected in BMD loss in the prediction model.
Women are more susceptible to osteoporosis, which may be associated with pregnancy and breastfeeding. Although increased calcium absorption and more estrogen secretion protected against bone loss during pregnancy and lactation, prolonged breastfeeding was positively associated with osteoporosis risk in postmenopausal women (n = 1,222), according to the KNHANES 2010–2011.33 On the other hand, childbirth age and the number of deliveries do not affect BMD in postmenopausal women. In the present study, the number of bearing and breastfed children was higher in the osteoporosis group than in the control group. On the other hand, the pregnancy experience was rather higher in the control group, and the pregnancy age was similar in the osteoporosis and control groups. Menstrual and menopausal ages did not differ between the two groups.
The genetic risk scores for osteoporosis were strongly associated with predicting osteoporosis, and they were involved in the balance of osteogenesis and osteoclastogenesis in the present study. Osteogenesis is associated with TGF-β and Wnt signaling through COL1A1, COL1A2, LRP5, PLS3, and WNT1.
343536 Furthermore, rs6086746 in the PLCB4 promoter alters the binding affinity to RUNX2 to influence the osteoporosis risk.37 Osteoclastogenesis is involved in RANKL-induced bone resorption with runt domain transcription factor 2 (RUNX2), osteoprotegerin (OPG), and NF-κB activation.38 In a previous study, the polygenetic-risk scores of AKAP11_rs238340, KCNMA1_rs628948, PUM1_rs7529390, SPTBN1_rs6752877, and EPDR1_rs2722298 were positively associated with the susceptibility to osteoporosis by 1.7-fold.1 The scores interacted with coffee and caffeine intake to influence the osteoporosis risk. Participants with low intake had an approximately 2.3-fold higher osteoporosis risk than those with a high intake. Thus, genetic impacts should be studied with lifestyle interaction for osteoporosis risk. The present study used the PRS as the genetic factor to predict osteoporosis risk and was ranked as a high-importance factor.
Nutrient intake, including calcium, vitamin D, flavonoids, sodium, physical exercise, smoking status, and alcohol, was related to the osteoporosis risk. The participants consumed low calcium (average of approximately 450 mg/day), and the calcium and vitamin D intake were similar in the osteoporosis and Control groups. Vitamin B6 intake was higher in the Control group than in the osteoporosis group. Interestingly, the intakes of other nutrients except for vitamin B6 were similar in the osteoporosis and Control groups. Although vitamin B6 acts as a coenzyme in amino acid metabolism, neurotransmitter production, and the nervous and immune system, it has not been highlighted, like vitamin D and calcium for BMD. Osteoporosis risk is 61% higher in the low level of serum vitamin B6 than in the high level. However, there was no association with vitamin D in Chinese postmenopausal women.39 Serum vitamin B6 concentrations are negatively correlated to bone turnover markers. The other study has also demonstrated that they are positively associated with a fractured ankle.40 Therefore, vitamin B6 intake is potentially related to bone health, and adults need to consume foods rich in vitamin B6. Vitamin B6-rich foods are beef liver, tuna, salmon, chicken breast, chickpeas, bananas, cottage cheese, nuts, and onion. The recommended intake is 1.3 mg/day for adults (19-50 years) and 1.7 and 1.5 mg/day for men and women > 50 years, respectively. The dietary inflammatory index was significantly lower in the osteoporosis group than in the Control group. However, these results did not show consistent nutrient intakes on the osteoporosis risk because the study was cross-sectional, and the results were not related to a cause-and-effect. Therefore, it needed to be validated using large randomized clinical trials or prospective cohort studies.
Although nutrient intake and lifestyles were not related to the osteoporosis risk, HDL, triglyceride, WBC, albumin, renin, and hemoglobin concentrations in the blood circulation were significantly different in the osteoporosis and control groups. In Japan, low serum albumin concentrations are associated with osteoporosis risk in postmenopausal women,41 even though serum albumin concentration was lower in the osteoporosis group than in the control group only in men in the present study. In Chinese menopausal women, the red blood cells, platelet, and hemoglobin levels of postmenopausal women in the osteoporosis group were higher than those in the non-osteoporosis group,42 which is consistent with the present study. On the other hand, the association between WBC concentration and osteoporosis risk remains controversial.43
Although fracture risk is weakly associated with BMD, the fracture risk assessment tool (FRAT) includes BMD and BMD-related parameters. It suggests that fracture risk is partly related to osteoporosis risk. In the present study, BMD prediction included age, gender, body weight, height, and smoking status, which are included in FRAT. In the present study, taking glucocorticoids, rheumatic arthritis incidence, and alcohol intake in the FRAT were used to predict BMD. However, they were not included in the prediction model for osteoarthritis risk. Since Ansan/Anseong cohort did not measure fracture-related parameters and secondary osteoporosis, the parameters were not considered as the prediction model for osteoporosis risk. The results suggested that similar anthropometry and demographic parameters were involved, but some lifestyle-related parameters were differently related to the prediction models for osteoporosis and fracture risk.
The factors included in the prediction model for osteoporosis risk were fitness in Koreans aged > 40. The prediction model with 15 features expected osteoporosis very well (AUC of ROC in test set = 0.890, accuracy = 0.902, k-fold = 0.901) in the Korean cohort, and the prediction model was used to categorize the participants in the HEXA cohort according to osteoporosis risk. The predicted incidence of osteoporosis was weakly and positively correlated with osteoporosis diagnosed by a physician in the HEXA cohort. The weak correlation was related to the under- or over-estimation of osteoporosis. Only limited people are checked for BMD in regular medical checkups in Korea, and its diagnosis might not be conducted with BMD measurement. Moreover, the persons diagnosed with osteoporosis by a physician had medical treatment and lifestyle changes, and the BMD status could be changed in the HEXA cohort. The present study also showed that fracture experiences were weakly correlated with the osteoporosis incidence diagnosed by a physician and predicted by the prediction model. Previous studies showed that fracture and the risk of osteoporosis are weakly correlated because the fracture is involved in various factors except for a low BMD.4445 Therefore, the prediction model was suitable for estimating osteoporosis risk.
This study had some limitations. First, this study was cross-sectionally conducted to measure the biomarkers at a single point, which may be different from the actual state of the participants. However, this study was large enough to overcome the issue. Second, the BMD measurement was conducted with a peripheral densitometer, which is less accurate than DEXA. However, BMD measured with a peripheral densitometer can be used to assess osteoporosis risk in a clinical setting in the previous studies.20
,
21 Third, the WHO definition of osteoporosis was made with the BMD in the lumbar spine and femur measured with DEXA. However, BMD was measured in the wrist and tibia using a peripheral densitometer in the Ansan/Anseong cohort. The osteoporosis definition may be overestimated, corresponding to the results of the Rhee et al. study.21 However, the BMD measured with a peripheral densitometer was worthwhile to generate the prediction model for osteoporosis risk and used in a clinical setting. Fourth, the genetic impact was measured with a person’s PRS, which cannot be easily measured in a clinical setting. It can be substituted with family history, but the family history of osteoporosis was provided only in one-third of the participants in the Ansan/Anseong cohort. The family history data were not incorporated in the prediction model as genetic impact. Fifth, the prediction model did not include the parameters related to secondary osteoporosis, such as endocrine diseases, cancer, and their medications which were reported to be predominant parameters. It might be due to the small number of patients with endocrine diseases and cancer influencing BMD. Further study is needed to generate a prediction model for osteoporosis with a bigger sample size with various diseases and taking medications to influence osteoporosis risk. Finally, the direct association of BMD with the fracture experience was not determined. However, it was estimated using predicted osteoporosis risk in the HEXA cohort because fracture experience was not reported in the Ansan/Anseong cohort.
In conclusion, the osteoporosis prediction model by XGBoost was appropriate for its estimation in Asians. The model included the genetic factor, gender, number of children, age, the number of breastfed children, residence area, education, seasons, height, smoking status, estrogen replacement, serum albumin, hip circumferences, vitamin B6, and body weight. The values for the exposure risk factors in the prediction model can be applied to predict or self-monitor osteoporosis development and/or progression in a clinical setting. The modifiable parameters in the prediction model can also be applied to preventive and therapeutic measures for osteoporosis and fracture risk in Asians.
 XML Download