

 PDF
PDF Citation
 Print
Print


INTRODUCTION
Endometrial cancer (EC) is one of the prevalent gynecological cancers among women in developed countries.12 The mortality rate associated with EC is on the rise as its incidence is growing globally.1 Favorable prognostic indicators in EC patients include young age, early-stage or low-grade disease, endometrioid type histology, and absence of lymphovascular space invasion (LVSI).34 In the American Society of Anesthesiologists physical status (ASA-PS) classification < 3, low serum cancer antigen 125 (CA-125) level, and non-leukocytosis were also related with a favorable prognosis in EC patients.5678910
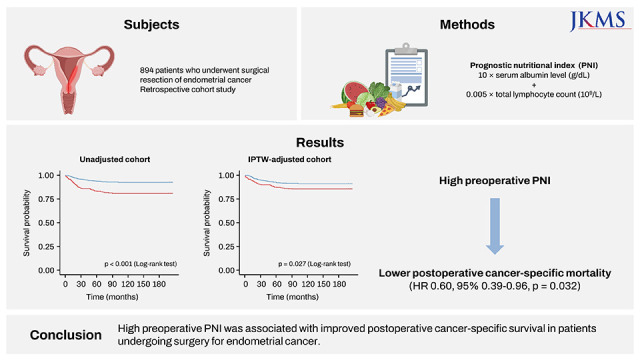
Prognostic nutritional index (PNI) is known to reflect systemic inflammation and nutritional status.11 PNI is calculated based on the serum albumin level and lymphocytes counts, using the following formula: PNI = 10 × Serum Albumin Level (g/dL) + 0.005 × Total Lymphocyte Count (109/L).12 Since PNI was first proposed as a prognostic index with respect to postoperative complication, and mortality in gastrointestinal tract malignancy,12 preoperative PNI is known a significant long-term survival predictor in ovarian and cervical cancers.131415 However, the role of prognostic PNI remains controversial in patients with EC. A previous clinical report showed that PNI was not an prognostic factor independently,16 while another study reported that a high preoperative PNI was related with favorable progression-free survival in EC patients.17 A recent prospective database study also showed that PNI was an independent prognostic factor in EC patients.18 However, when determining PNI as the prognostic indicator in EC, there have been few large-sized studies with adjustment of covariates between the high and low PNI groups. Therefore, a large-scale study with adjustment of covariates is needed to establish the prognostic value of preoperative PNI in EC patients.
In this study, we determined whether preoperative PNI can be a prognostic factor in patients undergoing EC surgery. We hypothesized that a high preoperative PNI is associated with improved postoperative cancer-specific survival in EC. We also compared the ability of preoperative PNI and other preoperative systemic inflammatory indices such as neutrophil-lymphocyte ratio (NLR) and systemic inflammation-inflammation index (SII) to determine cancer-specific survival prognostically.
METHODS
Study population
The study cohort consisted of patients who underwent staging operations including hysterectomy and bilateral salpingo-oophorectomy with pelvic or para-aortic lymphadenectomy at Seoul National University Hospital from January 2005 to March 2017.
The exclusion criteria were missing data regarding preoperative laboratory examination such as serum levels of albumin, white blood cell (WBC) with differential count, CA-125 and International Federation of Gynecology and Obstetrics (FIGO) staging. Patients with unexpected fatal events during surgery, such as massive bleeding were excluded.
Data collection and definition
The electronic medical records were reviewed retrospectively. Data related to survival were obtained from ‘Statistics Korea.’ The collected data were classified into four parts: 1) preoperative data including demographic information, comorbidities, ASA-PS classification, and preoperative laboratory findings (serum albumin level, WBC with differential count, platelet count, PNI, NLR, SII, and CA-125) measured within 1 month before surgery; 2) data on cancer characteristic including FIGO staging, grade, histologic types (endometrioid vs. non-endometrioid), and LVSI; 3) intraoperative data including lymph node dissection,19 and para-aortic lymph node dissection; and 4) postoperative data including the postoperative treatment protocol.
Study outcome
The primary outcome was postoperative cancer-specific survival. To assess the predictive ability of preoperative PNI, NLR, and SII for postoperative cancer-specific survival in patients with EC, receiver operating characteristic (ROC) curve analyses were constructed. We determined the optimal cut-off value of the preoperative PNI by maximizing the sum of sensitivity and specificity. A high PNI was defined as a PNI value greater than or equal to the cut-off, and a low PNI as a PNI value less than the cut-off. To screen for independent prognostic factors of cancer-specific survival, univariate Cox proportional hazards regression analyses were performed variables including age, underlying diseases, ASA-PS classification, FIGO stage 3 or 4, FIGO grade 3, non-endometrioid type, LVSI, lymph node dissection, para-aortic lymph node dissection, preoperative WBC count, CA-125, NLR, SII, and high PNI. For pre-screening significant variables with a P < 0.05 and well-known prognostic factors, multivariate Cox proportional hazard regression analysis was performed with stepwise forward conditional method. We also investigated postoperative 1-, 3-, and 5-year survival, postoperative intensive care unit admission, and length of hospital stay.
Statistical analysis
The Kolmogorov-Smirnov test was utilized to evaluate the normality of distribution of all continuous variables. Continuous variables are presented as mean (standard deviation) or median (interquartile range, IQR), and categorical variables are shown as number (%). The Student’s t-test was used to compare normal variables, and the Mann-Whitney U test to compare skewed variables. Categorical variables were analyzed using the χ2 or Fisher’s exact test.
We set a low PNI for exposure and generated propensity scores to determine the probability that each patient had a high PNI. To reduce bias resulting from an imbalance in covariate distribution between the high and low PNI groups, we employed the inverse probability of treatment weighting (IPTW) method.22 In brief, we put on the inverse propensity score as a weight for patients with high PNI and the inverse of 1 minus the propensity score for patients with a low PNI. Standardized mean differences (SMD) greater than 0.1 were considered to represent significant covariate imbalance. The matched factors included age, body mass index (BMI), ASA-PS classification, FIGO staging, FIGO grade, histologic type (non-endometrioid vs. endometrioid), para-aortic lymph node dissection, LVSI, underlying diseases (history of heart disease, lung disease, renal disease, or liver disease), history of other primary cancers, preoperative WBC count, CA-125 level, smoking. The successful balance of covariates after adjustment for IPTW was affirmed using SMD. We conducted Kaplan-Meier curves and multivariate Cox proportional hazards regression for postoperative cancer-specific mortality analysis in the unadjusted and IPTW-adjusted cohorts. The multivariate-adjusted restricted cubic spline curve for Cox regression demonstrated a relative association between postoperative cancer-specific mortality and preoperative PNI in the unadjusted and IPTW-adjusted cohorts.
All statistical analyses were performed using R statistical software version 4.1.3 (R Foundation for Statistical Computing, Vienna, Austria) and MedCalc Statistical Software version 20.111 (MedCalc Software Ltd, Ostend, Belgium). A two-tailed P value < 0.05 was considered statistically significant.
Ethics statement
This retrospective cohort study was performed after obtaining approval from the Institutional Review Board of the Hospital (IRB number: 2204-113-1317). The request for written informed consent was waived owing to the retrospective design. This study conformed the principles of the Declaration of Helsinki.
RESULTS
During the study period, 960 primary EC patients underwent gynecological surgery were screened. Among them, 66 were excluded from the study (44, lack of laboratory results and clinical information; 4, indeterminate FIGO staging; 17, the cause of death was not related to EC; and 1, intraoperative massive bleeding event). Totally, 894 patients were included (Fig. 1).
Fig. 1
Study flow diagram.
PNI = prognostic nutritional index, IPTW = inverse probability of treatment weighting.
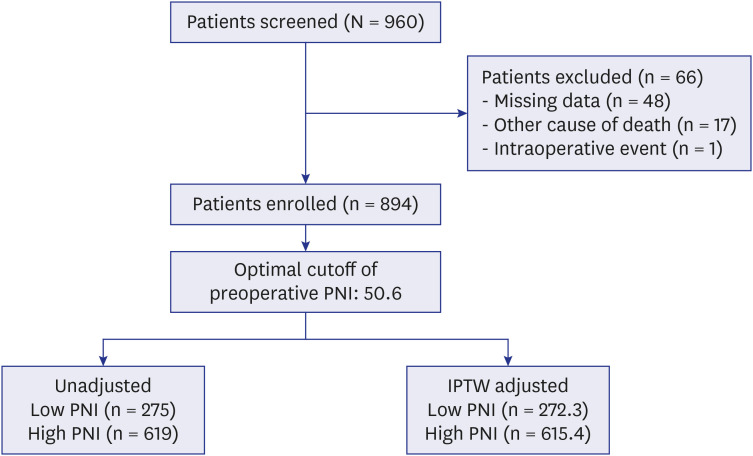
The optimal cut-off value of preoperative PNI for discriminating postoperative cancer-specific survival using ROC curve analysis was 50.6 and patients were divided into the high (preoperative PNI ≥ 50.6) or low (preoperative PNI < 50.6) PNI groups (Supplementary Fig. 1). Patient characteristics, cancer-related data, and preoperative laboratory findings are shown in Table 1. After IPTW adjustment, all matched factors were balanced. In the IPTW-adjusted cohort (high PNI [n = 615.4] and low PNI [n = 272.3] groups), serum albumin levels and PNI were significantly higher in the high PNI group than those in the low PNI group (serum albumin level: 4.4 [4.3–4.6] vs. 4.0 [3.8–4.2] g/dL, P < 0.001; PNI: 54.6 [52.6–57.3] vs. 48.1 [45.5–49.5], P < 0.001). NLR and SII were lower in the high PNI group (NLR: 1.7 [1.3–2.2] vs. 2.5 [1.8–3.8], P < 0.001; SII: 428.3 [315.6–594.7] vs. 642.2 [395.5–1128.4], P < 0.001).
Table 1
Patient characteristics, cancer related data, preoperative laboratory findings, and postoperative treatment protocol in unadjusted and IPTW adjusted patient cohorts
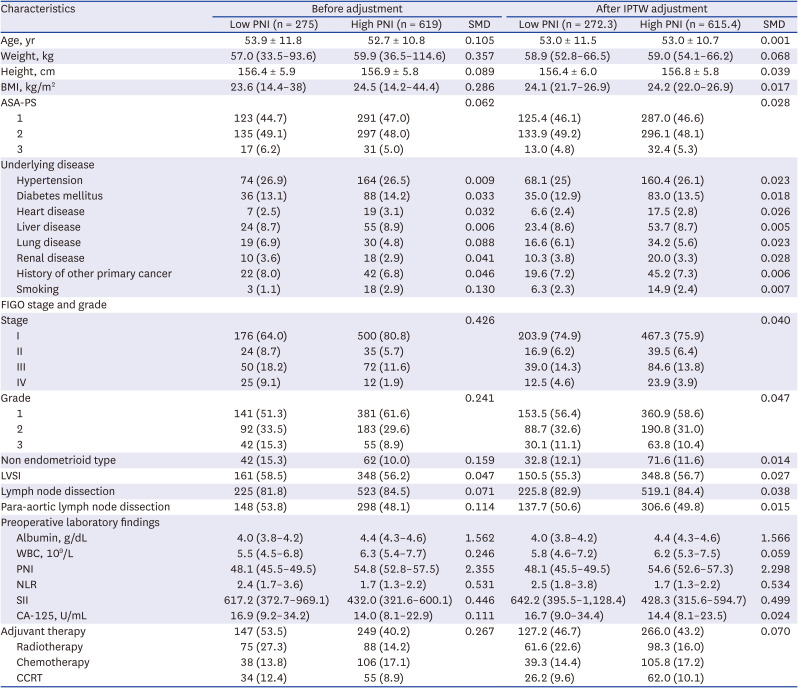
Data are median (interquartile range), mean ± standard deviation, or number (%).
PNI = prognostic nutritional index, IPTW = inverse probability of treatment weighting, SMD = standardized mean difference, BMI = body mass index, ASA-PS = American Society of Anesthesiologists’ physical status, FIGO = International Federation of Gynecology and Obstetrics, LVSI = lymphovascular space invasion, WBC = white blood cell, NLR = neutrophil-lymphocyte ratio, SII = systemic inflammation-inflammation index, CA-125 = cancer antigen 125, CCRT = concurrent chemoradiation therapy.
Primary outcome
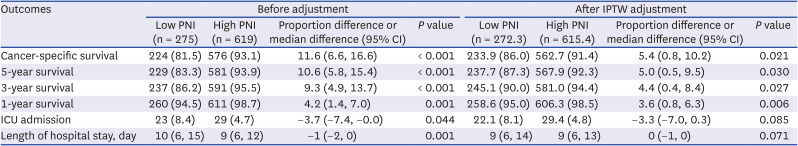
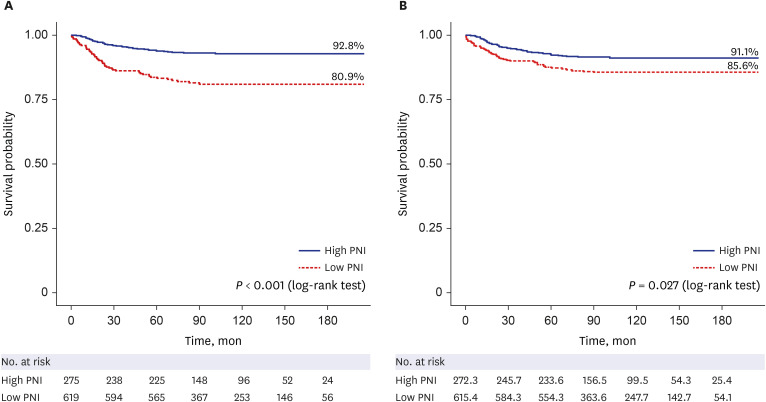
In the unadjusted cohort, postoperative cancer-specific survival rate was 93.1% in the high PNI group and 81.5% in the low PNI group (proportion difference [95% confidence interval; 95% CI],11.6% [6.6–16.6%]; P < 0.001) (Table 2). After IPTW adjustment, cancer-specific survival rate was still higher in the high PNI group than in the low PNI group (91.4% vs. 86.0%, 5.4% [0.8–10.2%]; P = 0.021).
Table 2
Postoperative clinical outcomes in unadjusted and IPTW adjusted cohorts
In Kaplan-Meier survival plots, the high PNI group showed a higher postoperative cancer-specific survival rate in the unadjusted (P < 0.001) and IPTW-adjusted cohort (P = 0.027; Fig. 2) than the low PNI group.
Fig. 2
Kaplan-Meier curves for cumulative survival according to preoperative PNI in (A) unadjusted cohort and (B) IPTW cohort.
PNI = prognostic nutritional index, IPTW = inverse probability of treatment weighting.
In multivariate Cox proportional hazard regression analysis, high PNI was a significant determinant with a hazard ratio of 0.51 (95% CI, 0.34–0.79; P = 0.002) for postoperative cancer-specific mortality in the unadjusted cohort (Table 3). In the IPTW-adjusted cohort, independent determinants of cancer-specific mortality in patients with EC were age (hazard ratio [95% CI], 1.07 [1.04–1.09]; P < 0.001), FIGO stage 3 or 4 (4.30 [2.48–7.45]; P < 0.001), non-endometrioid type (1.98 [1.01, 3.89]; P = 0.048), para-aortic lymph node dissection (2.05 [1.16–3.62]; P = 0.014) and high PNI (0.60 [0.38–0.96]; P = 0.032) (Table 3). The results of multivariate Cox proportional hazard regression analysis including continuous PNI value rather than dichotomous variable are described in Supplementary Table 1. Preoperative PNI was still an independent predictor for cancer specific mortality (unadjusted cohort: 0.94 [0.91–0.98]; P = 0.001 and IPTW-adjusted cohort: 0.93 [0.87–0.99]; P = 0.015).
Table 3
Univariate and multivariate Cox proportional hazard regression model for postoperative cancer-specific mortality in patients with endometrial cancer
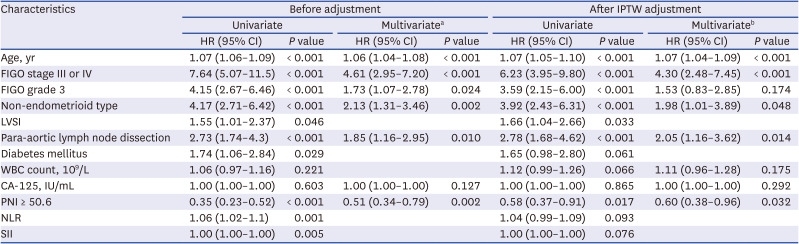
IPTW = inverse probability of treatment weighting, HR = hazard ratio, CI = confidence interval, FIGO = International Federation of Gynecology and Obstetrics, LVSI = lymphovascular space invasion, WBC = white blood cell, CA-125 = cancer antigen 125, PNI = prognostic nutritional index, NLR = neutrophil-to-lymphocyte ratio, SII = systemic immune-inflammation index.
aIn multivariate Cox time proportional regression analysis with stepwise forward conditional method, LVSI, diabetes mellitus, WBC count, CA-125, NLR, and SII were adjusted.
bIn multivariate Cox time proportional regression analysis with stepwise forward conditional method, FIGO grade, LVSI, diabetes mellitus, CA-125, WBC count, NLR, and SII were adjusted.
The multivariable-adjusted restricted cubic spline curve demonstrated an overall negative association between preoperative PNI and the relative hazard for cancer-specific mortality in the unadjusted and IPTW-adjusted cohorts (P = 0.006 in the unadjusted cohort; P < 0.001 in the IPTW-adjusted cohort) (Supplementary Fig. 2).
Secondary outcomes
The postoperative 1-, 3-, and 5-year survival rates were higher in the high PNI group in the unadjusted and IPTW-adjusted cohorts (Table 3). The length of hospital stay was significantly shorter in the high PNI group in both the unadjusted and IPTW-adjusted cohorts.
The ROC curve analyses were fulfilled to compare the predictive ability of three preoperative inflammatory markers for postoperative cancer-specific survival. The area under the curve (AUC) with 95% CI was 0.642 (0.577–0.708), P < 0.001 for PNI; 0.599 (0.534–0.664), P = 0.003 for NLR; and 0.560 (0.493–0.627), P = 0.082 for SII in the unadjusted cohort (Supplementary Fig. 1). Significant differences in the AUC were observed between PNI and SII (P = 0.022) and between NLR and SII (P = 0.035).
DISCUSSION
In this study, we evaluated the association between preoperative PNI and postoperative cancer-specific survival in patients with EC and demonstrated that high preoperative PNI was an independent prognostic factor for postoperative cancer-specific survival.
EC is a common cancer in women with a global age-standardized incidence rate of 8.7%.23 In an epidemiological point of view in Korea, the incidences of ECs increased from 1999 to 2017.24 A recent study investigating the incidence and mortality of various cancers showed that the mortality associated with EC had increased since 2005 in the United States.25 Evaluation of predictive factors of postoperative outcomes in patients with EC is considered a part of the efforts to achieve a better prognosis.
Two retrospective studies and one prospective database study have reported the potential impact of preoperative PNI on the prognosis of EC. These three studies have demonstrated conflicting results. In a retrospective study conducted in 32 patients with stage 4B EC, preoperative PNI was not an independent prognostic factor in the multivariate analysis.16 Another retrospective study reported that PNI was associated with progression-free survival in 101 EC patients all clinical stages.17 A prospective database study also showed that PNI was an independent prognostic factor in 439 EC patients at all clinical stages.18 The current study included 894 EC patients at all clinical stages. Moreover, the IPTW-adjusted cohort was also used to reduce the imbalance of covariates and reinforce the role of preoperative PNI as a prognostic factor for cancer-specific survival. We believe that this study can be distinguished from the previous studies by its relatively large sample size, coverage of all clinical stages of EC, and the additional use of IPTW analysis. In our study, patients with a high PNI showed a lower cancer-specific mortality rate with a hazard ratio of 0.60 (95% CI, 0.38–0.96) than with a low PNI. Continuous PNI also showed a hazard ratio of 0.93 (0.87–0.99) of cancer-specific mortality. The restricted cubic spline curve also demonstrated a negative association between postoperative cancer-specific mortality and preoperative PNI levels.
PNI was determined based on the total lymphocyte count and serum albumin level. Lymphocytes, an element of PNI, plays a central role in cytotoxic immunity and attack cancer cells. The interaction between systemic inflammation and the immune system plays a pivotal role in the genesis, progression, and metastasis of cancer cells.26 Systemic inflammation increases the neutrophil count and reduces the lymphocyte count, which results in a reduction in the cell-mediated cytotoxic immune response.27 In advanced cancer, the tumor itself directly expresses inflammatory factors, which can disturb the immune system,2829 and the apoptosis and downregulation of lymphocytes, which are manifested with cancer progression, may aggravate lymphopenia.3031 A recent study demonstrated that EC itself suppressed the cytotoxic killing of lymphocytes by secreting immunosuppressive cytokines, such as transforming growth factor β.32 Albumin, another element of PNI, is the most well-known nutritional indicator.3334 Albumin accounts for more than 50% of proteins in the blood and has a variety of functions, including immunomodulation, drug transport, and antioxidant effects.35 Cancer-induced systemic inflammation also exhausts proteins such as albumin and promotes malnutrition and cachexia.36 Moreover, the release of proinflammatory cytokines such as tumor necrosis factor alpha and interleukin, which are involved in tumor growth and progression, is associated with albumin downregulation.3738 The inhibition of albumin synthesis can be a marker of cancer growth. Taken together, PNI contains comprehensive information on both the immune system and nutritional status. A low PNI suggests an excessive inflammatory reaction and cancer progression. Therefore, we believe that a low PNI is related with poor prognosis in EC patients.
NLR is an inflammatory marker that has been reported to be related with short overall and progression-free survival, and increased lymph node metastasis in patients with EC.39404142 SII, another inflammatory marker, has been reported to be an independent prognostic factor like NLR.43
In contrast to previous studies, this study showed that NLR and SII were not independent prognostic factors for postoperative cancer-specific survival in the multivariate analysis, although they were statistically significant in the univariate analysis. Moreover, the ROC curve analysis showed that the discrimination power for postoperative cancer-specific survival was the highest in PNI, followed by NLR and SII. The predictive ability of SII for postoperative cancer-specific survival was significantly lower than that of PNI. Our results suggest that preoperative PNI may have an advantage over preoperative NLR and SII in predicting the prognosis of EC patients.
In this study, in addition to low preoperative PNI, advanced age, FIGO stage 3 or 4, the non-endometrioid type, and para-aortic lymph node dissection were independent factors for postoperative cancer-specific mortality in patients with EC. This finding further supports the results of previous studies, in which old age, advanced FIGO stage, high FIGO grade, and non-endometrioid type were associated with poor prognosis in patients with EC.34445 Conflicting results were reported for para-aortic lymph node dissection in EC patients, with respect to whether it improved the prognosis.4647 In this study, para-aortic lymph node dissection was found to be rather related to poor outcome in EC patients. More controlled studies are required for the impact of para-aortic dissection on prognosis of EC patients.
This study has several limitations. First, even though the IPTW analysis was performed to decrease any selection bias between the high PNI and low PNI groups, this was a retrospective study. Therefore, there is a probability of unexpected selection bias. Additionally, the data were collected from a single tertiary institution. Second, although the cut-off value of the preoperative PNI was obtained from the ROC curve analysis, this was arbitrary. Although 45 was suggested as cut-off value of PNI in a previous study,18 there were only 56 patients out of 894 patients in our cohort. To determine if it was a result of arbitrary dichotomy, we performed multivariate analysis on continuous PNI in Supplementary Table 1. PNI was still an independent predictor. Caution should be exercised when interpreting our results. Further studies are required to verify the optimal cut-off value of the preoperative PNI. Third, progression-free survival was not investigated in this study. Therefore, the effect of the preoperative PNI on progression-free survival in patients with EC remains unknown. Forth, findings in this study may contribute to enriching literature, but the clinical benefits are unclear in patients with EC. Further prospective studies are necessary to find out that clinical outcomes will be improved when immune nutritional status or immune-nutrition marker, such as PNI, are corrected.
In conclusion, a high preoperative PNI was associated with improved postoperative cancer-specific survival in patients undergoing surgical resection for EC. This finding helps stratify patients with a better prognosis postoperatively. Further prospective studies are needed to determine whether preoperative interventions for PNI improve the prognosis in patients with EC.
 XML Download