

 PDF
PDF Citation
 Print
Print


INTRODUCTION
A vaccination program against coronavirus disease 2019 (COVID-19) caused by severe acute respiratory syndrome coronavirus 2 (SARS-CoV-2), which started in Wuhan, China in December 2019, was initiated in South Korea in February 2021.1 Healthcare workers (HCWs) were one of the first groups to receive the COVID-19 vaccine due to the risk of occupational exposure to SARS-CoV-22; specifically, they underwent two types of primary vaccination series: a two-dose BNT162b2 (Pfizer-BioNTech) series and a two-dose ChAdOx1 nCoV-19 (Oxford-AstraZeneca; referred to as AZD1222) series.3 From October 2021, the booster vaccination was administered to the majority of HCWs after having previously received one of the mRNA vaccines, namely BNT162b2. In Korea, there were two major vaccination groups in HCWs—the ChAdOx1/ChAdOx1/BNT162b2 (CCB) and the BNT162b2/BNT162b2/BNT162b2 (BBB) group.
Neutralizing antibody responses against the omicron variant and the occurrence of omicron breakthrough infection have rarely been investigated in the CCB and BBB groups in Korea. Our institution has conducted a cohort study to investigate the vaccine-induced immunities in HCWs since the rollout of COVID-19 vaccines while also tracking COVID-19 breakthrough infections. Therefore, we investigated the correlation between neutralizing antibody responses against the omicron variant and the occurrence of omicron breakthrough infections, as well as the correlation between vaccination groups and breakthrough infection using the observational cohort data.
METHODS
Study design and data collection
This study was conducted at Chung-Ang University Hospital in Seoul, Korea. At this medical center, COVID-19 vaccination for HCWs began in early March 2021. The first vaccine dose of BNT162b2 was administered from March 11 to 13, 2021; after 3 weeks, the second dose was given from April 1 to 3, 2021. The first dose of ChAdOx1 was administered from March 4 to 17; after 11–12 weeks, the second dose was given from May 20 to June 10, 2021. The booster dose was administered from October 20 to December 28, 2021. Blood sampling for serologic tests was performed on HCWs only if they provided written informed consent to this study. Only HCWs who received the primary series with booster vaccination were included in this study. The first blood sampling was done 184 median days (interquartile range [IQR]: 183–187) after 1st immunization in CCB groups and 185 median days (IQR: 183–186) after 1st immunization in BBB group. The 2nd blood sampling was done 63 median days (IQR: 61–90) after 3rd booster vaccination in CCB group and 61 median days (IQR: 56–63) after 3rd booster vaccination in BBB group. Analysis of anti-spike IgG, neutralizing antibodies against wild type and omicron variants and interferon-gamma (IFN-γ) release assay (IGRA) for wild type virus was performed on each of the collected samples, but the samples collected from the BBB group after the second dose did not undergo IGRA analysis. Investigation of breakthrough infection was performed until June 11, 2022. We collected blood samples twice from the participants for evaluation 6 months after the 1st vaccination dose and 2 months after the booster vaccination. The overall flow of this study is presented in Fig. 1.
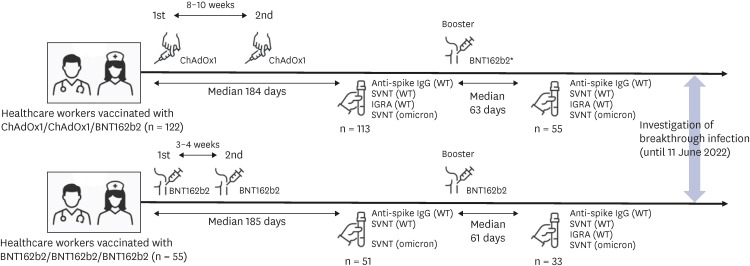
Fig. 1
Schematic illustration of the study flow. Healthcare workers were vaccinated with a 2-dose ChAdOx1 series and a booster dose of BNT162b2 (n = 122) or with a 3-dose BNT162b2 series (n = 55). The interval between the vaccine doses, the interval from the vaccine dose to blood collection, the number of blood samples, the type of test performed on the blood samples, and the time of investigation of breakthrough infection are specified.
WT = wild type, SVNT = surrogate virus neutralization test, IGRA = interferon-γ release assay.
![]()
All HCWs participating in this study had no prior history of COVID-19 before 1st and 2nd blood sampling. From the 2nd blood sampling until June 11, 2022, point surveillance was performed for all participants through questionnaires to determine whether they had a breakthrough infection. The first case of breakthrough infection among participants occurred on January 28, 2022. Since the omicron variant became dominant in the 3rd week of January 2022 in Korea,4 the breakthrough infections in the HCWs of this study occurred during the omicron-predominant period.
Assessment of neutralizing antibody responses against SARS-CoV-2
Neutralizing antibody responses against wild type SARS-CoV-2 were detected using the GenScript SARS-CoV-2 cPass surrogate virus neutralization test (SVNT-WT) kit (GenScript Biotech Corporation, Piscataway, NJ, USA). The test was modified to detect SARS-CoV-2 neutralizing antibodies against the omicron receptor binding domain (RBD) by replacing the horseradish peroxidase-conjugated recombinant RBD fragment according to the manufacturer’s specifications. The neutralization antibody responses against the omicron variant were detected using this modified commercial SVNT kit (SVNT-O). The percentage of neutralization was calculated as follows: (1 − Optical Density [OD] of Sample/OD of Negative Control) × 100.
Assessment of anti-spike IgG
The SARS-CoV-2 spike-specific IgG was detected using the Euroimmun anti-SARS-CoV-2 enzyme-linked immunosorbent assay (Euroimmun, Lübeck, Germany). The results were expressed as arbitrary units per milliliter (AU/mL).
Assessment of SARS-CoV-2-specific T cell responses
SARS-CoV-2-specific T cell responses were measured by quantification of the IFN-γ release against wild type after stimulation with the SARS-CoV-2 spike protein using the Euroimmun SARS-CoV-2 Interferon Gamma Release Assay (Euroimmun). A set of three tubes was used for each sample: 1) SARS-CoV-2 IGRA BLANK without the IFN activating substance as the individual background stimulation; 2) SARS-CoV-2 IGRA TUBE containing the S1 domain of the SARS-CoV-2 spike protein; and 3) SARS-CoV-2 IGRA STIM containing a mitogen for unspecific IFN stimulation to evaluate the viability and stimulation capacity of T cells and the number of T cells in the participant’s blood sample. The response was defined as the IFN-γ concentration in the TUBE sample minus that in the BLANK sample, in international units per milliliter (IU/mL). IFN-γ responses above 200 mIU/mL were defined as positive according to the manufacturer’s instructions.5
Statistical analysis
All statistical analyses were performed using GraphPad Prism version 9.0 (GraphPad Software, San Diego, CA, USA) and IBM SPSS Statistics version 26.0 (IBM Corp., Armonk, NY, USA). Categorical variables were analyzed using the χ2 test or Fisher’s exact test. Continuous variables were described as median values and compared using the Mann-Whitney U test. Statistical significance was set at P < 0.05. Since the time interval between the booster vaccination and blood sampling was different between the two groups (Supplementary Fig. 1), the time difference was controlled in the statistical models. To adjust the effect of the time difference in comparing the serologic test results between the two groups, we performed multiple linear regression models with confounding variables. To compare the cumulative incidence of breakthrough infection of the two groups after the booster vaccination, the Gehan-Breslow-Wilcoxon method was used because the data of this study did not satisfy the proportional hazards assumption.
RESULTS
The 177 enrolled HCWs received three doses of COVID-19 vaccination and blood tests were performed at least once after the primary series. Of the 177 HCWs enrolled in the study, 122 HCWs were classified as the CCB group and 55 HCWs as the BBB group. The median age was 38 years (IQR: 30–48) in both the CCB and BBB groups (P = 0.934), and two-thirds of both groups were women (66.4% in the CCB group vs. 67.3% in the BBB group, P = 0.909). After receiving the primary series, 164 HCWs participated in the blood sampling (113 in the CCB group and 51 in the BBB group). After receiving the booster vaccination, 88 HCWs participated in the blood sampling (55 in the CCB group and 33 in the BBB group).
Trends of humoral immunities
The median values of the SVNT-WT in both groups significantly increased after the booster vaccination ([before-after] 89.2–98.1% in the BBB group vs. 72.0–97.6% in the CCB group, all P < 0.001). The median values were higher in the BBB group than in the CCB group after the primary series (89.2% [IQR: 79.6–89.2%] vs. 72.0% [IQR: 50.9–87.2%], respectively, P < 0.001; Fig. 2A). Likewise, the median values were higher in the BBB group than in the CCB group after the booster vaccination (98.1% [IQR: 97.7–98.4%] vs. 97.6% [IQR: 97.2–97.7%], respectively, P < 0.001; Fig. 2A), but this difference was not significant in a multiple linear regression model, which included the time from the booster vaccination to blood collection (P = 0.704, Fig. 2A).
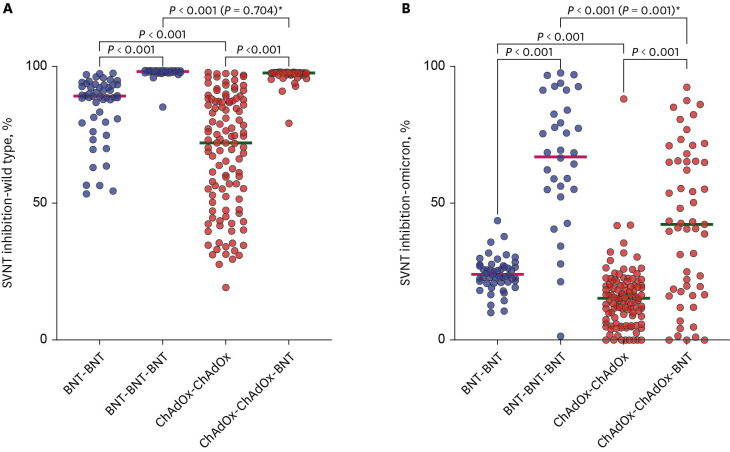
Fig. 2
Comparison of SVNT values by vaccination type. The horizontal bar is the median value. P values according to group comparisons are presented.
SVNT = surrogate virus neutralization test, BNT = BNT162b2, ChAdOx = ChAdOx1 nCoV-19.
To adjust the effect of the time-difference in comparing the serologic test results between the two groups, the comparison in (A) was not different (P = 0.704), but that in (B) was different (P = 0.001) in multiple regression models*.
![]()
Although the median value of SVNT-O was higher in the BBB group than in the CCB group after the primary series (23.6% [IQR: 21.1–27.0%] vs. 15.2% [IQR: 8.5–20.0%], respectively, P < 0.001; Fig. 2B), neither value met the threshold of 30% for reading a neutralizing antibody response. The median values in both groups increased after the booster dose, but the value of the BBB group remained higher than that of the CCB group (68.6% [IQR: 55.1–87.7%] vs. 42.3% [IQR: 17.7–65.4%], respectively, P < 0.001; Fig. 2B). In a multiple linear regression model including the time from the booster vaccination to blood collection, there was still a significant difference between the two groups (P = 0.001, Fig. 2B).
The median values of the anti-spike IgG significantly increased after the booster vaccination in both groups (4.700–7.979 AU/mL in the BBB group vs. 2.677–7.246 AU/mL in the CCB group; all P < 0.001). The median values were higher in the BBB group than in the CCB group after the primary series (4.700 [IQR: 3.751–5.366] AU/mL vs. 2.677 [IQR: 1.917–3.912] AU/mL, respectively, P < 0.001). However, there was no difference of median values of the anti-spike IgG after the booster vaccination between two groups (7.979 [IQR: 7.410–8.469] AU/mL in the BBB group vs. 7.246 [IQR: 5.280–8.697] AU/mL in the CCB group; P = 0.108) (Fig. 3A).
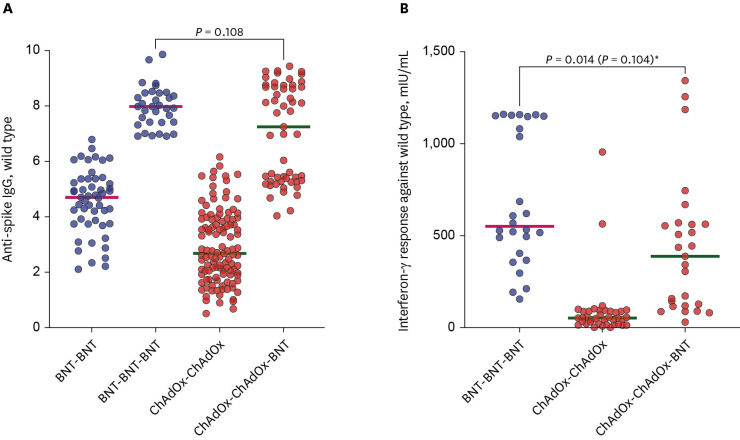
Fig. 3
Comparison of anti-spike IgG (A) and interferon-gamma responses (B) against wild type virus by vaccination type. The horizontal bar is the median value. P values according to group comparisons are presented.
BNT = BNT162b2, ChAdOx = ChAdOx1 nCoV-19.
In a multiple regression model, which included time from the booster dose to blood sampling, the comparison in (B) was not statistically significant (P = 0.104)*.
![]()
Trend of cellular immunities
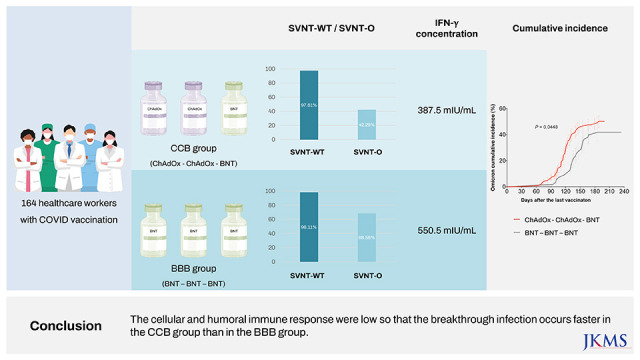
In the CCB group, the median IGRA values significantly increased after the booster dose from 93.2 mIU/mL to 429.3 mIU/mL over a cutoff of 200 mIU/mL (P < 0.001). The median IGRA value after the booster dose was higher in the BBB group than in the CCB group (550.5 vs. 387.5 mIU/mL, respectively, P = 0.014; Fig. 3B). However, this result was not statistically significant in a multiple linear regression model, which included the time until blood collection after the booster dose as a variable (P = 0.104, Fig. 3B).
Omicron breakthrough infections
During the study period, total breakthrough infections occurred in 84 HCWs (47.5% of 177), and more cases occurred in the CCB group than in the BBB group (50.0% of 122 vs. 41.8% of 55), but there was no significant difference (P = 0.313). Fig. 4 shows the cumulative incidence of total breakthrough infection between the two groups over time, which was significantly different (P = 0.045), indicating that breakthrough infection increased one month earlier in the CCB group than in the BBB group. There was no significant difference between SVNT-WT, SVNT-O, anti-spike IgG, and IGRA values between HCWs with and without breakthrough infections (Supplementary Fig. 2). However, when the same comparison was made between 6 HCWs with and 82 HCWs without breakthrough infections within 30 days of the 2nd blood sampling after booster vaccination, the median values of the anti-spike IgG and SVNT-O were lower in HCWs with breakthrough infections (5.178 vs. 7.950, P = 0.013; 31.0% vs. 58.0%, P = 0.031, respectively) (Fig. 5).
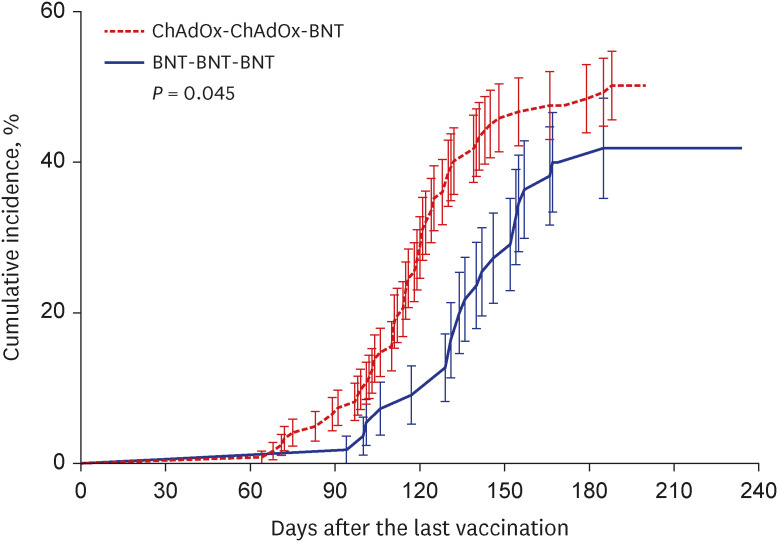

Fig. 4
Cumulative incidence of coronavirus disease 2019 breakthrough infections. Kaplan-Meier curves are used for the cumulative probability of breakthrough infection during the observational period among healthcare workers who received a 2-dose ChAdOx1 series and a booster dose of BNT162b2 (red) compared with those who received a 3-dose BNT162b2 series (blue). P values according to group comparisons are presented.
BNT = BNT162b2, ChAdOx = ChAdOx1 nCoV-19.
![]()
Fig. 5
Comparison of SVNT for wild type (A), Omicron (B), anti-spike IgG (C), and IGRA (D) according to breakthrough infection. BI was defined as infection with severe acute respiratory syndrome coronavirus 2 within 30 days of the 2nd blood sampling after booster vaccination. These data were obtained from 88 healthcare workers who underwent blood sampling after the booster vaccination dose. The horizontal bar is the median value. P values according to group comparisons are presented.
SVNT = surrogate virus neutralization test, IGRA = interferon-γ release assay, BI = breakthrough infection.
![]()
DISCUSSION
The CCB group showed lower levels of neutralizing responses against the omicron variant than the BBB group after the primary series and booster vaccination. Moreover, in the CCB group, omicron breakthrough infection occurred earlier than in the BBB group.
The median neutralizing antibody responses to wild type SARS-CoV-2 in the BBB groups was not higher than those in the CCB group (Fig. 2A). This is consistent with one of the results of the COV-BOOST study. In that study, when BNT162b2 was administered as a booster for both ChAdOx1/ChAdOx1 and BNT162b2/BNT162b2 groups, the increase in the neutralizing antibody response appeared far higher in the latter group than in the former group.6 Thus, as with our study, the difference between the two groups disappeared after the booster vaccination. Lower neutralizing antibody responses to wild type SARS-CoV-2 were found after the primary series with ChAdOx1 (Fig. 2A). Likewise, lower antibody responses were also found to the omicron variant after the primary series with ChAdOx1 than those after the primary series with BNT162b2 (Fig. 2B). This might be a predictable result according to the study of Cromer et al.,7 which suggested that neutralization against a particular variant is strongly associated with neutralization against the ancestral virus. Furthermore, this phenomenon persisted even after the booster vaccination (Fig. 2B). In the COV-BOOST study, the neutralizing antibody response data for the delta variant showed that the boosting effect of BNT162b2 was less than that of the wild type virus.6 Considering that the omicron variant has a more superior immune evasion ability than the delta variant,8 it is plausible that the neutralizing antibody response level of the CCB group to the omicron variant could not reach that of the BBB group despite a booster vaccination with BNT162b2. In addition, vaccine-induced immunity wanes over time.9
Although Khoury et al.10 suggested that neutralizing antibody responses are predictive of immune protection from SARS-CoV-2 infection, it has been unclear whether the difference in the neutralizing responses against the omicron variant between the CCB and BBB groups was associated with the difference in the occurrence of omicron breakthrough infection between them. In our study, while there was no difference in the frequency of breakthrough infection between the two groups within 6–8 months after booster vaccination, breakthrough infection accumulated more rapidly in the CCB group than in the BBB group. There might be several reasons for this difference. However, there was no demographic difference between the two groups of HCWs and no particularly notable difference in their behaviors. Thus, the difference in their serostatus should be considered first. Furthermore, considering that the neutralization response to the omicron variant was lower in HCWs with breakthrough infections than in those without breakthrough infections within 30 days of the 2nd serologic testing post-booster vaccination, the lower neutralization response in the CCB group is the most plausible cause of the earlier occurrence of breakthrough infection in this group. The association between the level of neutralizing response and breakthrough infection was also found in previous studies comparing the ChAdOx1/ChAdOx1 and BNT162b2/BNT162b2 groups. In a few studies, including this study, the neutralizing response was lower in the ChAdOx1/ChAdOx1 group than in the BNT162b2/BNT162b2 group.311 Additionally, three large cohort studies conducted in the United Kingdom (UK) directly compared the protective efficacy against COVID-19 between the ChAdOx1/ChAdOx1 and BNT162b2/BNT162b2 groups.121314 Although there was no difference in COVID-19 incidence or hospitalization between the two groups in a previous study,11 the ChAdOx1/ChAdOx1 group had a greater COVID-19 incidence and hospitalization rate than that of the BNT162b2/BNT162b2 group in other studies.1314 Collectively, it is suggested that the difference in the vaccine-induced neutralizing response is associated with the difference in breakthrough infection during the omicron variant era.
This study has several limitations. First, considering the small number of subjects used in this study, further research, such as one of the above-mentioned large-scale studies in the UK, is required. Second, some study participants may have had undetected COVID-19 during symptom-based testing, which may have affected antibody test results among HCWs enrolled in this study. Third, as a neutralizing test using live virus is not clinically applicable, it would be rational to utilize the commercial SVNT kits. Lastly, we had difficulty interpreting the results because we lacked the IGRA values for the BBB group after the primary series. Despite these limitations, the present study has the strength to identify omicron breakthrough infection using neutralizing antibodies against the omicron variant.
In conclusion, HCWs vaccinated with CCB showed a lower neutralization response against the omicron variant than those with the BBB vaccination series. This difference in neutralization response may be responsible for the omicron breakthrough infection occurring earlier in the former than in the latter group. To respond to the continuing outbreak of SARS-CoV-2 and the future respiratory virus pandemic, further research is needed to obtain maximum efficacy by appropriately utilizing various vaccine types.
 XML Download