

 PDF
PDF Citation
 Print
Print


INTRODUCTION
The curriculum of medical school is inherently stressful. Medical students have a high risk of depression, burnout, anxiety, sleep disorders, and are subjected to immense stress under competitive grading systems.1 Prior researches generally confirm that moving toward the pass/fail grading system improves students’ psychological well-being (reduce stress and anxiety), increase self-efficacy, decrease competitiveness, and promote cooperative learning.2345 Against many concerns, the change from the traditional grading system to the pass/fail system did not show reduction in the academic performance, USMLE test scores, success in residency placement, and level of attendance.16 Despite the trend to introduce criterion-referenced assessment (CRA) in medical schools around the world based on these advantages and about 88% of medical schools in the United States in 2020–2021 use this evaluation method, norm-referenced assessment (NRA) is still widely used in many countries.7 In particular, only two (5%) of forty medical schools in South Korea have adopted CRA as of 2022. Furthermore, medical students in South Korea are known to have depression, burnout, sleep problems, and high stress under a heavy-loaded medical curriculum, which may lead to low QOL.891011 Improved quality of life (QOL) for medical students may be essential for future career motivation and the prevention of depression, anxiety, or sleep disorder in residency.12 However, there is insufficient comparative data available to guide decision making in this area between CRA and NRA among medical schools.
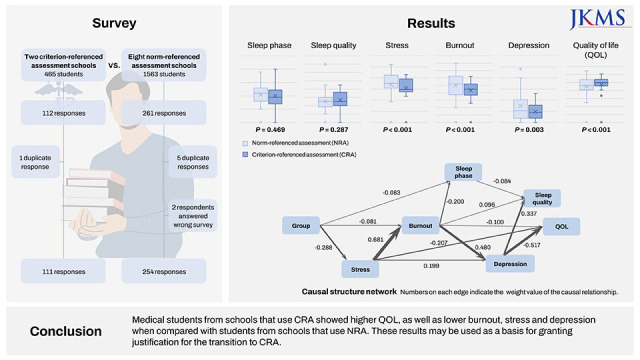
This study aimed to investigate whether CRA offers higher QOL to Korean medical students compared with NRA. Our hypothesis is that there is a significant difference of QOL between the two assessment groups alongside its 5 related factors (sleep phase, sleep quality, stress, burnout and depression). Hence, a cross-sectional survey was administered to Korean medical students. In addition to typical multiple linear regression (MLR) analyses, machine learning regression models were applied in an attempt to capture non-linear relationships between the multiple factors in play, and causal structure learning techniques were utilized to model the putative directions of effects between the factors with the given information from a single cross-sectional survey.
METHODS
Online survey
In South Korea, medical schools with a 4-year curriculum that consists of 2 years of preclerkship and 2 years of clerkship phase, and those with a 6-year curriculum that consists of 2 years of premedical, 2 years of preclerkship and 2 years of clerkship phase coexist. The preclerkship phase curriculum is based on a typical lecture-and-test style education, while the clerkship phase consists of various methods of learning and assessment, depending on the clerkship hospital, department, subject or school. Hence, the study target was limited to students in their preclerkship phase. Students in their 2 years of preclerkship phase from 10 universities were invited for the online survey, including 2 schools which use CRA: Inje University, College of Medicine; Yonsei University, College of Medicine and 8 schools which use NRA: Hallym University, College of Medicine; Hanyang University, College of Medicine; Keimyung University, College of Medicine; Korea University, College of Medicine; Kyungpook National University, School of Medicine; Pusan National University, School of Medicine; Seoul National University, College of Medicine; The Catholic University of Korea, College of Medicine. The survey included 6 validated questionnaires that yield a numerical score regarding sleep (reduced Morningness–Eveningness Questionnaire [rMEQ], 5 to 23 points; Pittsburgh Sleep Quality Index [PSQI], 0 to 21 points), stress (Medical Student Stress Inventory in Korea [MSSIK], 9 to 116 points), burnout (Korean Maslach Burnout Inventory Student Survey [K-MBI-SS], 14 to 98 points), depression (Center for Epidemiologic Studies Depression Scale [CESD], 0 to 60 points) and QOL (QOL assessment developed by the WHOQOL group, 26 to 130 points).131415161718 MSSIK is a questionnaire devised to measure stress while considering the sociocultural environment in Korean medical schools. Since our survey targeted students in their preclerkship phase, we excluded 11 questions related to the stress of clinical years from the MSSIK questionnaire.15 K-MBI-SS is a modified version of the MBI-SS which has been validated with Korean students in previous studies.16
The survey was administered using Google Forms platform starting on October 22, 2021 and closing on November 16, 2021. The web address to the survey was distributed to student representatives of each school and was conveyed to students using closed membership social media groups or messenger services.
Average comparison and linear regression
Data validation was processed by Shapiro-Wilk test, Durbin-Watson test, Non-constant Variance Score test, Bonferroni Outlier test and testing for multicollinearity with variance inflation factor. The respondents were divided into the students with CRA (CRA group) and the students with NRA (NRA group). The χ2 test was performed to determine potential differences in gender or grade (preclerkship year 1 or 2) across groups. Student’s t-test was implemented to check for differences of the scores of five factors and QOL between gender groups. The mean and standard deviation of each score of two groups were compared through the aspect of 6 domains including sleep phase, sleep quality, stress, burnout, depression and QOL. The QOL scores were further divided into four domains: physical, psychological, social and environmental.1920 MLR was applied to analyze the combined relationship between QOL (independent variable) and the 5 factors (dependent variables).
Machine learning regression model training and validation
An array of 7 base models were developed with nonlinear machine learning regression algorithms including k-nearest neighbors, decision tree, epsilon-support vector regression, random forest (RF), AdaBoost (ADA), gradient boosting machine and multilayer perceptron (ANN). The base models were trained with the scikit-learn package (version 1.0.2) using default settings and 5-fold cross validation, except for setting ANN to use a single hidden layer of 5 nodes due to the small input data dimension. The top 3 models with the highest R squared value among the 7 base models were selected and further trained and validated using nested 5-fold cross validation and hyperparameter tuning with random search. Eventually, RF showed the highest R squared value after hyperparameter tuning, and thus was opted as the final nonlinear machine learning model. The MLR model was also trained and validated using 5-fold cross validation to predict QOL scores with scores of the 5 factors. The 5-fold cross validation strategy was incorporated to measure the accuracy of predictions made with observations not included in the training process, while coping with the bias of random train-test splitting. Student’s t-test was applied to the 5-fold cross validation R2 results to check for difference in performance of the two models.
Feature contribution and importance scores
Individual conditional expectations (ICEs) are predictions (y axis) of each data when a feature (x axis) changes which can be expressed as a line per one instance (one student). The value for each line is calculated by keeping all other variables the same as the original data, but changing the value of one specific variable across a range and making predictions with the model. This visualizes the dependence of the predictions of a model on one specific independent variable. Partial dependence plot (PDP) is the average of all ICEs and represents the global effect of an independent variable on the predictions of a model.21 PDP and ICEs were yielded by training a model on the entire dataset and applying the PartialDependenceDisplay function from the scikit-learn package.
In order to quantify the contribution of each feature in a trained model, permutation importance scores were calculated using the permutation_importance function from the scikit-learn package. Briefly, after randomly shuffling a single feature, the model makes new predictions with the permuted dataset and determines the decrease in R2 value when compared with the predictions made with the original data. A larger reduction of performance indicates a higher importance of the feature. The random permutations were performed with 30 repeats.
Causal structure learning
With the aim to analyze the direction of effect between each questionnaire scores, the Non-combinatorial Optimization via Trace Exponential and Augmented lagRangian for Structure learning (NOTEARS) algorithm was applied to the standard z-scores of groups (coded as 0 for norm-based, 1 for criterion-referenced) and the 6 questionnaire scores, using the causalnex package (version 0.11.0). NOTEARS is a machine learning algorithm that learns a directed acyclic graph (DAG) which describes the conditional dependencies between multiple variables for the establishment of Bayesian Belief Network.22 Each node of the DAG represents a random variable, and the weight of each edge that directs from a parent node to a child node means that x standard deviation change in the parent variable causes x × weight standard deviation change in the child variable. The weight value represents the size of effect, not the robustness of directionality. As the NOTEARS algorithm allows knowledge-based user inputs to the graph, the authors applied constraints that Group cannot be a child node, and that QOL cannot be a parent node. These constraints are based on simple logical assumptions, such as questionnaire results cannot have a causal effect on the student’s method of academic assessment, and the QOL of a respondent is influenced by other factors but does not have causal effect on other aspects of a student. The absolute edge weight threshold value was set to 0.08.
Analytic tools and software
Data validation and preprocessing was performed with RStudio version 1.4 using R 4.1.2. Other analyses and data visualizations were performed on Google Colab platform using Python 3.6.9. Machine learning models were trained and analyzed using the scikit-learn package (version 1.0.2), and the MLR was performed using the statsmodels package (version 0.3.1). Spearman correlation and heatmap was produced using scipy (version 1.7.3) and seaborn (version 0.11.2) libraries.
RESULTS
Baseline characteristics
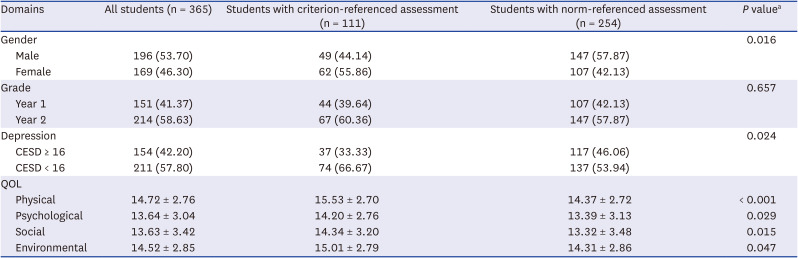
A total of 365 medical students agreed and participated in our survey. In the CRA group, 111 students participated in the survey and in the NRA group, 254 students participated. Eight responses were excluded because a respondent from the CRA group answered the NRA group questionnaire or the response was a duplicate. The response rate of CRA group students was 23.9% (111 responses from 465 students) and that of NRA group students was 16.3% (254 responses from 1,563 students). The result of the χ2 test in grade (1 and 2 year of preclerkship) was not significant (P = 0.657) while that in gender was significant (P = 0.016) (Table 1). There were no significant differences between male and female in rMEQ (10.90 ± 3.10, 10.93 ± 3.43, P = 0.863), PSQI (6.67 ± 2.66, 6.57 ± 2.60, P = 0.845), MSSIK (73.20 ± 12.58, 74.14 ± 12.59, P = 0.481), K-MBI-SS (54.04 ± 13.25, 52.97 ± 12.80, P = 0.252), CESD (15.01 ± 11.16, 15.69 ± 10.76, P = 0.364) and QOL (mean 91.88 ± 16.30, 91.10 ± 16.72, P = 0.652), hence further analysis was performed without weight adjustment. The correlation matrix between assessment group, gender, grade, 5 domains and QOL is provided in Supplementary Fig. 1.
Table 1
Comparison of gender, grade, depression, four QOL domains between the students with criterion-referenced assessment and the students with norm-referenced assessment
Comparison of CRA and NRA groups on QOL and the 5 related domains (sleep phase, sleep quality, stress, burnout and depression)
When comparing scores of QOL and its related factors among students, the CRA group showed higher QOL scores compared with the NRA group (95.79 ± 16.20, 89.65 ± 16.28, P < 0.001). MSSIK (stress scale, 68.16 ± 11.29, 76.03 ± 12.38, P < 0.001), K-MBISS (burnout scale, 48.09 ± 11.23, 55.93 ± 13.07, P < 0.001), and CESD (depression scale, 12.77 ± 9.82, 16.44 ± 11.27, P = 0.003) scores in CRA group were significantly lower than those in NRA group. There was no significant difference in rMEQ (sleep phase scale, 10.72 ± 3.62, 11.00 ± 3.08, P = 0.469) and PSQI (sleep quality scale, 6.41 ± 2.70, 6.72 ± 2.60, P = 0.287) scores between the two groups (Table 2).
Table 2
Average comparison between the score of QOL and five related factors in students with criterion-referenced assessment and students with norm-referenced assessment
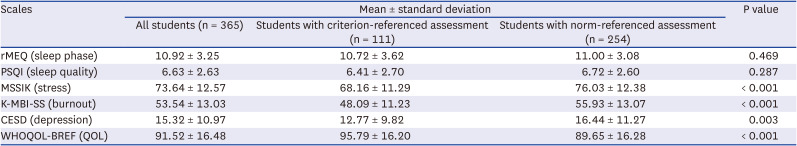
QOL = quality of life, rMEQ = reduced Morningness–Eveningness Questionnaire, PSQI = Pittsburgh Sleep Quality Index, MSSIK = Medical Student Stress Inventory in Korea, K-MBI-SS = Korean Maslach Burnout Inventory Student Survey, CESD = Center for Epidemiologic Studies Depression Scale, WHOQOL-BREF = quality of life assessment developed by the WHOQOL group.
As a result of comparing the QOL in four domains, scores of CRA group were significantly higher than those of NRA group in all domains including physical (15.53 ± 2.70, 14.37 ± 2.72), psychological (14.20 ± 2.76, 13.39 ± 3.13), social (14.34 ± 3.20, 13.32 ± 3.48), environmental (15.01 ± 2.79, 14.31 ± 2.86) QOL. Students with a CESD score of 16 or higher were more common in the NRA group among the two groups (42.20%, 33.33%, P = 0.024).
Correlations between 5 factors and QOL
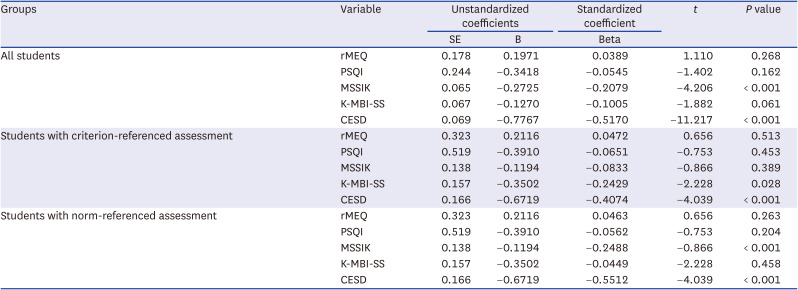
Results of a MLR between the 5 factors and QOL are shown in Table 3. When analyzed with all students, MSSIK and CESD showed a significant negative correlation (MSSIK: β = −0.2079, P < 0.001; CESD: β = −0.5170, P < 0.001) with the QOL score. K-MBI-SS also showed a negative correlation, but did not reach significance (P = 0.061). Sleep-related variables showed an insignificant correlation with the QOL score. In the CRA group, K-MBI-SS and CESD showed a significant negative correlation (K-MBI-SS: β = −0.2429, P = 0.028; CESD: β = −0.4074, P < 0.001) with the QOL score. In NRA group, MSSIK and CESD showed a significant negative correlation (MSSIK: β = −0.2488, P < 0.001; CESD: β = −0.5512, P < 0.001) with the QOL score, similar with the correlations observed when analyzed with all students (Table 3).
Table 3
Multiple linear regression in predicting quality of life among medical students with five factors
Comparison of the linear regression and machine learning model for predicting factors related to QOL
The three nonlinear models ANN, ADA and RF showed the highest R2 values among the 7 base models. After performing hyperparameter tuning with the 3 models, RF was selected as the final nonlinear model since it had the greatest R2 value (RF: 0.41 ± 0.10, ANN: 0.38 ± 0.09, ADA: 0.39 ± 0.09). The performance of the MLR model and RF model measured by R2 with 5-fold cross validation was not statistically different (0.44 ± 0.11, 0.41 ± 0.10, P = 0.621), indicating that MLR and RF had similar performances in predicting QOL scores.
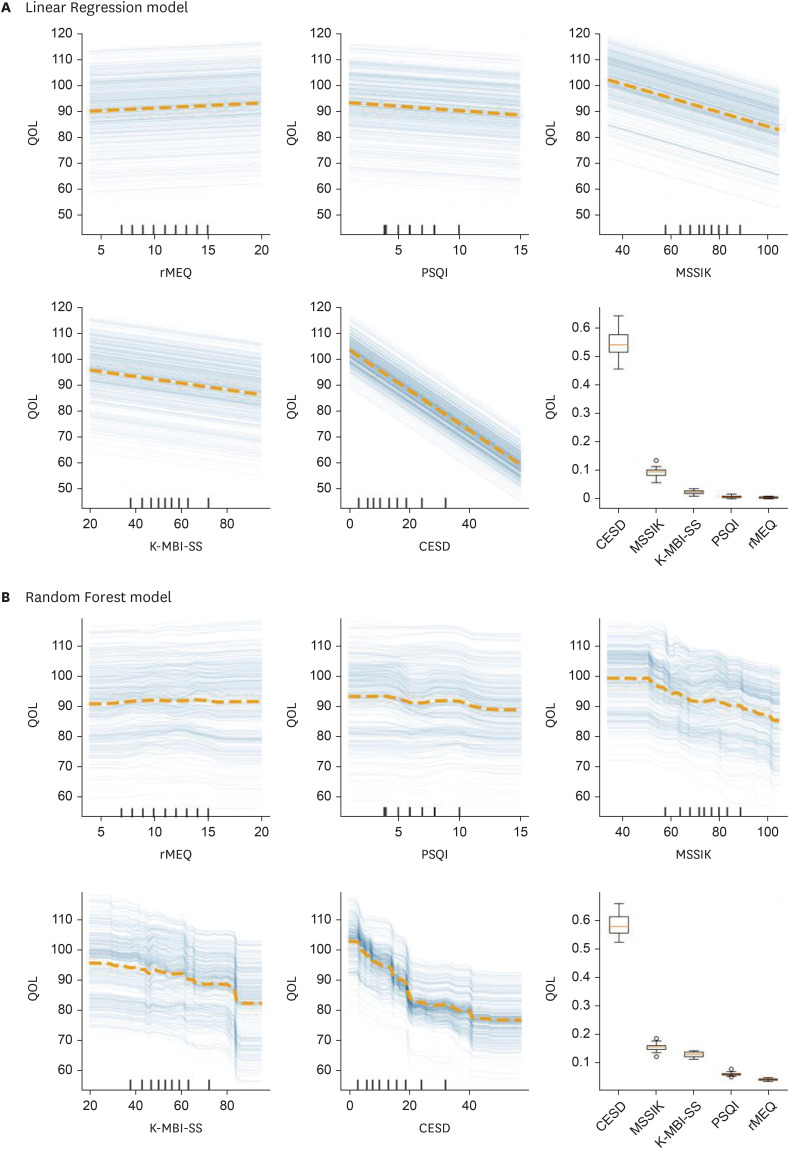
Depression (CESD, 0.541 ± 0.045 in logistic regression [LR], 0.583 ± 0.036 in RF), stress (MSSIK, 0.105 ± 0.017 in LR, 0.154 ± 0.012 in RF), and burnout (K-MBI-SS, 0.020 ± 0.006 in LR, 0.129 ± 0.009 in RF) displayed the highest permutation feature importance among the 5 factors. The permutation importance in depression was notably higher compared with the other factors in both models, suggesting depression to be the most important factor contributing to QOL scores (Fig. 1). In the PDP and ICEs of the RF model a nonlinear relationship was observed in CESD, while the remaining four factors showed similar patterns with the linear regression model. From CESD score 0 to 20, QOL decreased drastically as CESD scores increased. But from more than 20, QOL did not react as sensitively to the rise in CESD scores (Fig. 1B). In the case of the linear regression model the QOL scores steadily decreased across all value ranges of the CESD score (Fig. 1A), which is a typical result of a linear model.
Fig. 1
Partial dependence plots (dotted line) and individual conditional expectations (solid lines) in (A) linear regression model and (B) random forest model. Boxplots present the permutation importance of each independent variable.
QOL = quality of life, rMEQ = reduced Morningness–Eveningness Questionnaire, PSQI = Pittsburgh Sleep Quality Index, MSSIK = Medical Student Stress Inventory in Korea, K-MBI-SS = Korean Maslach Burnout Inventory Student Survey, CESD = Center for Epidemiologic Studies Depression Scale.
The causal structure model of QOL
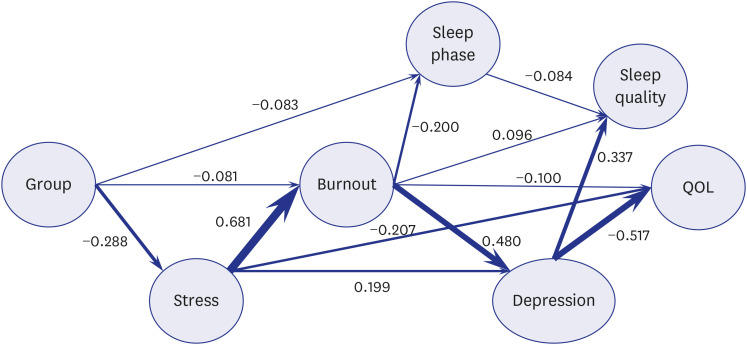
In the DAG depicting the causal structure between each feature, a change in the group node, which means transition from NRA to CRA was indicated to cause an evening type sleep phase (weight = −0.083), reduction of burnout (weight = −0.081) and stress (weight = −0.288) scores. Increases in stress scores were shown to raise the burnout (weight = 0.681) and depression scores (weight = 0.199), and also have a direct influence on reducing QOL scores (weight = −0.207). Higher burnout scores were illustrated to worsen sleep quality (weight = 0.096), depression (weight = 0.480) and directly lower QOL scores (weight = −0.100). Furthermore, escalation in depression scores was shown to deteriorate sleep quality (weight = 0.337) as well as QOL scores (weight = −0.517). To recapitulate, stress, burnout and depression had direct effects on QOL, and the indirect effect of assessment type was propagated mainly through stress, burnout, depression and eventually to QOL (Fig. 2). The factors that have the highest Spearman correlation coefficients with group were stress (r = −0.295, P < 0.001) and burnout (r = −0.290, P < 0.001), which had direct connections in the model (Supplementary Fig. 1). Adding gender and grade features to the model showed minimal change of the DAG structure, suggesting the robustness of the proposed model (Supplementary Fig. 2).
Fig. 2
Directed acyclic graph depicting causal structure network between group, five factors and QOL. Group is a variable that divides participants into two groups by the grading system (criterion-referenced assessment, norm-referenced assessment). Numbers on each edge indicate the weight value of the causal relationship.
QOL = quality of life.
DISCUSSION
Our study suggests that CRA could improve the QOL of medical students. Interestingly, the CRA group showed higher scores of QOL and lower scores of stress, burnout and depression compared with the NRA group. In this study, MLR and machine learning were utilized for a comprehensive evaluation of multiple domains that are related to QOL. MLR and the RF model results showed that stress, burnout and depression scores had a negative correlation with QOL scores, and the causal structure learned from the data also implied that stress, burnout and depression were the factors that had direct causal relationship with QOL.
To the authors best knowledge, this is the first multi-centered study to compare the QOLs of Korean medical students between schools that adapt CRA and NRA. The results that NRA students have higher stress, burnout, depression as well as lower QOL were similar to the previous studies that revealed that students in schools using pass/fail grading had less stress, burnout, depersonalization and anxiety compared with students in schools using 3 or more grades.12 In terms of depression, there was a noticeable difference in CESD scores between two groups. The average CESD score of the NRA group was 16.44 ± 11.27 and the portion of students with a score of 16 or higher was 46.1%, which is substantially higher than the global prevalence of depression in medical students from a meta-analysis by Puthran et al. (28.0%)23 and a previous result that surveyed Korean medical students in their preclerkship school years by Jeong et al. (14.1 ± 8.6).24 Albeit the coronavirus disease 2019 (COVID-19) pandemic situation may invalidate direct comparisons with preceding reports, these results suggest that a substantial proportion of medical students in this group may need assessment and interventions regarding depression.
In the causal structure model, stress, burnout and depression were the factors that directly affected QOL. These results are similar with previous studies showing that high levels of stress, burnout, and depression are associated with poor QOL.2526272829 Another noteworthy point in the causal structure model is the sequence of effects, which was in the order of stress, burnout, depression and QOL. Stress was proposed as a precursor of worse burnout in medical students in previous studies, which is in line with these results.3031 Burnout had the smallest direct effect on QOL, but had a large effect on depression, which may be the mechanistic explanation of how burnout plays a large role in determining QOL. These results are also in consonance with the multiple reports that demonstrate that depression is the most influential estimator of poor QOL in Koreans.283233
Sleep phase and sleep quality were not significantly different between two groups, and the multiple regression results concluded the effects to be insignificant. The causal structure learning results also did not show a direct causal relationship between the 2 sleep related variables and QOL. Both groups showed on average an evening type sleep phase and low sleep quality. This is similar to the results of a previous study and is also related to the behavior of Korean medical students which tend to study late at night.834
In an earlier study, the subjective amplitude of circadian rhythm was a more influential factor to QOL, compared with the sleep phase.35 This may suggest that sensitivity to natural environmental synchronizers is a separate individual trait shaping the medical students’ tendency to energy and mood changes, which may be related to worse QOL. However, rMEQ was developed to measure the sleep phase from circadian rhythm, not the subjective amplitude of circadian rhythm. Therefore, the sleep phase scores gauged by rMEQ may not have been an influential factor to QOL in our study.
In the case of PSQI, a possible explanation is that medical students may sleep less or adjust their sleep schedule in order to study more and be rewarded with better test results, or attend extracurricular activities which can in turn increase QOL.36 Another explanation is that there is an overlap of questions between PSQI and CESD questionnaires, thus PSQI may partially reflect the negative cognitive viewpoints and pessimistic thinking in lieu of enclosing objectively observed aspects of sleep.37
To capture nonlinear correlations between QOL and the five factors, a RF model was compared with a classical MLR model. Although the RF model did not have significant difference in predictive performance and permutation importance scores showed a similar pattern with the MLR model, a nonlinear relationship was observed between depression and QOL. The steep decline in QOL in the range of low CESD scores (Fig. 1B) suggests that active interventions to lower medical students’ depression, even in the case where the student does not satisfy conventional cutoffs, may be effective in improving the QOL.
A causal structure learning method was also employed to help better explain the correlations observed in a cross-sectional study in the scope of direction of effects. The causal model offers a method to represent the network of variables in an intuitive way and also provides means to simulate an intervention in the network using the “do” operator.38 The learned graph model does not verify the causal effects but provides a putative model that best explains the provided cross-sectional data. In the DAG, the effect of difference in assessment methods on QOL was explained as an indirect effect transmitted through stress, burnout and depression. These 3 factors were significantly different between the groups and also had the largest beta coefficients in the MLR analysis. In contrast, sleep phase and sleep quality were mainly affected by burnout and depression but did not influence other factors. These results provide a comprehensive explanation of the effects of academic assessment methods and the 5 factors on QOL in a logically reasonable way.
This study had several limitations. Firstly, among the 2,018 medical students that were invited, only 365 of the students responded. The low response rate (18.0%) indicates that a selection bias may be in play, where students with a certain trait may have tended to respond more or less to the survey. However, this response rate was comparable to similar studies conducted on medical students (Morgan et al.39: 12.5%, Cecil et al.40: 13.0%), and to the authors best knowledge, this was the largest comparative study inspecting the QOL and related factors in Korean medical students. Next, the performance of the MLR and nonlinear machine learning model were not satisfactorily achieved (R2 = 0.44, 0.41). This may be due to failure to include other confounding factors that affect QOL. Lastly, since this study was conducted as a cross-sectional survey during the second year of the COVID-19 pandemic, the results may have been heavily affected by the changes in methods of learning and general daily lives.41 Nonetheless, under the circumstances of continuous emergence of new severe acute respiratory syndrome coronavirus 2 variants, the transformations in learning and daily lives may not be temporary and data captured during the pandemic may have its significance.
In conclusion, CRA may improve the QOL of medical students compared with NRA through reducing depression, stress and burnout. Among the 5 factors (sleep phase, sleep quality, stress, burnout, and depression) related to QOL, depression was the most significantly associated factor with lower QOL in medical students. Schools need to be more proactive in managing students' depression, stress, and burnout, and also consider shifting from NRA to CRA for the improvement of QOL of medical students.
 XML Download