

 PDF
PDF Citation
 Print
Print


INTRODUCTION
The global pandemic of coronavirus disease 2019 (COVID-19) caused by severe acute respiratory syndrome coronavirus 2 (SARS-CoV-2) has been ongoing for almost three years, resulting in tremendous numbers of infections. However, for infectors, recovering from the acute disease is not the end, many of them experience ongoing symptoms. As reported by previous follow-up studies of COVID-19,123 a portion of recovered patients (RPs) continue to complain of a multitude of symptoms for months, and these post COVID-19 symptoms can lead to long-term effects on the quality of life and mental health of RPs, which we call long COVID-19.456 However, how long and why the symptoms persist in long COVID-19 patients are largely unclear.
The gut microbiota which has been widely known to regulate immunity and inflammation has a profound impact on human health and disease.78 Microbiota dysbiosis may be involved in pathogenesis and lead to susceptibility to some diseases.7 Several studies have reported gut microbiota alteration in acute and early recovery stage patients with COVID-19.91011 Our previous studies also demonstrated gut microbiota dysbiosis including the increase of opportunistic pathogens and loss of commensal bacteria that was correlated with the symptoms of acute stage and convalescent stage at three-month after discharge.1213 To investigate whether it returns to normal at one-year after discharge and how it acts on long COVID-19, in this study, we enrolled a large number of RPs with different disease severities in the acute phase and did a comprehensive evaluation of the potential effect of gut microbiota on long COVID-19 at one-year after discharge through a series of tests including symptoms, health status and psychiatric questionnaires, laboratory tests, pulmonary function tests (PFTs), chest computed tomography (CT), 6-minute walk tests (6MWT) and 16S rRNA sequencing of stool samples from RPs and healthy controls (HCs).
METHODS
Study design and participants
In this prospective observational follow-up study, we included RPs with COVID-19 at one-year ± one month after discharge from Wuhan Union Hospital, China, between December 2020 and May 2021. In the early stage of the pandemic outbreak, Wuhan Union hospital was designated as the first-line therapy hospital, and the patients hospitalized all had discomfort symptoms and CT abnormalities, so there were no mild patients according to the classification of disease severity of World Health Organization COVID-19 guidelines.14 Study inclusion and exclusion criteria were described in our previous study.1215 The SARS-CoV-2 strain which infected our patients was originally found in the early stage of the pandemic outbreak in Wuhan, Hubei, China, and we had sequenced full genomes of the virus which we showed in our previous article published in European Respiratory Journal.16 Additionally, all patients were unvaccinated.
Evaluation of conditions of RPs at one-year after discharge
RPs were interviewed with symptom questionnaires, 36-Item Short Form General Health Survey (SF-36), Self-Rating Anxiety Scale (SAS), and Self-Rating Depression Scale (SDS), and underwent laboratory tests including complete blood counts, blood biochemistry, C-reactive protein (CRP), lymphocyte subset counts, and serum immunoglobulin (Ig) M and IgG antibodies, PFTs, chest CT scans, and 6MWT. The specific assessment methods of clinical parameters were displayed in Supplementary Data 1.
Stool samples collection and 16s rRNA sequencing
Fecal samples were collected from RPs and age-, sex-, body mass index (BMI)-, and comorbidities-matched HCs. Under the strict epidemic prevention and control measures in China including timely closure of cities, nationwide nucleic acid and IgM/IgG antibodies tests for SARS-CoV-2, combined with examination of epidemiological histories and symptoms, all residents in Wuhan were screened for infection. Subjects with no epidemiological histories, negative SARS-CoV-2 nucleic acid and IgM/IgG antibodies were defined to be non-COVID-19 subjects, and HCs of our study were all non-COVID-19 subjects. Besides, the enrolled RPs and HCs were all residents of Wuhan city, and subjects who received antibiotics, probiotics, or both within 12 weeks before enrollment were excluded from collecting stool samples. Stool specimens (5–10 g) were collected in standard sterile sample pots with an integral spoon after defecation, and were processed in the laboratory within 30 minutes after collection and stored at −80°C until analysis. Detailed 16s rRNA sequencing process was displayed in Supplementary Data 1.
Statistical analysis
Continuous variables were expressed as median (interquartile range) and compared using independent t-test, Mann-Whitney U test, one-way analysis of variance, or Kruskal-Wallis test when appropriate; categorical variables were expressed as number (%) and compared using χ2 test or Fisher’s exact test when appropriate. For correlation analysis, Spearman rank test was performed. Statistical analysis was performed using SPSS version 25.0 (IBM Corp., Armonk, NY, USA). A two-sided P value of < 0.05 was considered statistically significant.
RESULTS
Demographics and clinical characteristics
One hundred eighty-seven RPs were recruited in our study (a detailed flowchart was presented in Supplementary Fig. 1). There were 91 (48.7%) men and the median age was 58.00 (48.00–66.00) years.
The common comorbidities were hypertension (34.8%), followed by chronic pulmonary diseases (18.2%), chronic digestive system diseases (18.2%), hyperlipidemia (16.0%) and diabetes (14.4%). There were 105 (56.1%) moderate, 62 (33.2%) severe, and 20 (10.7%) critical patients. During hospitalization, 3.7% RPs were admitted to intensive care unit, 78.6% RPs were given antibiotic therapy, and the median hospital stay days were 27.00 (18.00–39.00) days.
Long-term symptoms, physical and psychiatric functions, laboratory findings, lung functions and lung CT of RPs at one-year after discharge
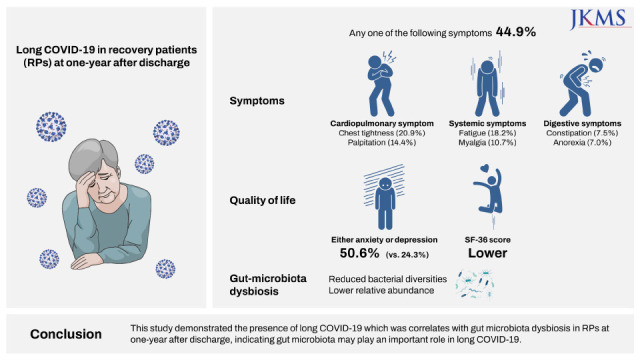
At one-year after discharge, 84 (44.9%) RPs reported one or more long COVID-19 symptoms. The most common long-term symptoms were cardiopulmonary symptoms, including chest tightness after activity (39/187, 20.9%), palpitations on exercise (27/187, 14.4%), sputum (21/187, 11.2%), cough (15/187, 8.0%) and chest pain (13/187, 7.0%), followed by systemic symptoms including fatigue (34/187, 18.2%) and myalgia (20/187, 10.7%), and digestive symptoms including constipation (14/187, 7.5%), anorexia (13/187, 7.0%), and diarrhea (8/187, 4.3%) (Table 1). There were no differences between the symptomatic group and the asymptomatic group in terms of sex, age, BMI, comorbidities, and diseases severity in acute infection stage (Table 1). 66 (35.9%) RPs presented either anxiety or depression (42/187 [22.8%] and 53/187 [28.8%], respectively), and the proportion of anxiety or depression in the symptomatic group was significantly higher than that in the asymptomatic group (41/187 [50.6%] vs. 25/187 [24.3%], P < 0.001). Scores of all the SF-36 domains except for the role-emotional domain of RPs were lower than the norm, especially that of general health and healthy transition domains, and the scores of all domains in the symptomatic group were lower compared to the asymptomatic group (all P < 0.05). The medians of all the laboratory findings including lymphocyte subset counts of RPs were within the normal range at one-year after discharge, while in the symptomatic group, the medians of CD3+ T cells and CD4+ T cells were lower than that in the asymptomatic group (Table 2). The 99.4% RPs had positive SARS-CoV-2 IgG antibodies at one-year after discharge, while 11.8% still had positive SARS-CoV-2 IgM (Supplementary Table 1). One hundred seventy-eight participants finished PFTs. Most patients had anomalies of diffusion capacity, with a reduced carbon monoxide diffusing capacity (DLCO)%pred in 43.2% RPs. Forced expiratory volume in 1 second (FEV1)%pred, forced vital capacity (FVC)%pred, FEV1/FVC%pred, vital capacity (VC)%pred, total lung capacity (TLC)%pred, residual volume (RV)%pred, and functional residual capacity (FRC)%pred were not within normal ranges in 9.6%, 4.5%, 16.3%, 5.6%, 19.5%, 39.6% and 30.2% RPs, respectively. However, there were no significant differences in all parameters of lung functions between the symptomatic group and the asymptomatic group. The median of 6-minute walk distance (6MWD) of RPs was 477.00 (434.25–537.00) m with no statistical difference between the symptomatic group and the asymptomatic group. 185 subjects completed lung CT. The proportions of normal, ground-glass opacity (GGO), fibrosis and GGO + fibrosis were 48.1%, 12.4%, 19.5%, and 20.0% respectively, and the median of CT score was 1.00 (0.00–6.00). The symptomatic group and the asymptomatic group had similar CT image proportions and CT scores (Supplementary Table 2).
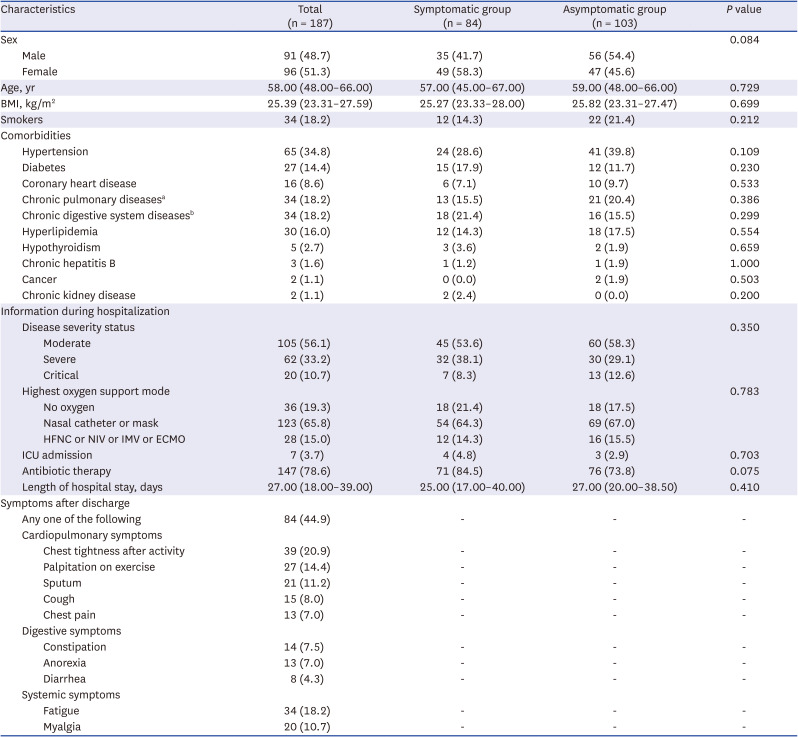
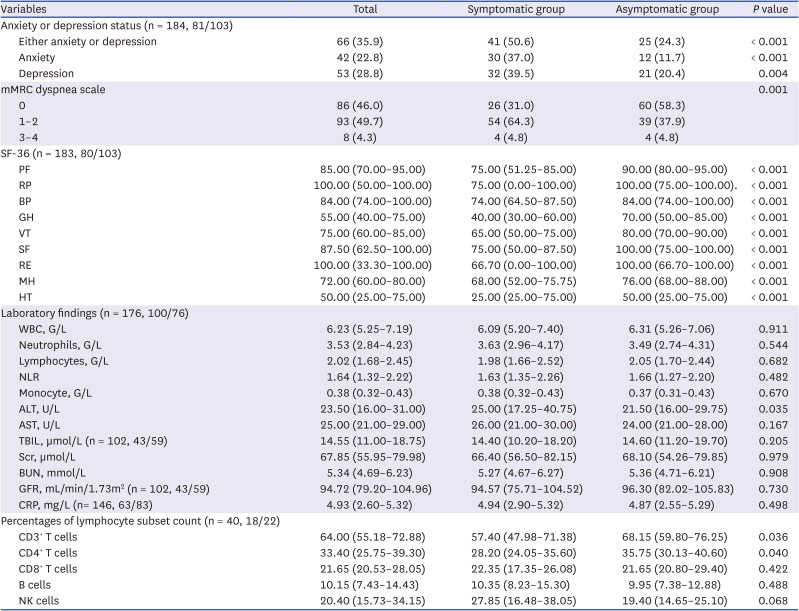
Table 1
Demographics and clinical characteristics of RPs at one-year after discharge
Data are given as median (interquartile range) or number (%).
RPs = recovered patients, BMI = body mass index, HFNC = high-flow nasal cannula for oxygen therapy, NIV = non-invasive ventilation, IMV = invasive mechanical ventilation, ECMO = extracorporeal membrane oxygenation, ICU = intensive care unit.
aChronic pulmonary diseases include chronic bronchitis, emphysema, chronic obstructive pulmonary disease, tuberculosis, and bronchiectasis, etc.
bChronic digestive system diseases include chronic gastritis and chronic ulcer, etc.
![]()
Table 2
Anxiety or depression, SF-36, and laboratory findings of RPs at one-year after discharge
Data are given as median (interquartile range) or number (%).
SF-36 = 36-Item Short Form General Health Survey, RPs = recovered patients, COVID-19 = coronavirus disease 2019, mMRC dyspnea scale = modified medical research council dyspnea scale, PF = physical functioning, BP = bodily pain, RP = role physical, GH = general health, VT = vitality, SF = social functioning, RE = role-emotional, MH = mental health, HT = healthy transition, WBC = white blood cells, NLR = neutrophil/lymphocyte ratio, ALT = alanine aminotransferase, AST = aspartate aminotransferase, TBIL = total bilirubin, Scr = serum creatinine, BUN = blood urea nitrogen, GFR = glomerular filtration rate, CRP = C-reactive protein, NK = natural killer.
![]()
Correlations between long COVID-19 symptoms and laboratory findings, lung functions, total CT scores as well as 6MWD
The white blood cells and neutrophils were positively correlated with diarrhea (R = 0.205, P = 0.006; R = 0.183, P = 0.015). The lymphocytes were negatively correlated with palpitation (R = −0.158, P = 0.036) and fatigue (R = −0.194, P = 0.010). Alanine aminotransferase (ALT) was positively correlated with palpitation (R = 0.174, P = 0.021). Total bilirubin (TBIL) was negatively correlated with constipation (R = −0.200, P = 0.030). CRP was positively correlated with chest tightness (R = 0.217, P = 0.008), chest pain (R = 0.163, P = 0.049) and myalgia (R = 0.247, P = 0.003). CD3+ T cells and CD4+ T cells were negatively correlated with “any symptoms” (R = 0.335, P = 0.034; R = 0.329, P = 0.038). CD8+ T cells were negatively correlated with palpitation (R = −0.341, P = 0.031). FEV1%pred was negatively correlated with sputum (R = −0.153, P = 0.042). DLCO%pred was negatively correlated with chest tightness (R = −0.218, P = 0.004), palpitation (R = −0.188, P = 0.015), anorexia (R = −0.196, P = 0.011), and fatigue (R = −0.262, P = 0.001). TLC%pred was negatively correlated with chest tightness (R = −0.152, P = 0.049), chest pain (R = −0.176, P = 0.022), anorexia (R = -0.229, P = 0.003), fatigue (R = −0.178, P = 0.020) and myalgia (R = −0.178, P = 0.021). 6MWD was negatively correlated with myalgia (R = −0.210, P = 0.006). Correlations analysis results are shown in Fig. 1 and Supplementary Table 3.
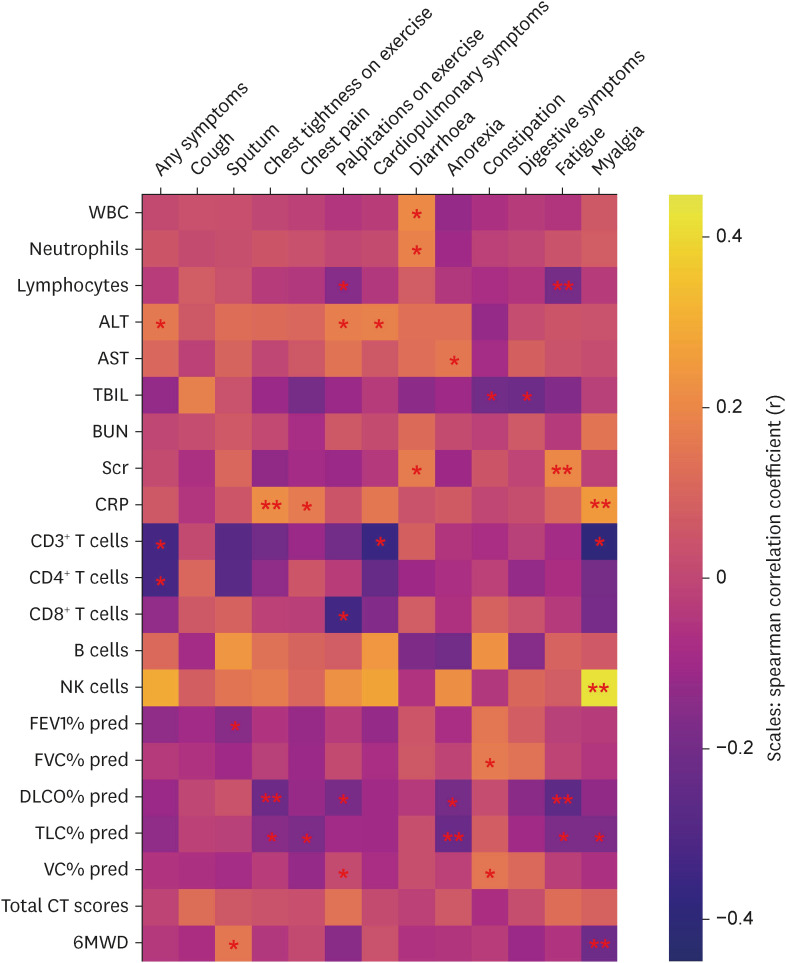
Fig. 1
Correlations between long-term symptoms and laboratory findings, lung functions, total CT scores as well as 6MWD of RPs with COVID-19 at one-year after discharge. Spearman correlation coefficient is indicated using a color gradient: yellow indicates positive correlation; purple indicates negative correlation.
CT = computed tomography, 6MWD = 6-minute walk distance, RPs = recovered patients, COVID-19 = coronavirus disease 2019, WBC = white blood cells, ALT = alanine aminotransferase, AST = aspartate aminotransferase, TBIL = total bilirubin, BUN = blood urea nitrogen, Scr = serum creatinine, CRP = C-reactive protein, NK = natural killer, FEV1 = forced expiratory volume in 1 second, FVC = forced vital capacity, DLCO = carbon monoxide diffusing capacity, TLC = total lung capacity, VC = vital capacity.
*P < 0.05, **P < 0.01.
![]()
Gut microbiota composition and alteration among the symptomatic group, the asymptomatic group of RPs and HCs
Fifty-five symptomatic RPs, 75 asymptomatic RPs, and 32 age, sex, BMI and comorbidities matched HCs performed gut microbiota analysis (Table 3). After merging and filtering, 8,023,050 high-quality sequences were acquired from 165 fecal samples by 16s rRNA sequencing with an average sequence number of 49,524 per sample. As estimated by the Sobs and Shannon index, the community richness and diversity of gut microbiota in the symptomatic RPs were significant decreased than that in HCs (P = 0.002 and P = 0.003, respectively) with increasing tendencies between the symptomatic group, the asymptomatic group, and HCs (Fig. 2A and B). The number of operational taxonomic units (OTUs) in the symptomatic group, the asymptomatic group, and HCs were 881, 943, and 855 respectively, and 638 OTUs overlapped among the three groups (Fig. 2C). Principal coordinate analysis (PCoA) of Bray-Curtis distances was performed to display microbiome space between samples, and the result showed that there were significant differences in gut microbial communities among the three groups (P = 0.005), especially between the symptomatic group and HCs (P = 0.004) (Fig. 2D). To investigate changes in the gut microbiota of RPs, we subsequently assessed relative abundance at the phylum, class, family, and genus levels. At the phylum level, Firmicutes, Actinobacteriota, Proteobacteria, and Bacteroidota were the most dominant phyla in all three groups. Firmicutes was less abundant, but Actinobacteriota and Proteobacteria were more abundant in the symptomatic RPs compared to HCs although the differences were not significant (Fig. 3A). At the class level, the relative abundance of Clostridia and Coriobacteriia were significantly decreased in the symptomatic group of RPs than HCs (P = 0.008 and P = 0.002, respectively), while Bacilli, Actinobacteria, and Gammaproteobacteria were enriched in the symptomatic group than HCs although significant differences were not detected (Fig. 3B). In the class Clostridia of the phylum Firmicutes, seven genera including Eubacterium_hallii_group, Agathobacter, Subdoligranulum belonging to Oscillospiraceae family, Ruminococcus belonging to Ruminococcaceae family, Dorea, Coprococcus, and Eubacterium_ventriosum_group, which were almost short-chain fatty acids (SCFAs)-producing symbionts, significantly depleted in the symptomatic group than HCs, and the relative abundance of Eubacterium_hallii_group, Subdoligranulum, and Ruminococcus showed decreasing tendencies between HCs, the asymptomatic group, and the symptomatic group. In the class Bacilli of the phylum Firmicutes, Veillonella genus belonging to Veillonellaceae family was enriched in the symptomatic RPs (Fig. 4A and B).
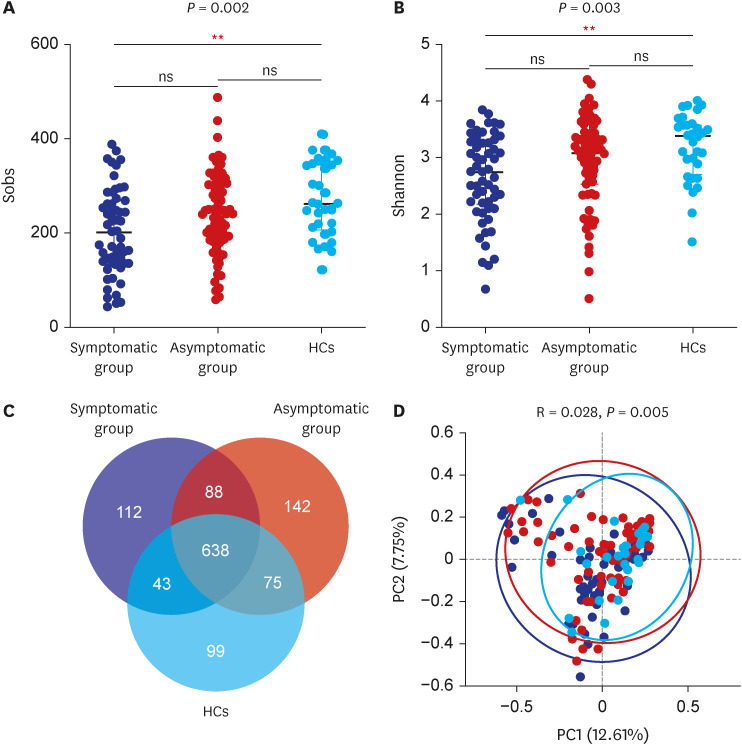
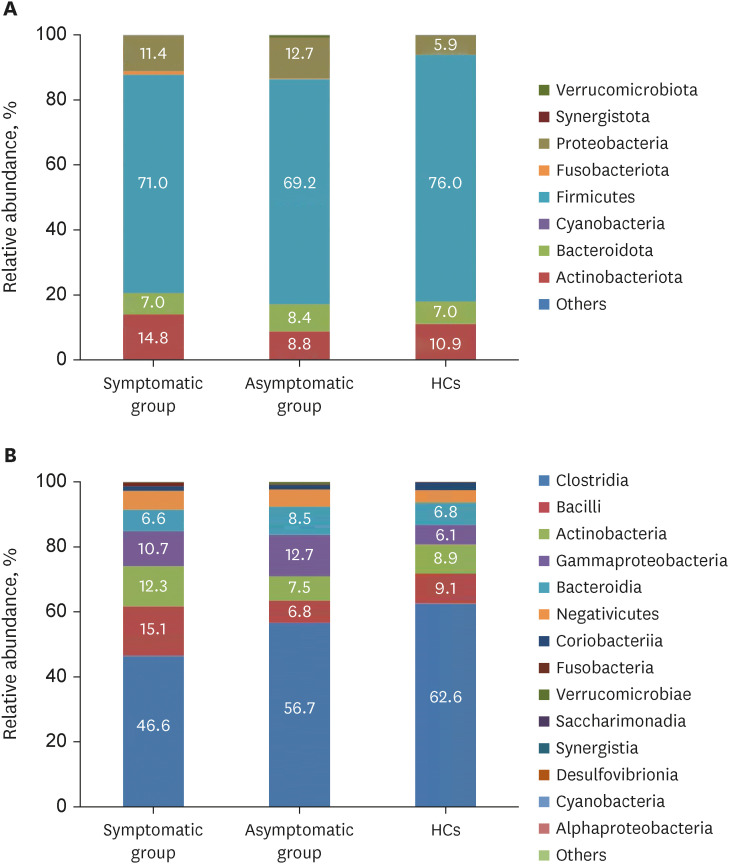
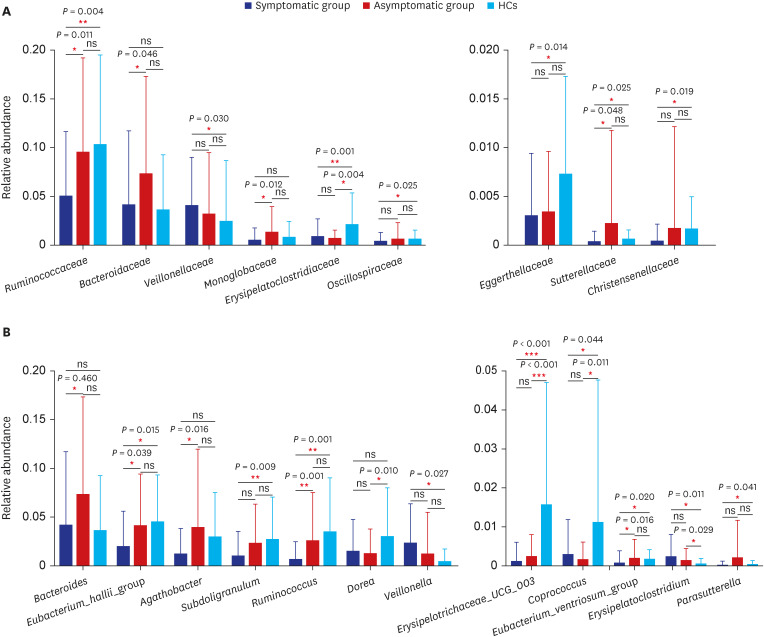
Fig. 2
Differences of alpha diversity (A, B), Venn diagram of OTUs (C) and beta diversity (D) in symptomatic RPs, asymptomatic RPs, and HCs. P value < 0.05 is considered to be statistically significant.
RPs = recovered patients, HCs = healthy controls, OTU = operational taxonomic unit.
**P < 0.01.
![]()
Fig. 3
The relative abundance of gut microbiota at the phylum (A) and class (B) levels in symptomatic RPs, asymptomatic RPs, and HCs. The category “Other” covers all other phyla or classes with a low taxa abundance.
RPs = recovered patients, HCs = healthy controls.
![]()
Fig. 4
Taxonomic differences of gut microbiota between symptomatic RPs, asymptomatic RPs, and HCs at family (A) and genus (B) levels. Bars indicate mean ± standard deviation. P value < 0.05 is considered to be statistically significant.
RPs = recovered patients, HCs = healthy controls.
*P < 0.05, **P < 0.01, ***P < 0.001.
![]()
Table 3
Characteristics of matched RPs and HCs of whom the stool samples performed gut microbiota analysis
Data are given as number (%) or median (interquartile range).
RPs = recovered patients, HCs = healthy controls, BMI = body mass index.
aChronic pulmonary diseases include chronic bronchitis, emphysema, COPD, tuberculosis, and bronchiectasis, etc.
bChronic digestive system diseases include chronic gastritis and chronic ulcer, etc.
![]()
Correlations between altered gut microbiota and laboratory findings
We found that the relative abundance of Eubacterium_hallii_group was positively correlated with lymphocytes (R = 0.224, P = 0.006), Agathobacter was positively correlated with TBIL (R = 0.210, P = 0.048), and negatively correlated with CRP (R = −0.238, P = 0.008). Subdoligranulum was positively correlated with lymphocytes (R = 0.169, P = 0.040), TBIL (R = 0.219, P = 0.039), and B cells (R = 0.357, P = 0.036). Ruminococcus was positively correlated with lymphocytes (R = 0.202, P = 0.014), and negatively correlated with CRP (R = −0.215, P = 0.017) and natural killer (NK) cells (R = −0.348, P = 0.040). Dorea was negatively correlated with neutrophils (R = −0.188, P = 0.022). Eubacterium_ventriosum_group was positively correlated with lymphocytes (R = 0.207, P = 0.012), and negatively correlated with ALT (R = −0.182, P = 0.027) and NK cells (R = −0.411, P = 0.014). Erysipelatoclostridium was positively correlated with CRP (R = 0.259, P = 0.004). Veillonella was negatively correlated with lymphocytes (R = −0.184, P = 0.025) (Fig. 5, Supplementary Table 4).
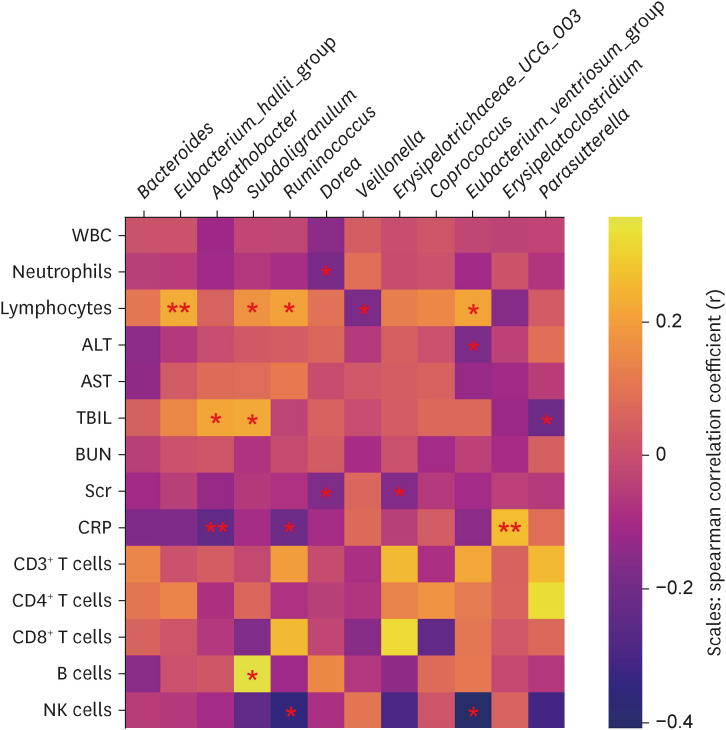
Fig. 5
Correlation analysis of altered gut bacteria and laboratory findings. Spearman correlation coefficient is indicated using a color gradient: yellow indicates positive correlation; purple indicates negative correlation.
WBC = white blood cell, ALT = alanine aminotransferase, AST = aspartate aminotransferase, TBIL = total bilirubin, BUN = blood urea nitrogen, Scr = serum creatinine, CRP = C-reactive protein, NK = natural killer.
*P < 0.05, **P < 0.01.
![]()
DISCUSSION
In this work, we evaluated the long-term symptoms and clinical indices of RPs at one-year after discharge and compared the differences between RPs with long-term symptoms and those without. Simultaneously, we explored the differences in the gut microbiota between the symptomatic RPs and the asymptomatic RPs, as well as HCs, and analyzed the associations of altered gut microbiota with clinical parameters. We found that long-term symptoms, physical function impairment, psychiatric disorders, lung functions reduction, and radiographic abnormalities persisted to 12 months in a proportion of individuals. The differences between the symptomatic RPs and asymptomatic RPs were mainly in anxiety or depression, SF-36 domains and CD3+ T cells and CD4+ T cells. The gut microbiota of RPs still did not restore at one-year after discharge, mainly manifested as lower bacterial diversity and significantly reduced SCFAs-producing symbionts, especially in the symptomatic group, and altered gut microbiota was significantly correlated with clinical indices of the recovery stage.
In our study, the participants enrolled were inpatients with relatively serious conditions at acute phase during the early stage of the pandemic. According to our results, 44.9% RPs still had one or more symptoms including chest tightness after activity, chronic fatigue, palpitation on exercise, sputum, myalgia, and so on at one-year after discharge, and many of the symptoms tended to become chronic which reduced quality of daily life and had a psychological impact on RPs. The largest follow-up study of COVID-19 published in the Lancet suggested that 4.5% and 10.8% of people, who were infected with delta and omicron variants respectively, experienced long COVID-19,17 but our patients were infected with the earliest SARS-CoV-2 which was more virulent and with relatively serious conditions in acute stage, thus, there were more patients experiencing long COVID-19 in our study. We found that there was persistent impairment of the health-related quality of life of RPs and 35.9% RPs were assessed as having anxiety or depression. The results were similar with previous follow-up research on SARS that reported decreased health-related quality of life and reduced mental health at one-year discharge.181920 A study of SARS had observed that even after 2–4 years of discharge, over 39% of the respondents had depression issues, 40.3% had chronic fatigue problems, and 27.1% met the modified 1994 Centers for Disease Control and Prevention criteria for chronic fatigue syndrome.21 These results indicate that long COVID-19 deserves constant attention.
We explored the composition and alteration of gut microbiota in RPs with long-term symptoms and those without, as well as HCs. The results suggested that RPs, especially the symptomatic group, had lower bacterial diversity, and depleted SCFAs-producing symbiotes than HCs. Gu et al.22 found that acutely infected COVID-19 patients had significantly reduced bacterial diversity, and the abundance of the Ruminococcaceae family and several genera from the Lachnospiraceae family (such as Agathobacter, unclassified Lachnospiraceae, and Eubacterium_hallii_group) was dramatically reduced compared with HCs. Zuo et al.23 showed that Eubacterium rectale, Ruminococcus obeum, and Dorea formicigenerans were significantly depleted in COVID-19 patients. These data were consistent with our results, but Gu et al. also suggested that COVID-19 patients had an increased relative abundance of opportunistic pathogens, including Streptococcus, Rothia, Veillonella, Erysipelatoclostridium, and Actinomyces.22 Our previous work also indicated an increase in opportunistic pathogens and inflammation-related pathogens, including Escherichia, Intestinibacter, Clostridium, and Flavonifractor in RPs at three-month after discharge.12 However, in this study, we only found Veillonella was enriched in RPs, and the enrichment of other opportunistic pathogens was not presented in our data, indicating the relative abundance of these taxa gradually reduced or returned to normal at a long-term time after discharge.
In fact, we had also analyzed the gut microbiota of healthcare workers with COVID-19 in the acute phase and three-month discharge, and the results had been issued in other journals.1213 Results showed that the alpha diversities were all lower, and the relative abundance of beneficial commensals mainly SCFAs-producing strains were decreased compared with HCs, which were consistent with the results in this study. However, due to the strict prevention and control of the epidemic situation and policies, we were unable to collect stool samples from a large number of relatively severe patients during the acute phase. In this study, we enrolled patients with different disease severities in the acute phase, and the number of subjects was larger, so it was more representative. Our work indicated that the gut microbiota dysbiosis persisted even at one-year after discharge.
The gut microbiota is vital for the development of the human immune system and homeostasis, and it has a profound impact on human health and disease.2425 A healthy intestinal microbiota maintains homeostatic immune responses through the exposure of structural ligands (for example, lipopolysaccharide or peptidoglycan) and secreted metabolites (for example, SCFAs). Dysbiosis of the gut microbiota can cause systemic inflammation and an outgrowth of opportunistic pathogens, which can lead to chronic inflammation at distal sites. The gut microbiota can implicate in the pathogenesis of lung injury via several potential mechanisms, including direct translocation of bacteria from the gut to the lung, immune modulation effects of microbes-related metabolites, and so on, which we call the link as gut-lung axis.72627 Although COVID-19 mainly involves the lungs, the gut microbiota may play an important role in the rehabilitation process through the gut-lung axis. In addition, a lot of investigations have reported gut microbiota dysbiosis in subjects with mental disorders including anxiety and depression,2829 and our results showed that the symptomatic RPs had increased proportions of anxiety or depression which indicated the gut microbiota may have an influence on anxiety or depression of long COVID-19 patients through the gut-brain axis.30
In our study, the SCFAs-producing salutary commensal bacteria were dramatically reduced in RPs, including Eubacterium_hallii_group, Subdoligranulum, Ruminococcus, Dorea, Coprococcus, and Eubacterium_ventriosum_group.31323334 SCFAs, as paramount microbiota metabolites of the intestine lumen, play an important role in the modulation of the immune system not only for the intestine but also for distal sites or organs,3536 including influencing pulmonary diseases or psychiatric illness through the gut-lung axis or gut-brain axis. Many studies have demonstrated that SCFAs are involved in the lung inflammation of influenza, bacterial pneumonia, chronic obstructive pulmonary disease, and asthma.3738394041 It was reported that SCFAs enhanced antiviral CD8+ T-cells and macrophages to protect against respiratory infection.42434445 Tian et al.39 demonstrated that increased production of propionate is associated with reduced lung inflammation through animal experiments. In addition, one study suggested that propionate can attenuate the lipopolysaccharide-induced epithelial-mesenchymal transition and even fibrosis.46 There were also studies reported that SCFAs especially butyrate in the central nervous system can affect the function of hippocampus and promote the expression of brain-derived neurotrophic factor, which has been shown to have antidepressant-like effects in animal models.4748 Taken together, we posit that significantly reduced levels of SCFAs and SCFAs-producing commensal bacteria may delay rehabilitation of pulmonary and psychiatric symptoms and cause long COVID-19.
Our study has several limitations. First, this was a single-center study, but the number of participants was enough and the sample quality was high. To our knowledge, our study has the largest number of participants and was the first study investigating the gut microbiota of RPs with COVID-19 at one-year after discharge. Second, this was a cross-sectional study. We did not conduct dynamic monitoring of RPs. Next, we will continue paying attention to the convalescence and gut microbiota of COVID-19 RPs for a longer time. Third, lifestyle and diet may affect gut microbiota, and we did not have detailed information on them, but all participants in the study came from Hubei province and shared similar diet habits and lifestyles (mainly wheat flour, rice, pork, eggs, vegetables), which can largely reduce the impact of diet on outcomes. Fourth, while we discussed the potential roles of aberrant bacteria, the deep mechanism of association between gut microbiota alteration and SARS-CoV-2 infection and convalescence was not identified. In the future study, multi-omics analysis beyond 16S rRNA sequencing can be a good way to investigate the deep-seated mechanism of the gut-lung axis.
In conclusion, this study provides evidence for the presence of long COVID-19 in RPs at one-year after discharge, and gut microbiota may play an important role in long COVID-19.
 XML Download