

 PDF
PDF Citation
 Print
Print


INTRODUCTION
Breast milk is undoubtedly considered the best source of nutrition for most infants. Given the benefits of breastfeeding for babies and mothers, most international authorities emphasize the importance of exclusive breastfeeding (EBF) in early infancy.12 The optimal duration of breastfeeding remains uncertain; however, continued breastfeeding into late infancy is often recommended.3 The American Academy of Pediatrics (AAP) recommends EBF for the first 6 months followed by continued breastfeeding until 1 year of age or for as long as mothers and babies desire it.1 The World Health Organization recommends breastfeeding up to 24 months of age or beyond.2
Six months of EBF has several advantages, including the reduction of gastrointestinal infection rates in infants.3 However, there have been concerns about iron deficiency (ID) with this practice.4567 In particular, the total duration of all types of breastfeeding is associated with an increased risk of ID in late infancy and early childhood.8910 Thus, expert committees have emphasized the need for the appropriate introduction of iron-fortified complementary foods (CFs) while breastfeeding.1112 Moreover, the AAP recommends iron supplementation from 4 months of age, especially for exclusively breastfed infants.13
When the Korean National Health Screening Program for Infants and Children was launched in 2007, the recommendation of EBF for the first 6 months of life was adopted for nutritional counseling; however, the issue of continued breastfeeding for 12 months or longer was not adopted as an active recommendation. In addition, iron supplementation during breastfeeding is not routinely recommended, despite the unpopularity of iron-fortified cereals in Korea.14 Therefore, concerns about ID might be one of the factors hindering long-term breastfeeding among Korean infants.
In our recent study of 619 healthy Korean infants aged average 11 months, infants who were exclusively or mostly breastfed until late infancy were at risk for ID.9 Moreover, the breastfed infants were more likely to have inadequate intake of red meat and a later introduction of CFs to their diet. Therefore, it can be assumed that infants who continued breastfeeding into late infancy have distinct dietary intake patterns that may increase their risk for ID. Several large-scale studies have determined the relationship between dietary patterns, such as meat consumption, and iron status in early childhood.1516 However, few national-level studies have reported the dietary behaviors or nutritional status of children with prolonged breastfeeding (PBF) beyond 1 year of age.
Therefore, using data from national representative surveys, we aimed to explore whether children who continued breastfeeding beyond 12 months of age have unique characteristics of dietary intake patterns and determine the relationship between feeding practices and their growth or nutritional status. Through this study, we expect to provide basic information for nutritional counseling for nursing mothers and healthcare providers, which will help establish healthy and optimal long-term breastfeeding practices in Korean children.
METHODS
Study design and population
This study was based on data from the Korea National Health and Nutrition Examination Survey (KNHANES), a national surveillance system designed to assess the health and nutritional status of non-institutionalized civilians in Korea. The nationwide cross-sectional survey has been conducted yearly since 2007 by the Korean Center for Disease Control and Prevention (KCDC). It is composed of 3 components: health interviews, health examinations, and nutrition surveys. The representative households were selected using a stratified and multi-stage clustered probability sampling design, and children aged ≥ 1 year were targeted for the study.
The health interviews and examinations were performed at a mobile examination center by a trained survey team, including health professionals and supporting staff, using face-to-face interview methods. The nutrition surveys were conducted by dieticians during home visits and involved collecting detailed information on dietary behavior, food security, and food intake. A detailed description of the KNHANES design and data profile has been published in a separate paper.17
We obtained data on children aged 12–23 months from the KNHANES conducted from 2010 to 2020. Detailed information regarding body measurements, dietary behavior, and food and nutrient intake was extracted from the health interviews, health examinations, and nutrition surveys. Children weighing < 2.5 kg at birth or whose data regarding dietary information was missing were excluded. The participants were divided into 2 groups according to the feeding types at 12 months of age extracted from the nutrition surveys. Furthermore, their growth, nutritional status, and dietary intake patterns were analyzed.
Measurements
Anthropometric variables
Weight and height measurements, obtained according to the standardized measurement protocol in the health examination, were transformed into age- and sex-standard deviation scores (z-scores). Weight for age z-score (WAZ) and weight for height z-score were presented using the 2017 Korean National Growth Chart.18 Weight gain after birth was expressed as fold weight gain by dividing the current weight (kg) by the birth weight (kg).
Dietary behaviors
Responses to the dietary behavior questionnaire designed for infants and young children (aged 12–48 months) in the nutrition survey were extracted for the variables of infant feeding practice: feeding type (breastfeeding or formula feeding), starting age (weeks) and duration (months) of each feeding module, age (months) at the introduction of CFs and cow’s milk, and types of dietary supplements taken until 12 months of age since birth. Feeding types at 1, 6, and 12 months were determined using the above data. When the children reported being breastfed at 12 months of age regardless of simultaneous formula feeding, they were defined as “children with PBF.” Conversely, children that were weaned before 12 months of age or never breastfed at 1, 6, and 12 months of age were defined as “children without PBF” for the analysis of this study. In addition, total breastfeeding duration was calculated for children reported to be breastfed.
For the children who reportedly had an experience of taking dietary supplements during their first year of life, data regarding the types of supplements (multivitamins/minerals, probiotics, colostrum nutrients, and others) were also collected.
Nutritional assessment
The food intake questionnaire in the nutrition survey was designed as an open-ended survey using the 24-hour recall method. Based on these findings, the nutrient intake of dishes and foods consumed during the last 24 hours, excluding breast milk and dietary supplements, was calculated and expressed as the total daily nutrient intake. Nutrient variables used in this study were total energy, protein, calcium, and iron. Nutrient intake adequacy was determined based on age-specific intake reference values from the 2020 Dietary Reference Intake for Koreans.19 Nutrient intake insufficiency was defined as total calorie intake less than the estimated energy requirement of 900 kcal/d for children aged 12 to 23 months and protein, calcium, and iron intake less than the estimated average requirement (15 g/d for protein, 400 mg/d for calcium, and 4.5 mg/d for iron).
According to the nutrition survey data, all dishes reported to be consumed in one day were classified into 22 different food codes representing food groups. For this study, the amount of each food group was summed up by each participant, and the total daily intake of the following 16 food groups was used as a variable for the analysis: cereals and grains, potatoes and starch, sugars and sweeteners, bean products, nuts and seeds, vegetables, fungi and mushrooms, fruits, seaweed, seasonings, oil and fat, meat and poultry, eggs, fish and shellfish, milk and dairy products, and beverages (non-alcoholic). Each dish and food was also converted to tertiary food codes according to the reference foods. Red meat from the meat and poultry group and anchovies from the fish and shellfish group were extracted as variables for analysis. Furthermore the daily intake of red meat and anchovies was calculated according to the tertiary food codes.
Statistical analyses
Sample weights were calculated based on the complex survey design, non-response rate, and post-stratification and applied to all analyses to represent the Korean population. Complex sample analysis was performed using the Rao–Scott χ2 test and generalized linear models to evaluate differences in categorical and continuous variables according to the 2 different feeding types. Complex sample logistic regression was used to analyze the relationship between feeding types and current growth, nutritional status, and dietary patterns. Furthermore, the adjusted odds ratio (aOR) and 95% confidence intervals (CIs) of the study variables were estimated, adjusting for possible confounders such as sex, age, birth weight, current body weight, or total calorie intake. To determine dietary factors associated with nutritional status, complex sample logistic regression was performed for subgroup analysis among children with PBF. Data are presented as weighted percentages and standard errors (SEs) for categorical variables and weighted mean ± SE for continuous variables. All analyses were performed using SAS software version 9.4 (SAS Institute Inc., Cary, NC, USA). The level of statistical significance was set at P < 0.05.
Ethics statement
The survey procedures and protocols were approved by the Institutional Review Board of the KDCA (IRB No. 2010-02CON-21-C, 2011-02CON-06-C, 2012-01EXP-01-2C, 2013-07CON-03-4C, 2013-12EXP-03-5C, 2018-01-03-P-A, 2018-01-03-C-A, 2018-01-03-2C-A) and written informed consent was obtained from all participants and/or their guardians for the survey. This study was conducted in accordance with the Declaration of Helsinki and approved by the IRB of Kangwon National University Hospital (IRB No. KNUH-2021-06-006).
RESULTS
General characteristics and dietary behaviors of the study population
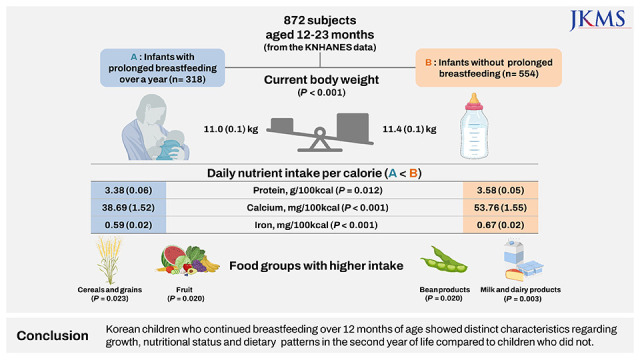
A total of 872 children aged 12–23 months with a birth weight of ≥ 2.5 kg were included in this study, and their weighted median age was 17.1 months. At 6 months of age, 30.0% of the study population was fully breastfed, and 20.7% were fully breastfed without formula feeding at 12 months of age. Among the study population, 34.2% were “children with PBF,” with a median breastfeeding duration of 14.2 months. Within this group, 66.2% were fully breastfed until at least 6 months of age and 60.5% were fully breastfed without formula feeding until at least 12 months of age.
The weighted mean age at the start of CF and cow’s milk intake were 6.0 and 13.0 months, respectively. A total of 45.9% of the participants reported experiencing dietary supplements during their first year of life. The detailed characteristics of the study population are presented in Table 1.
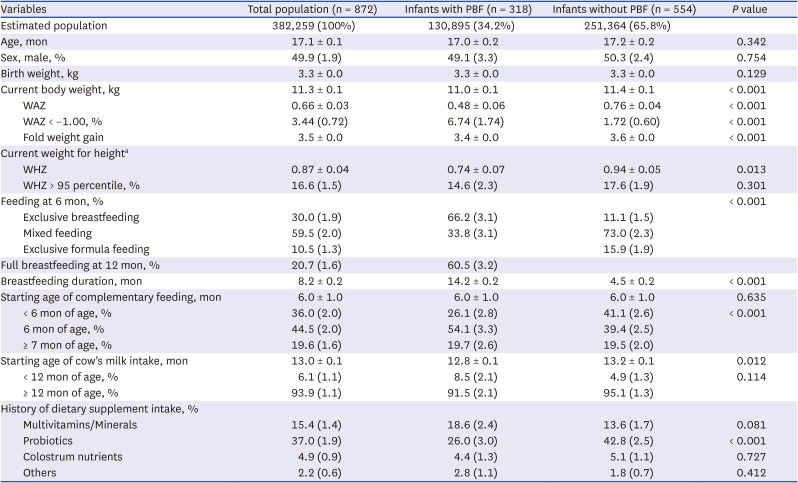
Table 1
Growth status and dietary behaviors of study population
All continuous variables are expressed as weighted mean ± standard errors. All categorical variables are expressed as weighted percentages (standard errors). Fold weight gain was calculated as current weight (kg) divided by birth weight (kg).
PBF = prolonged breastfeeding, WAZ = weight for age z-score, WHZ = weight for height z-score.
aNumber of participants with information about their height in health examination survey (n = 774).
![]()
Growth, dietary behaviors, and nutritional status of children with PBF
The growth, dietary behaviors, and nutritional status of children with PBF were analyzed by comparison with children without PBF. Children with PBF had a lower current weight (11.0 ± 0.1 vs. 11.4 ± 0.1 kg, P < 0.001) and WAZ (0.48 ± 0.06 vs. 0.76 ± 0.04, P < 0.001) and were significantly less likely to gain weight from birth (3.4 ± 0.0 vs. 3.6 ± 0.0, P < 0.001); however, there was no difference in birth weight between the two groups. Moreover, they were more likely to commence CFs intake at 6 months of age or thereafter compared to children without PBF, who were more likely to commence CFs intake before 6 months of age (26.1 [2.8]% vs. 41.1 [2.6]%, P < 0.001). In addition, children with PBF started consuming cow’s milk earlier than children without PBF, and the difference was statistically significant (12.8 ± 0.1 vs. 13.2 ± 0.1 months, P = 0.012). Regarding dietary supplements, children with PBF were less likely to take probiotics during their first year of life (26.0 [3.0]% vs 42.8 [2.5]%, P < 0.001). A comparison of growth and dietary behaviors between the two feeding type groups is presented in Table 1.
In the nutritional assessment of the two feeding types, a significant difference was observed in the daily intake of nutrients between the two groups (Table 2). Children with PBF had significantly lower intakes of total daily calories (930.7 ± 27.8 vs. 1,010.6 ± 19.4 kcal/day, P = 0.019), protein (31.4 ± 1.0 vs. 36.2 ± 0.9 g/day, P = 0.001), calcium (355.1 ± 14.6 vs. 547.7 ± 23.9 mg/day, P < 0.001), and iron (5.4 ± 0.2 vs. 6.9 ± 0.3 mg/day, P < 0.001) in their diet than children without PBF. Particularly, when comparing nutrient intake per calorie, children with PBF had significantly lower daily intakes of protein (3.38 [0.06] vs. 3.58 [0.05] g/100 kcal, P = 0.012), calcium (38.69 [1.52] vs. 53.76 [1.55] mg/100 kcal, P < 0.001) and iron (0.59 [0.02] vs. 0.67 [0.02] mg/100 kcal, P < 0.001) per calorie. Insufficiencies in the daily intake of protein, calcium, and iron were also significantly more prevalent among children with PBF (13.7 [2.2]% vs. 5.1 [1.3]% for protein, P = 0.001; 64.5 [3.0]% vs. 42.5 [2.6]% for calcium; P < 0.001, 45.9 [3.1]% vs. 32.8 [2.6]% for iron, P = 0.001). Additionally, children with PBF were significantly more likely to have cereals and grains (P = 0.023) and fruits (P = 0.020) but less likely to have bean products (P = 0.020) and milk and dairy products (P = 0.003) in their diet than children without PBF.
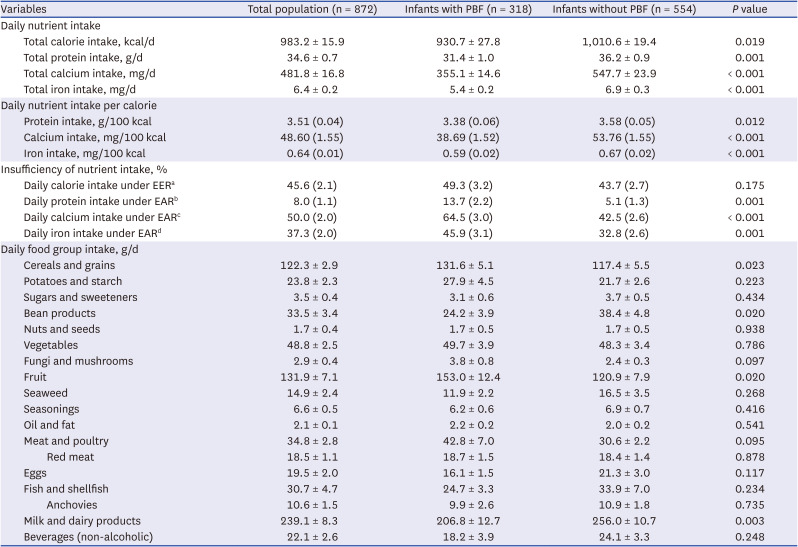
Table 2
Nutritional status and dietary intake patterns of study population
All continuous variables are expressed as weighted mean ± standard errors. All categorical variables are expressed as weighted percentages (standard errors).
PBF = prolonged breastfeeding, EER = estimated energy requirement, EAR = estimated average requirement.
aThe 900 kcal/d for 12–23 months of age; bEAR of protein, 15 g/d; cEAR of calcium, 400 mg/d; dEAR of iron, 4.5 mg/d.
![]()
Association of PBF with growth, nutritional status, and dietary patterns
To determine factors of the children associated with PBF, logistic regression analysis was performed after adjusting for confounders, as presented in Table 3. children with PBF had significantly lower odds of current body weight (aOR [95% CI], 0.666 [0.551–0.805], P < 0.001) and starting age of cow’s milk intake (aOR [95% CI], 0.885 [0.790–0.991], P = 0.034). In addition, they had higher odds of commencing complementary feeding after 6 months of age (aOR [95% CI], 2.088 [1.399–3.116], P < 0.001).
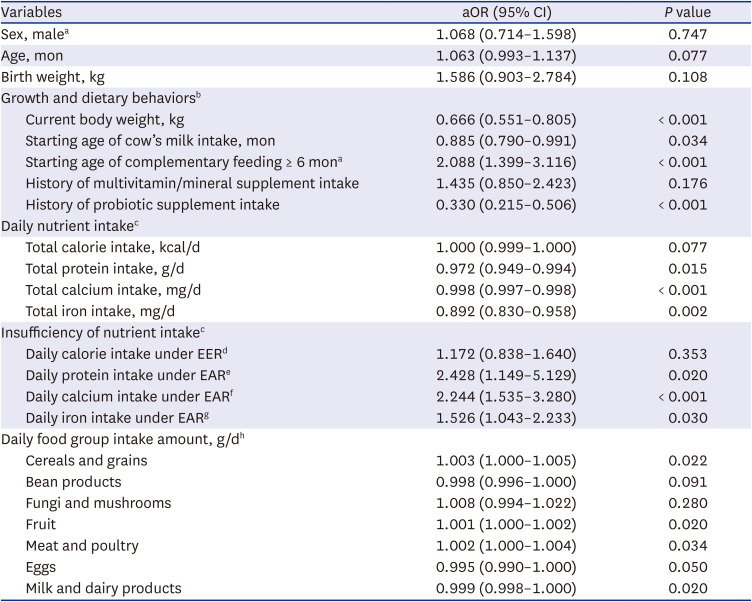
Table 3
The association of prolonged breastfeeding with growth, nutritional status, and dietary patterns
aOR = adjusted odds ratio, CI = confidence interval, EER = estimated energy requirement, EAR = estimated average requirement.
aA reference was female and starting age of complementary feeding < 6 months of age, respectively; bAdjusted for sex, age, and birth weight; cAdjusted for sex, age, current body weight, total calorie intake; dThe 900 kcal/d for 12–24 months of age; eEAR of protein, 15 g/d; fEAR of calcium, 400 mg/d; gEAR of iron, 4.5 mg/d; hAdjusted for sex, age, current body weight, and food group variables with P values < 0.2 from Table 2.
![]()
There was a statistically significant association between the feeding practice of PBF and the daily intake of protein, calcium, and iron. In other words, children with PBF were at more risk for insufficiencies in the daily intake of protein, calcium, and iron (aOR [95% CI], 2.428 [1.149–5.129] for protein, P = 0.020; 2.244 [1.535–3.280] for calcium, P < 0.001; 1.526 [1.043–2.233] for iron, P = 0.030) than children without PBF. In addition, multivariate analysis with food groups showed that children with PBF were significantly more likely to consume more cereals and grains (P = 0.022), fruits (P = 0.020), and meat (P = 0.034); in contrast, they consumed fewer eggs (P = 0.050) and milk and dairy products (P = 0.020) in their daily diet.
Dietary factors associated with the nutritional status of children with PBF
Subgroup analysis was performed in children with PBF to determine the dietary factors associated with their nutritional status. The risk of inadequate intake of nutrients, such as iron and calcium, was negatively correlated with total calorie intake (P < 0.001), regardless of current breastfeeding in children with PBF. In particular, insufficiency in calcium intake was significantly associated with a low intake of bean products (P < 0.05) and milk and dairy products (P < 0.001) in children with PBF. In addition, low daily intakes of cereals and grains (P < 0.001), potatoes (P < 0.05), bean products (P < 0.05), fruit (P < 0.05), meat and poultry (P < 0.05), including red meat (P < 0.05) and eggs (P < 0.001), were significantly associated with low iron intake from the daily diet of children with PBF. Factors associated with insufficiency of calcium and iron intake among children with PBF are presented in Supplementary Table 1.
DISCUSSION
This study demonstrated that children with PBF had lower body weight, smaller weight gain, and distinctive nutrient and dietary intake patterns compared with children without PBF at their second year of life. There was a significant difference in protein, calcium, and iron intake when assuming the same calorie intake. However, meat intake, including red meat, did not differ from those without PBF, and the intake of grains and fruit was relatively higher. These results indicate changes compared to our previous study of breastfed infants in late infancy.9 It showed that breastfeeding until late infancy was a significant risk factor for ID, and caregivers of exclusively breastfed children were significantly more likely to report their children’s inappropriate intake of red meat. In the present study, young children with PBF often have low iron intake in the second year of life; however, meat and grain intake appear to improve compared to late infancy. Since the two studies differ in the year of the study and the parameters investigated (caregiver’s subjective assessment vs. the calculated amount of food intake), there may be some limitations in concluding that this difference is due to the difference between late infancy and 12–23 months after birth. Nonetheless, it is thought that improving these dietary intake patterns can contribute to their growth catching up in later life, which could be evident through additional studies targeting later ages.
Breastfed children reportedly showed slower growth rates than formula-fed children during the first 2–4 years of life; however, the growth parameters and periods of growth difference used among studies are inconsistent.2021222324 A recent Korean study showed that children who were exclusively breastfed for the first 6 months of life were shorter and lighter up to approximately 4 years of age than mixed- or formula-fed children.25 Our results are similar, possibly because more than 2/3 of children with PBF were fully breastfed for 6 months. In addition, the number of children with WAZ < −1 (mildly underweight)2627 was significantly greater among children with PBF, although only two of them had WAZ < −2. In contrast, there was no significant difference between the two groups in the number of overweight children with weight-for-height > 95th percentile. That is, in children aged 12–23 months, the difference in the proportion of overweight children between children with PBF and those without PBF was not yet apparent. Thus, visible signs of mildly underweight or slow growth rate in some children with PBF rather than overgrowth in childrren without PBF can cause worry for parents of children during this period leading to hospital visits. In most cases, parent education regarding the natural growth patterns of children with PBF may be helpful. However, at the same time, when considering the results of this study, it is necessary to check whether the intake of nutrients such as protein, calcium, and iron was appropriate.
The percentage of calcium and iron intake insufficiency in our study population was 50.0% and 37.3%, respectively, which is similar for calcium and lower for iron than the prevalence rates observed in a previous study based on the 2007–2009 KNHANES.28 The average daily calcium and iron intake of total children increased from 425 to 482 mg and from 5.5 to 6.4 mg, respectively. Given that PBF may be a risk factor for insufficient calcium and iron intake in the 1-year-old group, the above trend might be due to the recent decrease in the rate of PBF29 and the increase in red meat intake in Korean population.30 However, the prevalence of inadequate calcium and iron intake was higher, and mean intakes were lower in Korean children compared with U.S. toddlers of the same age, although the reference values for adequate intake of these nutrients were higher in the U.S. study.31 In addition, compared to the data from the KNHANES targeting Korean adults, inadequate calcium and iron intake was found to be much higher in this age group.29 Therefore, it appears that a significant number of Korean children between 12 and 23 months of age may often consume less than the average daily requirement for calcium and iron, regardless of feeding type.
As for iron, the average daily intake differs by approximately 1.5 mg between children with PBF and those without, with the average intake exceeding the Korean recommended daily allowance of 6 mg for children without PBF. The main reason underlying the difference in iron intake between these two groups was not that breast milk intake was not included in the total nutrient values. Given the iron content of breast milk (up to 0.044 mg/100 kcal),32 if the average iron intake in the PBF group was comparable to that of children without PBF, children with PBF should have been breastfeeding an average of 3 to 4 liters or more per day. In children with PBF, dietary factor affecting iron intake was the intake of solid foods, including meat and eggs, although no such correlation was observed with the intake of milk and dairy products. Therefore, some PBF children may have low iron intake because, in addition to breastfeeding, which is very low in iron, they do not consume solid foods in adequate quantity and quality to meet the increased daily iron requirement in the second year of life. Recently, an increased red meat intake has been noted during infant nutritional counseling in clinical practice. This is presumed to be due to an increased rate of parent participation in health screening programs for infants and children where 6-month EBF and the inclusion of red meat in the supplementary diet for infants are actively promoted.33 Therefore, in addition to red meat intake, continued education to promote active intake of other iron-rich solid foods such as eggs, iron-fortified grains and/or vegetables may be essential to improve iron intake in children with PBF aged 12–23 months.30
Unlike iron, the calcium content in breast milk is significantly high and is known to have a particularly high absorption rate. Therefore, it is possible that the difference in calcium intake with and without PBF was slightly overestimated in our study. However, when only children aged 18–23 months, most of whom had already stopped breastfeeding, were analyzed separately, the average daily calcium intake difference between the two groups was similar to that seen in the entire 1-year-old group (390.41 [20.72] mg/day in children with PBF vs. 558.33 [44.45] mg/day in children without PBF, P < 0.001). This suggests that calcium intake may be insufficient in children with PBF if calcium-rich foods other than breast milk are not actively supplied during and after weaning in the second year of life. In our study, children with PBF who had calcium intake insufficiency had a relatively lower intake of milk, dairy and/or bean products after adjusting for variables than those with adequate calcium intake. However, there was no significant difference in the intake of fish with bone, meat and poultry, or eggs between children with insufficient calcium intake and those without it. Therefore, an active recommendation for calcium-rich food intake including milk, dairy products and vegetables in children with PBF may help increase calcium intake as in adults.30
The introduction of cow’s milk was significantly earlier in children with PBF; however, the difference was not much (12.8 months in children with PBF vs. 13.2 months in children without PBF). In addition, a slightly higher percentage of children with PBF were started on cow’s milk before 12 months of age; however, there was no significant difference between the groups. Therefore, it is believed that Korean mothers were well aware that it is undesirable to introduce cow’s milk before 12 months of age. Compared with the results from the 2007–2009 KNHANES, the percentage of children started on cow’s milk before 12 months was similar or slightly decreased from approximately 6.6% to 6.1%.28 Regarding the timing of introducing CFs, < 20% of children were started on CFs after 7 months in this study, indicating a significant decrease compared with the 33.1% in the 2007–2009 KNHANES study.28 The rate of starting CFs after 7 months was not related to PBF; however, on average, children with PBF were started on CFs at 6 months, while those without PBF were started on CFs at 4–5 months of age, and this difference was significant. In current health screening programs for children, the recommended timing of CF introduction is 6 months; thus, 6 months of EBF is strongly promoted.1434 Our result showed a good agreement with this recommendation. Approximately 26% of children with PBF were started on CFs at 4–5 months of age, which is similar to or slightly lower than that reported in our previous study, where approximately 30% of children in the 6-month EBF group were started on CFs at 4–5 months of age.9
Patterns of dietary supplement intake were also different according to the breastfeeding practices. The intake of probiotics, the most frequently used supplement in our study, was significantly higher in children without PBF. In contrast, the intake of multivitamins/minerals was higher in children with PBF; however, it was insignificant. This agrees with recommendations in clinical practice, specifically the recommendation of vitamin D and iron supplementation for breastfeeding children.14 As probiotics were available in powdered forms in the past, their intake was not convenient for breastfeeding children. Thus, rather than giving them to children, nursing mothers often took the probiotics prophylactically to prevent allergies of their babies.35 In addition, formula-fed children tend to produce harder stools; therefore, it is a common practice among parents to mix probiotics with formula in such instances for a stool-softening effect. The percentage of probiotic intake in the whole study population also increased significantly from 14.7% to 37% compared with the results of the 2007–2009 KNHANES study,28 and the intake rate for children with PBF was also high at 26%. Thus, it is expected that the intake rate of probiotics may increase further in the future.
To the best of our knowledge, this study is the first to analyze food group intake patterns in children with PBF compared with those without PBF. In the present study, children with PBF had a smaller body weight but a significantly higher intake of cereals, grains and fruits and a similar intake of meat and poultry. It seems that children in the second year of life who have been breast-fed for a long time may have a better solid food intake pattern than children without PBF in some respects. This increase in the intake of solid foods may enable breastfed children to later catch up in growth. These food intake patterns in children with PBF may also inferred to be related to the relatively high educational level of mothers with EBF.36
However, other than the higher intake of cereals, grains and fruits, there was no significant difference in the total intake of protein-rich foods, including meat and poultry, eggs, and fish. Moreover, the intake of milk and dairy and bean products was lower and the intake of eggs was also significantly lower after adjustement for body weight in children with PBF. This difference in food intake patterns may explain the lower protein and calcium intake in children with PBF compared to those without, who consumed formula or cow’s milk products high in protein and calcium. Regarding protein intake, some studies suggest that breastfeeding children do not have protein insufficiency and that children who do not breastfeed consume excessive amounts of protein, increasing their risk for childhood obesity.223738 In our study, although the mean intake of protein was low compared with that of U.S. children of the same age,31 the prevalence of protein intake insufficiency was generally low regardless of the feeding type. In a Korean pediatric study comparing body mass index (BMI) up to 6 years of age according to the infant feeding method, there was no significant difference in BMI between the children with 6 months EBF and those without, except for the 2-years-old age group.25 Therefore, further research on this subject with school-age Korean children is needed to determine the clinical significance of the relatively low protein intake in toddlers with PBF compared to those without PBF in our study population.
As this study was based on the KNHANES, its major strength is the representativeness of the data. However, the study has some limitations. For example, the accuracy and consistency of the daily intake amounts for each food group and calculated nutrient values may have been limited by the single 24-hour recall method.39 The fact that intakes from dietary supplements and breast milk were not included in the total nutrient intake, albeit in small amounts, is a matter to be considered when interpreting nutrient intake values per day. However, considering the amount of protein, calcium, and iron per calorie in the breast milk (approximately 1.4 g, 41.1 mg, and 0.044 mg per 100 kcal, respectively),32 the difference between the average protein and mineral intake of the two groups according to PBF status was generally too large to be significantly affected by the possible underestimation associated with breast milk intake in some children with PBF.
In conclusion, based on 10 years of KNHANES data (2010–2020), this study identified that PBF was associated with unique children’s characteristics regarding growth, nutritional status, and dietary patterns in the second year of life. Growth was relatively slow, and daily intake of protein, calcium, and iron per calorie was lower in children with PBF than in children without PBF. Milk and dairy product intake was lower in children with PBF; however, meat intake was similar, and grain and fruit intake were higher. This study will provide important fundamental data for nutritional counseling for nursing mothers and healthcare providers to establish healthy long-term breastfeeding practices in Korean children.
 XML Download