Journal List > Nutr Res Pract > v.17(2) > 1516082206

Li and Lee: Causal relationship among quality factors, emotional responses, and satisfaction of school food service in Henan province, China

Abstract

BACKGROUND/OBJECTIVES

School food service has played an important role in promoting the health and physical condition of students by providing students with a balanced and nutritious diet. Therefore, boosting the quality of school food service and improving the students’ satisfaction is critical. For this purpose, this study examined the structural causal relationship among the quality of school food service factors, emotional responses, and satisfaction in China.

SUBJECTS/METHODS

This study was conducted with 4th–6th-grade students from 6 junior high schools in Henan province of China, with 590 questionnaire responses (87.3%) collected and statistically analyzed.

RESULTS

The school food service quality factors (including menu management, dietary education, facilities management, price and food distribution management, and personal hygiene during meals) must be enhanced to boost the students’ satisfaction. In addition, the study used questionnaire survey data to validate the full mediation of students’ emotional responses between school food service quality factors and student satisfaction.

CONCLUSIONS

Students’ emotions also play an important role in influencing the quality of school food service, all of which affect the emotional responses of students. Therefore, students’ positive emotions are an important indicator for improving the quality of school food service. A national support policy is necessary for the ongoing maintenance and development of various programs that drive students' satisfaction and promote the adoption of education guidelines for school food service in China.

INTRODUCTION

Children and adolescents are in a crucial period of body growth and maturation, so adequate nutrition is important for these groups. Experiencing rapid body growth and maturation, school-aged children require a nutritious and balanced diet for their health, well-being, and academic achievements in the long term [12]. School food service has played a remarkable role in promoting the health and physical condition of students by providing them with balanced and nutritious food, raising their motivation for learning, improving their academic performance, and developing proper eating habits [3].
In 1987, China launched its first School Lunch Program in Hangzhou, Zhejiang province, aiming to strengthen the health and physique of Chinese adolescents. In 1998, China released regulations on the Amount of Nutritional Provision for School Lunch as the national standard, which has not been amended to date [4]. In 1993, China launched the National School Lunch Program to strengthen the health and physique of adolescents across China [56]. In 2011, a national school meal program targeting rural children - the Nutrition Improvement Program for Rural Compulsory Education Students (NIPRCES), was enacted by the General Office of the State Council [7]. Under this program, the NIPRCES-covered primary school and secondary-school children are subsidized with CNY 4 and 5 per person per day, respectively. Over the past few years, the Chinese government has continuously invested enormous resources in implementing this program, delivering a high coverage rate and efficiency. More than 33.6 million rural schoolchildren across 29 provinces had benefited from NIPRCES by August 2016 [8]. Evidence shows that the prevalence of malnutrition and anemia among rural children has been curbed with the implementation of NIPRCES [9]. Up to 2019, the total school canteens in China reached 318,600, with an 84% coverage rate of schools with canteens; the number of school canteens in prefecture-level cities was 52,800, with a 91% coverage rate of the total school cafeteria [10]. On the other hand, although school food service has played a positive role, it was reported that students, as the main customers of school food, are still facing many problems, such as unbalanced nutrition, low satisfaction with the school food, and school plate waste [411], which have significantly lowered the efficiency of the National School Lunch Program. The surplus of nutritious lunches has led to the waste of resources and caused the insufficient intake of nutrients by students [12]. People have gradually realized the inefficiency and cost of implementing these nutritious lunch plans alone without making full use of the food at the same time. Therefore, the issue of how to utilize all the food by school-aged children has started to attract the wide attention of the public [3].
The characteristics of school food service quality are that food is a tangible element and services are intangible elements. These tangible and intangible levels of service quality change the students’ satisfaction with school food service. School food service plays a vital role in improving the students’ participation and feelings in the long term [13]. The quality of school food service, including taste, shape, color, hygiene, environmental factors, and meal-preparing staff compliance with hygiene rules, will affect students’ emotions and satisfaction/dissatisfaction level directly [14]. The emotional responses to the services are manifested mainly as temporary emotions, individual subjective thoughts, and feelings. Most are positive emotions, such as pleasures and joys, or negative emotions, such as surprises and anxieties [15]. According to previous research, an emotional response is an intermediary variable of satisfaction that can directly affect satisfaction [1617]. A comparative study of cafeteria and dessert cafes through the role of emotional responses confirmed that the emotional response is a leading variable affecting the behavior intention of cafe visitors [18]. Tangibility, the effects of responsiveness and certainty, and the relationship of service quality with the emotional responses and behavioral intentions as Korean restaurant service quality factors were analyzed [19].
Therefore, to improve students’ satisfaction with school food, it is necessary to improve the quality of their food service by supplying a wide variety of menus and actively collecting students’ comments to trigger students’ positive emotions about school food [20]. In addition, it is necessary to conduct in-depth research to understand the service quality that may influence the emotional responses of customers in fierce competition under the rapid growth of the food service industry recently. Further exploration is required to help effective sales strategies for food service find the quality of food service that determine the satisfaction of consumers in the food service industry [21]. However, there are few studies on the causal relationships between emotional responses and satisfaction regarding the food service quality of school food.
Therefore, this study provides basic data to improve students’ satisfaction by boosting the quality of school food service while determining the factors affecting the quality of food service that may affect the consumers’ emotional responses and satisfaction to offer competitive strategic plans and development directions for Chinese school food service in this rapidly growing industry.

SUBJECTS AND METHODS

Subjects

As the research object, Henan Province is the center of Chinese history, located in the central region of China, and is the third-largest province in China in terms of population [22]. With rapid economic growth, the gross domestic product of Henan was more than 400 billion yuan in 2020 [23]. Henan Province is one of the 41 pilot counties to implement the “Student Nutrition Improvement Program” for rural compulsory education students in China [24].
To explore the students’ attitudes towards school canteens, from the perspective of development level and population, 600 students from Zhengzhou city, Zhoukou city, and Shenqiu county were selected using a random sampling method to participate in the survey from August 28 to September 15, 2019. Students from the 6 schools agreed to supply data in the survey. With the cooperation of classroom teachers, the questionnaires were distributed to those students who accepted school food during the night class to complete the self-administered questionnaires. The investigators were responsible for explaining the experiment details to students to ensure they understood all items. The investigators then examined the completeness of the questionnaires collected from 590 students; 66 questionnaires were poorly completed and were excluded from this study. Therefore, 524 were finally used for data analysis (with a response rate of 87.3%). This study was approved by the University Industry-Academic Cooperation Foundation Review Board (approval number: 201907-SB-0128).

Questionnaires

The questionnaire items for this study were modified based on those from a previous study [2526]. The survey consisted of 4 sections. The first section was about the respondents’ demographic information, consisting of 3 questions on gender, school operation type, and school locations. The second section was about the food service quality [2627]. The validity and reliability were combined to verify the exploratory factor analysis and internal consistency of 53 school food quality attribute measurement items. In the factor extraction process, the factors with a factor loading greater than 0.5 and an eigenvalue greater than one were used for decomposition. After eliminating 13 items that did not match the factor name, they were divided into 5 factors: menu management, dietary education, facilities environment, price and food distribution management, and personal hygiene during meals. The third section was about emotional responses. The emotional response to school canteens was measured using 10 items. After removing 2 items that did not match the factor name, the remaining 8 items were divided into 2 factors into the positive emotional responses and negative ones [2829]. The modified index was used to verify the relationship among school food quality, emotional response, and satisfaction and to increase the fitting degree of the model. The school food quality was determined to be removed from 12 of 40 measurement items, and 28 measurement items were used. The emotional response consisted of 9 measurement items; one was removed, and 8 measurement items were used. The optimal model was derived by re-analyzing the modified model. The questionnaires on the students’ satisfaction were composed of related studies [303132]. All the items adopted the 5-point Likert-type scale.

Research hypothesis

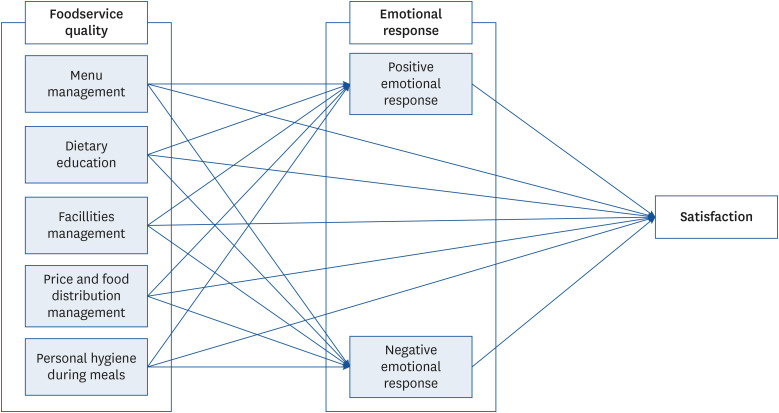
Referring to previous research models, this study was conducted to determine the structural causal relationship among the quality of Chinese school food service, emotional responses, and satisfaction of students. The quality service influenced the customers’ emotional responses, while all the customers’ emotional responses affected the satisfaction and behavioral intention [33]. In a study on the relationship between the service landscape of coffee shops and the positive emotions and satisfaction of customers, positive emotion of customers had a positive impact on satisfaction [34]. The coffee shop service scape has a partial (positive or negative) influence on the emotional responses of customers, and the emotional responses of customers affect satisfaction and behavioral intention [35]. The customers’ emotional responses caused by physical environments increased their satisfaction [28]. A study on the influences of restaurant choice attributes on the customers’ emotional response and satisfaction showed that the emotional response of customers positively affect their satisfaction [36]. The impact of the physical environment of Korean-style dessert cafes on customer satisfaction and behavior intention through the emotional reaction also indicated that the customers’ positive and negative emotional reactions to the physical environment had significant mediating effects between the physical environment and satisfaction. Based on this, this study proposes the following research hypotheses; the main variables are expected to have relationships, as depicted in Fig. 1.
Fig. 1

Conceptual framework of the study.

nrp-17-356-g001

Hypothesis 1

School food service quality factors will differ significantly depending on the emotional responses.
  • H1-1: Menu management will have a positive (+) effect on the positive emotional responses.

  • H1-2: Dietary education will have a positive (+) effect on the emotional responses.

  • H1-3: Facility management will have a positive (+) effect on the positive emotional responses.

  • H1-4: Price and food distribution management will have a positive (+) effect on the positive emotional responses.

  • H1-5: Personal hygiene during meals will have a positive (+) effect on the positive emotional responses.

  • H1-6: Menu management will have a negative (−) effect on negative emotional responses.

  • H1-7: Dietary education will have a negative (−) effect on negative emotional responses.

  • H1-8: Facility management will have a negative (−) effect on the negative emotional response.

  • H1-9: Price and food distribution management will have a negative (−) effect on the negative emotional response.

  • H1-10: Personal hygiene during meals will have a negative (−) effect on the negative emotional responses.

Hypothesis 2

Emotional responses will differ significantly depending on satisfaction.
  • H2-1: Positive emotional response will have a positive (+) effect on satisfaction.

  • H2-2: Negative emotional responses will have a negative (−) effect on satisfaction.

Hypothesis 3

School food service quality factors will be significantly different depending on satisfaction.
  • H3-1: Menu management will have a positive (+) effect on satisfaction.

  • H3-2: Dietary education will have a positive (+) effect on satisfaction.

  • H3-3: Facility management will have a positive (+) effect on satisfaction.

  • H3-4: Price and food distribution management will have a positive (+) effect on satisfaction.

  • H3-5: Personal hygiene during meals will have a positive (+) effect on satisfaction.

Statistical analysis

All data collected were analyzed with SPSS 25.0 and AMOS 25.0 statistical software. The exploratory factor analyses and reliability tests were performed to test the unidimensionality of multiple items that comprised each factor. After evaluating the validity of the measured items by performing confirmatory factor analyses on each factor, structural equation modeling was implemented to determine the path coefficients of the research model.

RESULTS

General characteristics

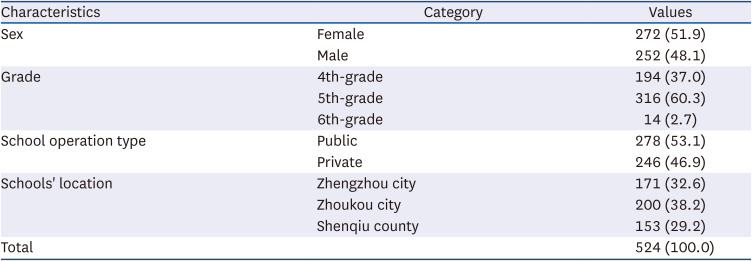
As shown in Table 1, for the general characteristics of the respondents, 252 (48.1%) of the 524 participants were male and 227 (51.9%) female. There were 194 (37.0%) 4th-grade students, 316 (60.3%) 5th-grade students, and 246 (46.9%) 6th-grade student. Regarding the school operation type, 278 (53.1%) were from public schools, and 246 (46.9%) were from private schools. One hundred and seventy-one students (32.6%) were in Zhengzhou city, 200 (38.2%) in Zhoukou city, and 153 (29.2%) in Shenqiu county.
Table 1

General characteristics of the respondents (n = 524)

nrp-17-356-i001
Characteristics Category Values
Sex Female 272 (51.9)
Male 252 (48.1)
Grade 4th-grade 194 (37.0)
5th-grade 316 (60.3)
6th-grade 14 (2.7)
School operation type Public 278 (53.1)
Private 246 (46.9)
Schools' location Zhengzhou city 171 (32.6)
Zhoukou city 200 (38.2)
Shenqiu county 153 (29.2)
Total 524 (100.0)
Values are presented as number of patients (%).

One-dimensional verification and validity analysis of research tools

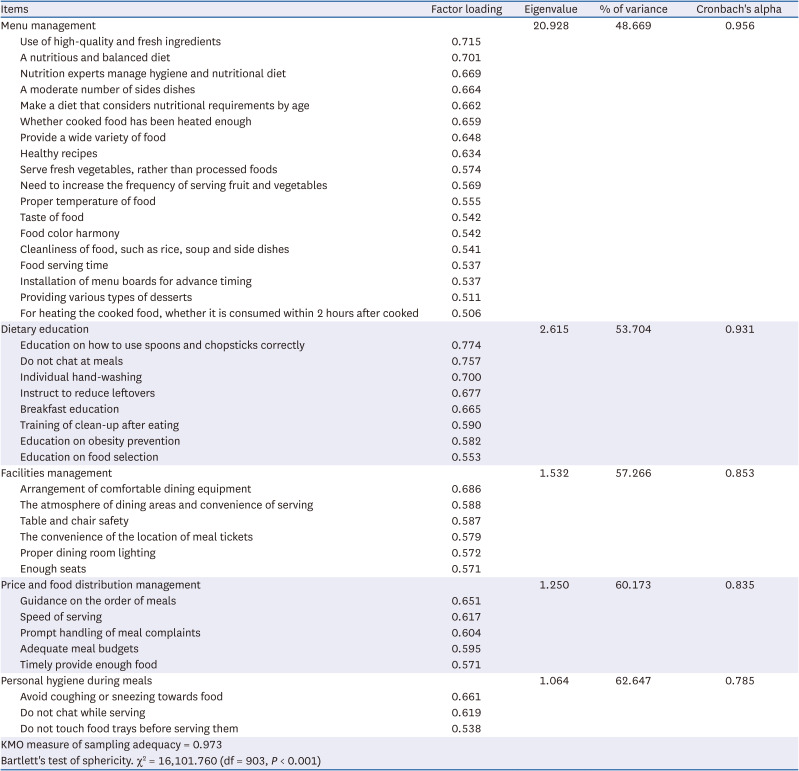
Table 2 lists the results of the exploratory factor and reliability analysis of school food service quality. Five factors were extracted based on the results of exploratory factor analysis on the items of school food service quality. School food quality was categorized into 5 factors: menu management, dietary education, facilities management, price and distribution management, and personal hygiene during meals. The reliability of these findings was supported by Cronbach’s alpha coefficients of 0.956, 0.931, 0.853, 0.835, and 0.785, respectively. Table 3 lists the results of exploratory factor and reliability analysis of emotional response. The respective Cronbach’s alpha reliability coefficients for factors 1 and 2 were reported to be 0.893 and 0.918. Factor 1 was named positive emotional responses, and Factor 2 was named negative emotional responses. Table 4 presents the results of the exploratory factor and reliability analysis of satisfaction. The respective Cronbach’s alpha reliability coefficients for factors were reported to be 0.804 and were called satisfaction.
Table 2

Exploratory factor and reliability analysis of the school food service quality

nrp-17-356-i002
Items Factor loading Eigenvalue % of variance Cronbach's alpha
Menu management 20.928 48.669 0.956
Use of high-quality and fresh ingredients 0.715
A nutritious and balanced diet 0.701
Nutrition experts manage hygiene and nutritional diet 0.669
A moderate number of sides dishes 0.664
Make a diet that considers nutritional requirements by age 0.662
Whether cooked food has been heated enough 0.659
Provide a wide variety of food 0.648
Healthy recipes 0.634
Serve fresh vegetables, rather than processed foods 0.574
Need to increase the frequency of serving fruit and vegetables 0.569
Proper temperature of food 0.555
Taste of food 0.542
Food color harmony 0.542
Cleanliness of food, such as rice, soup and side dishes 0.541
Food serving time 0.537
Installation of menu boards for advance timing 0.537
Providing various types of desserts 0.511
For heating the cooked food, whether it is consumed within 2 hours after cooked 0.506
Dietary education 2.615 53.704 0.931
Education on how to use spoons and chopsticks correctly 0.774
Do not chat at meals 0.757
Individual hand-washing 0.700
Instruct to reduce leftovers 0.677
Breakfast education 0.665
Training of clean-up after eating 0.590
Education on obesity prevention 0.582
Education on food selection 0.553
Facilities management 1.532 57.266 0.853
Arrangement of comfortable dining equipment 0.686
The atmosphere of dining areas and convenience of serving 0.588
Table and chair safety 0.587
The convenience of the location of meal tickets 0.579
Proper dining room lighting 0.572
Enough seats 0.571
Price and food distribution management 1.250 60.173 0.835
Guidance on the order of meals 0.651
Speed of serving 0.617
Prompt handling of meal complaints 0.604
Adequate meal budgets 0.595
Timely provide enough food 0.571
Personal hygiene during meals 1.064 62.647 0.785
Avoid coughing or sneezing towards food 0.661
Do not chat while serving 0.619
Do not touch food trays before serving them 0.538
KMO measure of sampling adequacy = 0.973
Bartlett's test of sphericity. χ2 = 16,101.760 (df = 903, P < 0.001)
KMO, Kaiser-Meyer-Olkin; df, degrees of freedom.
Table 3

Exploratory factor and reliability analysis of the emotional responses

nrp-17-356-i003
Items Factor loading Eigenvalue % of variance Cronbach's alpha
Positive emotional responses 4.341 48.231 0.893
When using school food, I was pleasant 0.859
When using school food, I was comfortable 0.841
The lively atmosphere of school food made me excited 0.840
When using school food, I was happy 0.827
Believe in school food 0.777
Negative emotional responses 2.430 27.000 0.918
When using school food, I was unpleasant 0.891
When using school food, I was annoyed 0.890
Feeling disappointed about school food 0.887
The chaotic atmosphere of school food makes me angry 0.880
KMO measure of sampling adequacy = 0.869
Bartlett's test of sphericity. χ2 = 3,108.775 (df = 36, P < 0.001)
KMO, Kaiser-Meyer-Olkin; df, degrees of freedom.
Table 4

Exploratory factor and reliability analysis of satisfaction

nrp-17-356-i004
Items Factor loading Eigenvalue % of variance Cronbach's alpha
I am generally satisfied with the school food 0.645 2.155 71.827 0.804
It was a good experience for me to use school food 0.754
Talking positively about school food to my parents or friends 0.756
KMO measure of sampling adequacy = 0.696
Bartlett's test of sphericity. χ2 = 518.696 (df = 36, P < 0.001)
KMO, Kaiser-Meyer-Olkin; df, degrees of freedom.

Confirmatory factor analysis of the measurement model

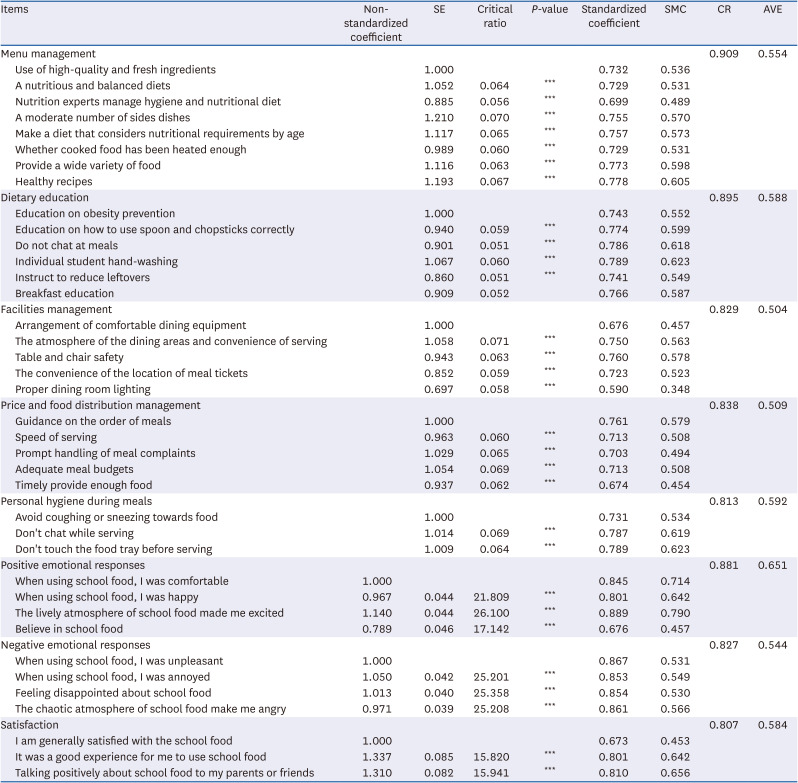
Table 5 lists the results of the confirmatory factor analysis of the measurement model. The fit of the measurement model was examined with several fit indices, with the following results obtained: χ2 = 871.479 (P < 0.001, degrees of freedom [df] = 318), goodness of fit index (GFI) = 0.892, adjusted goodness of fit index (AGFI) = 0.872, comparative fit index (CFI) = 0.933, root mean square error of approximation (RMSEA) = 0.052. These results satisfied the recommended standards, while also proving that the model is appropriate. The average variance extracted (AVE) estimates of the school food service quality ranged from 0.504 to 0.592. The emotional responses (2 factors) and satisfaction ranged from 0.453 to 0.790, which were higher than the minimum threshold of 0.5 [3738]. The composite reliability (CR) of the school food service quality ranged from 0.813 to 0.909; the emotional responses (2 factors) and satisfaction ranged from 0.807 to 0.881, which exceeded the threshold of the acceptance level of 0.7.
Table 5

Confirmatory factor analysis of the measurement model

nrp-17-356-i005
Items Non-standardized coefficient SE Critical ratio P-value Standardized coefficient SMC CR AVE
Menu management 0.909 0.554
Use of high-quality and fresh ingredients 1.000 0.732 0.536
A nutritious and balanced diets 1.052 0.064 *** 0.729 0.531
Nutrition experts manage hygiene and nutritional diet 0.885 0.056 *** 0.699 0.489
A moderate number of sides dishes 1.210 0.070 *** 0.755 0.570
Make a diet that considers nutritional requirements by age 1.117 0.065 *** 0.757 0.573
Whether cooked food has been heated enough 0.989 0.060 *** 0.729 0.531
Provide a wide variety of food 1.116 0.063 *** 0.773 0.598
Healthy recipes 1.193 0.067 *** 0.778 0.605
Dietary education 0.895 0.588
Education on obesity prevention 1.000 0.743 0.552
Education on how to use spoon and chopsticks correctly 0.940 0.059 *** 0.774 0.599
Do not chat at meals 0.901 0.051 *** 0.786 0.618
Individual student hand-washing 1.067 0.060 *** 0.789 0.623
Instruct to reduce leftovers 0.860 0.051 *** 0.741 0.549
Breakfast education 0.909 0.052 0.766 0.587
Facilities management 0.829 0.504
Arrangement of comfortable dining equipment 1.000 0.676 0.457
The atmosphere of the dining areas and convenience of serving 1.058 0.071 *** 0.750 0.563
Table and chair safety 0.943 0.063 *** 0.760 0.578
The convenience of the location of meal tickets 0.852 0.059 *** 0.723 0.523
Proper dining room lighting 0.697 0.058 *** 0.590 0.348
Price and food distribution management 0.838 0.509
Guidance on the order of meals 1.000 0.761 0.579
Speed of serving 0.963 0.060 *** 0.713 0.508
Prompt handling of meal complaints 1.029 0.065 *** 0.703 0.494
Adequate meal budgets 1.054 0.069 *** 0.713 0.508
Timely provide enough food 0.937 0.062 *** 0.674 0.454
Personal hygiene during meals 0.813 0.592
Avoid coughing or sneezing towards food 1.000 0.731 0.534
Don't chat while serving 1.014 0.069 *** 0.787 0.619
Don't touch the food tray before serving 1.009 0.064 *** 0.789 0.623
Positive emotional responses 0.881 0.651
When using school food, I was comfortable 1.000 0.845 0.714
When using school food, I was happy 0.967 0.044 21.809 *** 0.801 0.642
The lively atmosphere of school food made me excited 1.140 0.044 26.100 *** 0.889 0.790
Believe in school food 0.789 0.046 17.142 *** 0.676 0.457
Negative emotional responses 0.827 0.544
When using school food, I was unpleasant 1.000 0.867 0.531
When using school food, I was annoyed 1.050 0.042 25.201 *** 0.853 0.549
Feeling disappointed about school food 1.013 0.040 25.358 *** 0.854 0.530
The chaotic atmosphere of school food make me angry 0.971 0.039 25.208 *** 0.861 0.566
Satisfaction 0.807 0.584
I am generally satisfied with the school food 1.000 0.673 0.453
It was a good experience for me to use school food 1.337 0.085 15.820 *** 0.801 0.642
Talking positively about school food to my parents or friends 1.310 0.082 15.941 *** 0.810 0.656
SMC, square of multiple coefficient; CR, composite reliability; AVE, average variance extracted.
***P < 0.001.

Path analyses of school food service quality, emotional response, and satisfaction

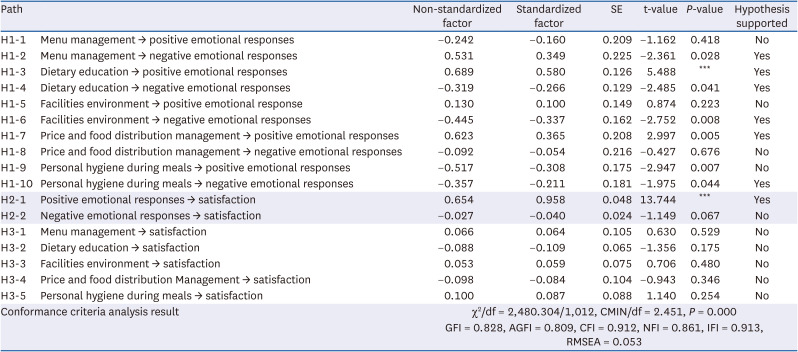
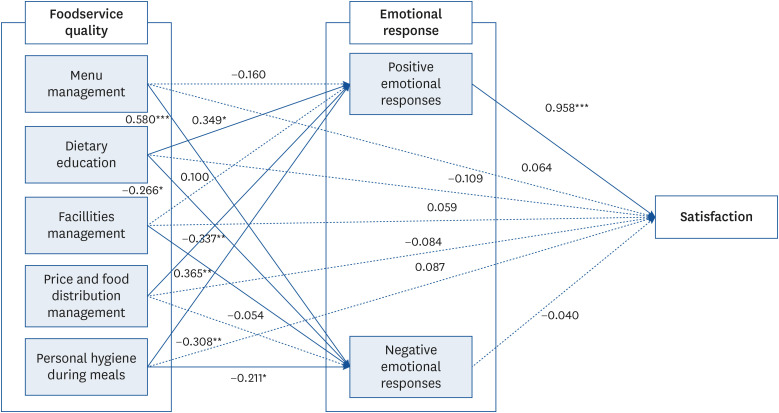
Table 6 and Fig. 2 presents the results of the research hypothesis test. The hypothesis that school food service quality affects emotional responses was partially accepted. Hypothesis 1-3, which predicted that dietary education on school food service quality would positively influence positive emotional responses, was supported by the positive standardized coefficient of 0.580 (β = 0.126, t = 5.488, P < 0.001). Hypothesis 1-4, which predicted that the price and distribution management of school food service quality would have a positive influence on the positive emotional responses, was also supported by a positive standardized coefficient of 0.365 (β = 0.208, t = 2.997, P < 0.01). Hypothesis 2-1, which predicted that menu management of school food service quality would influence the negative emotional responses, was also supported by a standardized coefficient of 0.349 (β = 0.225, t = −2.361, P < 0.05). Hypothesis 2-2, which predicted that dietary education of school food service quality would have a negative influence on the negative emotional responses, was also supported by a negative standardized coefficient of −0.266 (β = 0.129, t = −2.485, P < 0.05). Hypothesis 2-3, which predicted that the facility management of school food service quality would have a negative influence on the negative emotional responses, was supported by a negative standardized coefficient of −0.337 (β = 0.162, t = −2.752, P < 0.01). Finally, Hypothesis 2-5, which predicted that personal hygiene during the meals of school food service quality would have a negative influence on the negative emotional responses, was also supported by the negative standardized coefficient of −0.308 (β = 0.181, t = −1.975, P < 0.05). Therefore, Hypotheses 1-2, 1-4, 2-1, 2-2, 2-3, and 2-5 were supported, but Hypotheses 1-1, 1-3, 1-5, and 2-4 were rejected.
Table 6

Results of the hypotheses tests

nrp-17-356-i006
Path Non-standardized factor Standardized factor SE t-value P-value Hypothesis supported
H1-1 Menu management → positive emotional responses −0.242 −0.160 0.209 −1.162 0.418 No
H1-2 Menu management → negative emotional responses 0.531 0.349 0.225 −2.361 0.028 Yes
H1-3 Dietary education → positive emotional responses 0.689 0.580 0.126 5.488 *** Yes
H1-4 Dietary education → negative emotional responses −0.319 −0.266 0.129 −2.485 0.041 Yes
H1-5 Facilities environment → positive emotional response 0.130 0.100 0.149 0.874 0.223 No
H1-6 Facilities environment → negative emotional responses −0.445 −0.337 0.162 −2.752 0.008 Yes
H1-7 Price and food distribution management → positive emotional responses 0.623 0.365 0.208 2.997 0.005 Yes
H1-8 Price and food distribution management → negative emotional responses −0.092 −0.054 0.216 −0.427 0.676 No
H1-9 Personal hygiene during meals → positive emotional responses −0.517 −0.308 0.175 −2.947 0.007 No
H1-10 Personal hygiene during meals → negative emotional responses −0.357 −0.211 0.181 −1.975 0.044 Yes
H2-1 Positive emotional responses → satisfaction 0.654 0.958 0.048 13.744 *** Yes
H2-2 Negative emotional responses → satisfaction −0.027 −0.040 0.024 −1.149 0.067 No
H3-1 Menu management → satisfaction 0.066 0.064 0.105 0.630 0.529 No
H3-2 Dietary education → satisfaction −0.088 −0.109 0.065 −1.356 0.175 No
H3-3 Facilities environment → satisfaction 0.053 0.059 0.075 0.706 0.480 No
H3-4 Price and food distribution Management → satisfaction −0.098 −0.084 0.104 −0.943 0.346 No
H3-5 Personal hygiene during meals → satisfaction 0.100 0.087 0.088 1.140 0.254 No
Conformance criteria analysis result χ2/df = 2,480.304/1,012, CMIN/df = 2.451, P = 0.000
GFI = 0.828, AGFI = 0.809, CFI = 0.912, NFI = 0.861, IFI = 0.913, RMSEA = 0.053
df, degrees of freedom; CMIN, chi-square minimum; GFI, goodness of fit index; AGFI, adjusted goodness of fit index; CFI, comparative fit index; NFI, normed fit index; IFI, incremental fit index; RMSEA, root mean square error of approximation.
**P < 0.01, ***P < 0.001.
Fig. 2

Results of the research hypothesis.

*P < 0.05, **P < 0.01, ***P < 0.001.
nrp-17-356-g002
Hypothesis 3-1, which predicted that positive emotional responses would have a positive influence on satisfaction, was also supported by a positive standardized coefficient of 0.958 (β = 0.048, t = 13.744, P < 0.001). Therefore, Hypothesis 3-1 was accepted, and Hypothesis 3-2 was rejected. These findings also support the hypothesis that positive emotional responses influence customer satisfaction.
The above research results are consistent with the conclusions of many previous studies [3940], which indicate a relationship between customer satisfaction and positive emotional responses. In addition, a previous study [33] on the effects of the service scape on customer emotional responses and behavioral intention in the field of school food identifies that behavioral factor loyalty has a significant influence on pre-purchase, a finding consistent with the results of this research, meaning that when school meals are enjoyed, a higher quality of experience indicates higher positive emotions. In other words, positive emotions will be boosted when the value of the school feeding experience students pursue is consistent with what they expect. Hence, the emotional responses of students can become positive if the quality of school food, the physical environment, and the elements that students would enjoy are appropriately managed. These results suggest that the management of school food quality is very important for diminishing the negative emotions of students.

Mediating role of emotional responses in the relationship between school food service quality and satisfaction

Table 7 lists the results of the mediating model of emotional responses in the relationship between school food service quality and satisfaction. According to study of Baron and Kenny [41], mediators speak to the capacity of a third factor of the generative component by which the dependent variables (DV) can be affected by the independent variables (IV). Hence, mediation effect analysis was performed to determine how and why the 2 sets of variables are related. The bootstrapping procedures [42] are performed to test the mediating effects. As a parameter estimation method, bootstrapping tests the significance of the confidence intervals (CIs) and the representativeness of the indirect influence of intermediary models that cannot assume the multivariate normal distribution [43]. By performing 500 bootstrapping operations in a 95% CI, it was confirmed that P < 0.05 is significant when zero is not included.
Table 7

Mediating role of emotional responses in the relationship between school food service quality and satisfaction

nrp-17-356-i007
Items Estimate SE 95% CI
Menu management → positive emotional responses → satisfaction 0.419 0.260 −0.025 to 0.962
Menu management → negative emotional responses → satisfaction −0.058 0.297 −0.637 to 0.441
Dietary education → positive emotional responses → satisfaction −0.225 0.156 0.549 to 0.067
Dietary education → negative emotional responses → satisfaction 0.588 0.152 0.287 to 0.876
Facilities management → positive emotional responses → satisfaction −0.393 0.211 −0.759 to 0.029
Facilities management → negative emotional responses → satisfaction 0.124 0.212 0.300 to 0.513
Price and food distribution management → positive emotional responses → satisfaction 0.033 0.356 −0.470 to 0.952
Price and food distribution management → negative emotional responses → satisfaction 0.671 0.461 0.091 to 1.520
Personal hygiene during meals → positive emotional responses → satisfaction −0.583 0.331 −1.288 to −0.038
Personal hygiene during meals → negative emotional responses → satisfaction −0.608 0.396 −1.240 to −0.157
CI, confidence interval.
In this study, emotional responses mediate between food service quality and satisfaction. The mediating effect of the positive emotional responses on the relationship between menu management and food service satisfaction included zero as the upper, and lower limits of a range from −0.025 to 0.962 were shown in the 95% CI. In other words, the mediating effect of positive emotional responses was statistically insignificant at the P < 0.05 level.
For the relationship between dietary education and food service satisfaction, the mediating effect of the positive and negative emotional responses had upper and lower limits of 0.549 to 0.067 and 0.287 to 0.876, respectively, in the 95% CI, indicating that zero was not included. Therefore, the mediating effect of the positive and negative emotional responses was statistically significant at the P < 0.05 level. In conclusion, both positive and negative emotional responses have a mediating effect on the relationship between dietary education and satisfaction. The mediating effect of positive emotional responses on the relationship between price and distribution management and satisfaction included zero as the upper and lower limits from −0.470 to 0.952 in the 95% CI. Therefore, the mediating effects of positive emotional responses were not significant at the P < 0.05 level. For the relationship between the price and distribution management and food service satisfaction, the mediating effect of negative emotional responses showed upper and lower limits of 0.091 to 1.520 in the 95% CI, indicating that zero was not included. Therefore, the mediating effect of positive emotional responses was statistically significant at the P < 0.05 level. In conclusion, for the relationship between price and distribution management and food service satisfaction, the negative emotional responses apparently have no mediating effect, but the positive emotional responses have such an effect.
The mediating effect of the positive and negative emotional responses on the relationship between personal hygiene during meals and satisfaction was found to include zero as the upper and lower limits in the ranges of −1.288 to −0.038 and −1.240 to −0.157 in the 95% CI. The mediating effects of the positive and negative emotional responses were significant at the P < 0.05 level. Therefore, both positive and negative emotional responses have a mediating effect on the relationship between personal hygiene during meals and satisfaction.
The results above indicate that positive emotional responses mediate the relationship between school food service quality attributes (such as dietary education, price and distribution management, and personal hygiene during meals) and satisfaction. On the other hand, negative emotional responses also mediate the relationship between school food service quality (such as dietary education and personal hygiene during meals) and satisfaction.
According to previous studies [1321], a better service quality perceived by customers would induce a positive emotional response. This theory is consistent with the findings of this study. In this theory, emotional responses are an important variable in evaluating the physical environment. This differs from previous studies that revealed only the direct relationship between quality factors of the school food service and satisfaction. Hence, the relationship among the quality factors of the school food service, emotional responses, and satisfaction was investigated.

DISCUSSION

This study examined the quality of school food service among high school students engaged with school food programs in Henan Province, China, by exploring the causal relationship among emotional responses, food service quality, and satisfaction, with its research content summarized as follows.
Factor analysis was applied to 42 questions related to food service quality, 9 questions related to emotional responses, and 3 questions related to satisfaction. In previous studies on the quality and image of school food service and student satisfaction, school food service quality extracted 4 factors (food, sanitation, services, and food distribution) [44]. In the study of improving perception and satisfaction with school food service, the quality of school service was divided into 5 factors: recipes, taste, hygiene, environment, and operation services [45]. In the present study, the school food service quality attributes were divided into 5 factors to investigate the satisfaction of school food quality attributes referring to previous research [214445]. The emotional responses attribute category was grouped into 2 factors. Kaiser-Meyer-Olkin (KMO) values greater than or equal to 0.7 and Bartlett test values less than 0.05 were considered good. The analysis results of school food service quality were KMO = 0.973 and Bartlett test value = 16,101.760 (P < 0.01), indicating that the use of factor analysis was appropriate. The reliability verification results showed that the reliability coefficient was above 0.6, and the reliability was verified. After the factors were identified through exploratory factor analysis, confirmatory factor analysis of the measurement model was performed with AMOS to establish the validity.
As shown in path analysis, the dietary education and the price and distribution of the school food service quality had a positive (+) effect on the positive emotional responses. On the other hand, menu management, facilities management, and personal hygiene during meals had no significant influence. On the other hand, menu management, dietary education, facilities management, and personal hygiene during meals had a negative (−) effect on the negative emotional responses. In addition, positive emotional responses had a positive (+) effect on satisfaction. Based on the above results, as found in mediating effect analysis, positive emotional responses played a mediating role in the relationship between school food service quality (such as dietary education, price and distribution management, and personal hygiene during meals) and satisfaction. The negative emotional responses also mediated the relationship between school food service quality (such as dietary education and personal hygiene during meals) and satisfaction.
From the academic implications of the results of this study, existing research has not provided consistent results on the relationship between the emotional response and satisfaction with food services [15]. This study divided the emotional responses into positive and negative emotional responses to verify the relationship with satisfaction. In addition, the limitations of statistical analysis of variables that only verify their correlation were overcome. The formal analysis of observed variables and the structural equation modeling was conducted to verify the relationship among the school food service quality, emotional response, and satisfaction. The results showed a positive correlation between the students’ emotional responses to school food service and satisfaction.
The practical implication of the results of this study is that it is one of the strategies to improve students’ satisfaction with school food to master the psychology of the service when formulating the school food service system. Students provided with positive emotions rate the school food service quality as high. Therefore, it is important to supply simple meals in school food, but frequent recreational activities that encourage students to participate voluntarily and arouse their interests may also help induce positive emotions, thereby increasing the students’ satisfaction. These findings can be used as basic data to make suitable nutrition policies in the future, with proper regulation of school food service quality.
The limitations of this study were the small number of cities and object schools limited to parts of Henan province. In addition, the survey object was only for junior high school. It did not confirm the actual school food service operation system and content of the primary school, high school, and university. Therefore, future research should take junior high school, primary school, senior high school, and college students as samples to verify the representativeness of the samples so that the research on school food service can be popularized.

Notes

Conflict of Interest: The authors declare no potential conflicts of interests.

Author Contributions:

  • Conceptualization: Li M, Lee YE.

  • Formal analysis: Li M.

  • Investigation: Li M.

  • Methodology: Li M, Lee YE.

  • Supervision: Lee YE.

  • Validation: Lee YE.

  • Writing - original draft: Li M.

  • Writing - review & editing: Lee YE.

References

1. Liu Y, Cheng S, Liu X, Cao X, Xue L, Liu G. Plate waste in school lunch programs in Beijing, China. Sustainability (Basel). 2016; 8:1288.
2. Huang Z, Gao R, Bawuerjiang N, Zhang Y, Huang X, Cai M. Food and nutrients intake in the school lunch program among school children in Shanghai, China. Nutrients. 2017; 9:582. PMID: 28590431.
3. Tang HM, Fang H, Xu HL. Diet and nutrition survey among primary and secondary school students in Minhang district of Shanghai city. Chin J Public Health. 2013; 29:1143–1146.
4. Ministry of the Health People’s Republic of China. WS/T 100-1998. Amount of Nutritional Provision for School Lunch [Internet]. Beijing: Ministry of the Health People’s Republic of China;1998. cited 2021 May 10. Available from: https://www.renrendoc.com/paper/112965121.html.
5. Zhai FY, Cao RX, Fu JJ, Wang ZH, Zhang LW. Current status of nutritional lunch in primary and high schools of Beijing. Can J Public Health. 2007; 1:7–12.
6. Min K, Wang J, Liao W, Astell-Burt T, Feng X, Cai S, Liu Y, Zhang P, Su F, Yang K, et al. Dietary patterns and their associations with overweight/obesity among preschool children in Dongcheng district of Beijing: a cross-sectional study. BMC Public Health. 2021; 21:223. PMID: 33504346.
7. Zhang F, Hu X, Tian Z, Zhang Q, Ma G. Literature research of the nutrition improvement program for rural compulsory education students in China. Public Health Nutr. 2015; 18:936–943. PMID: 24866472.
8. Zhou L, Wang JX, Jiang B. The impact of rural compulsory education nutrition improvement program on students’ health. Chin Rural Surv. 2021; 2:97–100.
9. Liu J. Building educational community for left-behind children in rural China: a case study of a small rural school in Hubei province. Peddie F, Liu J, editors. Economics, Law, and Institutions in Asia Pacific. Singapore: Springer;2021. p. 15–39.
10. Ministry of Education of the People’s Republic of China. The nationwide school canteen rate reached 84% [Internet]. Beijing: Ministry of Education of the People's Republic of China;2019. cited 2021 May 10. Available from: http://www.moe.gov.cn/jyb_xwfb/xw_fbh/moe_2606/2019/tqh20191125/sfcl/201911/t20191125_409551.html.
11. Duan JL, Pan YP, Teng LX, Zhao R, Qin Y. Nutrition quality of self-feeding lunch in the primary and secondary schools in Beijing. Chin J Sch Health. 2012; 33:651–653.
12. Cheng SK, Gao LW, Xu ZR, Tang CC, Wang L, Dhruba Bijaya GC. Food waste in catering industry and its impacts on resources and environment in China. Chin Soft Sci. 2012; 7:106–114.
13. Kim HC. A study on the causal model of students’ perceived service quality, affect and satisfaction in college and university foodservices. Korean J Tourism Res. 2006; 20:245–262.
14. Clemes MD, Gan C, Sriwongrat C. Consumers’ choice factors of an upscale ethnic restaurant. J Food Prod Mark. 2013; 19:413–438.
15. Liljander V, Strandvik T. Emotions in service satisfaction. Int J Serv Ind Manage. 1997; 8:148–169.
16. Oh HM, Cho HJ, Jeong C. An effect of servicescape on emotional response and satisfaction: focusing on Incheon International Airport. J Tourism Leis Res. 2018; 30:119–141.
17. Lee KA, Park SY, Lyu ES. Relationship between foodservice satisfaction and customer loyalty of university dormitory foodservice in Gyeongsangbuk-do area. J Korean Soc Food Sci Nutr. 2017; 38:1271–1278.
18. Jani D, Han H. Influence of environmental stimuli on hotel customer emotional loyalty response: testing the moderating effect of the big five personality factors. Int J Hospit Manag. 2015; 44:48–57.
19. Moon HS. A study on the influences of restaurant choice attributes on the customers emotional response and satisfaction - focusing on the differences in types of restaurants. J Hosp Tourism Stud. 2015; 17:203–218.
20. Park MH, Choi YS, Kim YJ. Comparison of dietary attitudes and attitudes to the school lunch service of elementary and middle school students living in the same region. Korean J Community Nutr. 2002; 7:3–13.
21. Cha SS, Shin MH. The effect of delivery food on customer emotional response and repurchase intention. Korean J Food Health Converg. 2021; 7:1–10.
22. People’s Government of Henan Province. Henan Province Information [Internet]. Zhengzhou: People’s Government of Henan Province;2018. cited 2021 May 10. Available from: https://baike.baidu.com/reference/132980/26168qZVMe8xb9sgkCMDcPtQA0GDjNhjlFAHCFJa8vBaYSwIKFi3RnlNEVLcnvWM4Ci3GFwULI5lyGOdrwcBa2zQR3LKZmi_CCQ.
23. People’s Government of Henan Province. In 2019, the province’s economic operation was generally stable, with steady progress [Internet]. Zhengzhou: People’s Government of Henan Province;2020. Available from: https://baike.baidu.com/reference/132980/4093rTbyJ7jlfgmRo8wbxvoAhXnWi5hgIjYB8x6nmu3O9eLzKGgsfC7WGzxkIEi5Uum43UhNd9ZImorWYNI6eaq-T14Ez4W2sHk4zZA.
24. People’s Government of Henan Province. Implementation of the pilot work of the nutrition improvement plan for rural compulsory education students in Henan Province [Internet]. Zhengzhou: People’s Government of Henan Province;2012. cited 2021 May 10. Available from: http://jyt.henan.gov.cn/2012/02-29/1654292.html.
25. Din N, Rani AA, Ridzuan FHF, Zulkifli CN, Tarmizi SAA, Ghazali N, Abdullah D, Kamal SBM. Gauging students’ perception and attitudes towards Halal products and logos. Radzi SM, Mohd Hanafiah MH, Sumarjan N, Mohi Z, Sukyadi D, Suryadi K, Purnawarman P, editors. Heritage, Culture and Society: Research Agenda and Best Practices in the Hospitality and Tourism Industry. London: CRC Press;2016. p. 729–733.
26. Abdullah D, Hamir N, Nor NM, Krishnaswamy J, Rostum AMM. Food quality, service quality, price fairness and restaurant re-patronage intention: the mediating role of customer satisfaction. Int J Acad Res Bus Soc Sci. 2018; 8:211–226.
27. Krishna M, Lim EC, Ooi CY, Ooi SY, Ooi YW, Tan MW. Customer loyalty to newly opened cafés and restaurants in Malaysia. J Foodserv Bus Res. 2017; 20:525–541.
28. Park SH. The effects of school feeding service quality on students’ practice and satisfaction of school feeding - focusing on high school students in Daegu. Korean J Tourism Res. 2015; 29:69–82.
29. Lee JU, Lee YK, Ahn SM. Effects of experiential value and emotional responses on brand satisfaction and brand loyalty in the family restaurant context. Food Serv Ind J. 2017; 13:123–140.
30. Kim WG, Lee YK, Yoo YJ. Predictors of relationship quality and relationship outcomes in luxury restaurants. J Hosp Tour Res (Wash DC). 2006; 30:143–169.
31. Kamal S, Bukhari N, Abdullah D, Din N. Tourists’ satisfaction and loyalty towards food tourism in Georgetown, Penang. Radzi SM, Mohd Hanafiah MH, Sumarjan N, Mohi Z, Sukyadi D, Suryadi K, Purnawarman P, editors. Heritage, Culture and Society: Research Agenda and Best Practices in the Hospitality and Tourism Industry. London: CRC Press;2016. p. 393.
32. Leninkumar V. The relationship between customer satisfaction and customer trust on customer loyalty. Int J Acad Res Bus Soc Sci. 2017; 7:450–465.
33. Lee YC, Ahn SH. The influence of foodservice servicescape on customers’ emotional reaction and behavioral intention. J Foodserv Manag. 2016; 19:61–78.
34. Kim YK. A study on the relationship between physical servicescape and social servicescape, positive emotion of customer and satisfaction in coffee shop. J Foodserv Manag. 2017; 20:25–55.
35. Jung MW, Son ES, Lee JH. Effects of coffee shop servicescape on the emotional reaction and behavioral intention of customers and the moderating effect of background music. J Hosp Tour Res (Wash DC). 2016; 40:69–86.
36. Moon HS. A study on the Influences of restaurant choice attributes on the customers’ emotional response and satisfaction - Focusing on the differences in types of restaurants. J Hosp Tour Res (Wash DC). 2015; 17:203–218.
37. Anderson JC, Gerbing DW. Structural equation modeling in practice: a review and recommended two-step approach. Psychol Bull. 1988; 103:411–423.
38. Kline RB. Software review: Software programs for structural equation modeling: AMOS, EQS, and LISREL. J Psychoed Assess. 1998; 16:343–364.
39. Lee SY. A study on effect of customer emotion and satisfaction by hotel employee’s nonverbal communication. J Hotel Resort. 2011; 10:139–150.
40. Lee JR, Yoo D, Lee YK. The effect of web interactivity of e-brand on relationship quality and customer loyalty. J Korean Oper Res Manag Sci Soc. 2004; 29:73–93.
41. Baron RM, Kenny DA. The moderator-mediator variable distinction in social psychological research: conceptual, strategic, and statistical considerations. J Pers Soc Psychol. 1986; 51:1173–1182. PMID: 3806354.
42. Preacher KJ, Hayes AF. SPSS and SAS procedures for estimating indirect effects in simple mediation models. Behav Res Methods Instrum Comput. 2004; 36:717–731. PMID: 15641418.
43. Heo J. Heo Jun’s Easily Follow to Structural Equation Modeling MOS. Seoul: Hanara Publishing;2013. p. 104–111.
44. Yim HR, Kim HS. A study on the quality and image of school meal service and student satisfaction with the service: focused on moderating effect of distribution types. Korean J Culinary Res. 2013; 11:11–22.
45. Park JE, Choi KS. Improving perception and satisfaction on middle and high school foodservice: the role of student participation program in serving school meals. Korean J Community Nutr. 2018; 23:243–256.
TOOLS
Similar articles